Adding routes and areas
Route
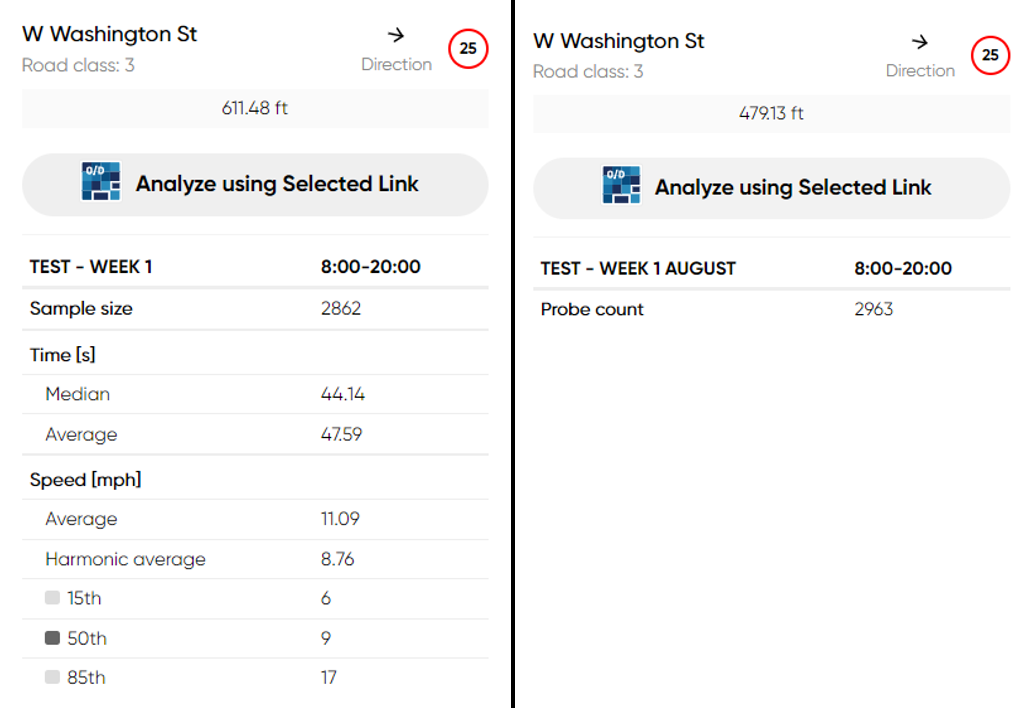
Route Analysis calculates statistics for a defined route between its start point and a destination, optionally with via points.
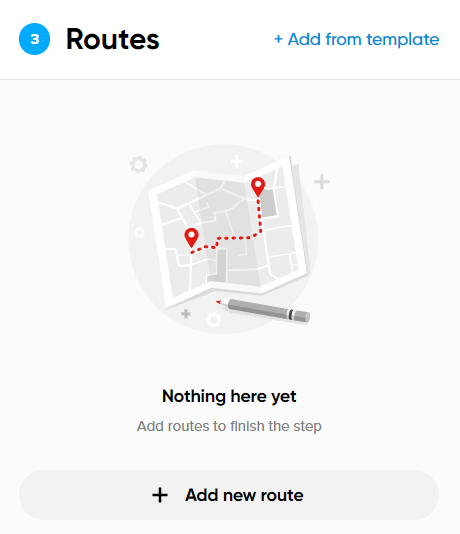
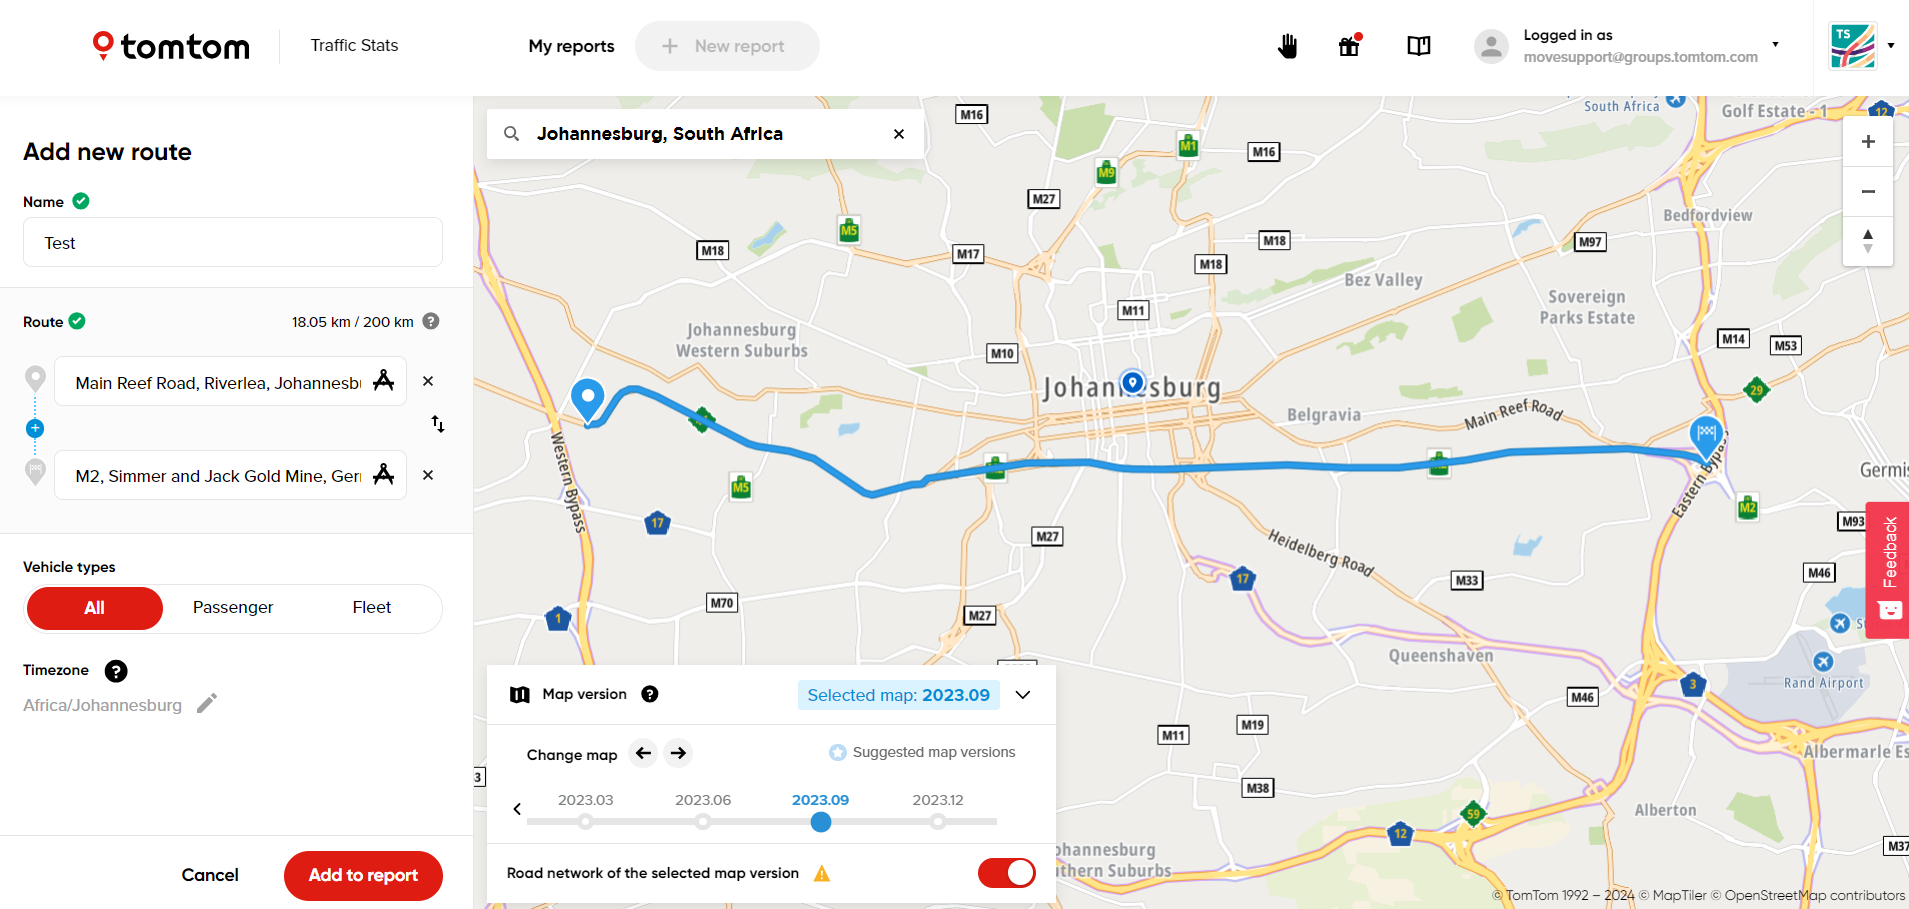
Click Add new route to start drawing or Add from template if you previously saved one:
Follow these steps to add a route:
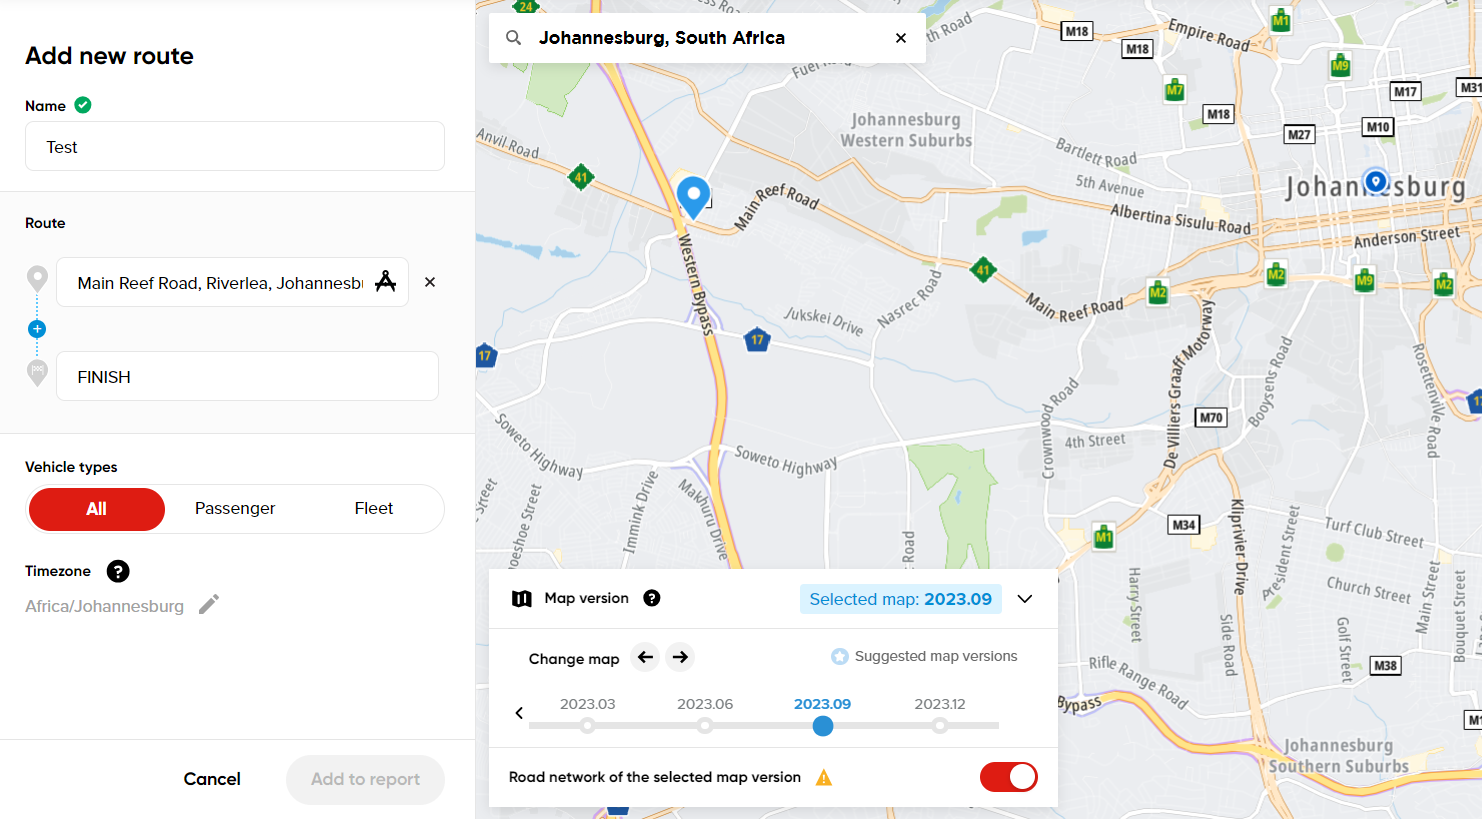
1. Provide a name.
2. Select the Start and the Finish points.
You can select these points on the map or type them into the Start and Finish fields.
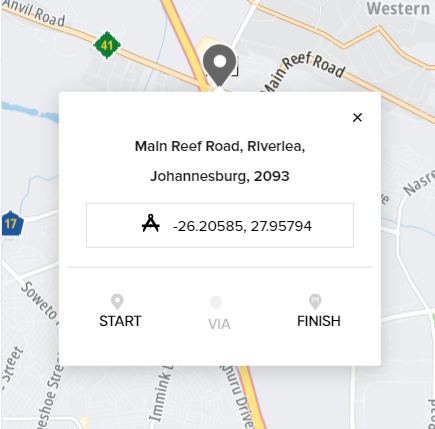
Important: If you would like to add a via point, first you must select your start and finish points. You can also use via points to adjust your route geometry to its proper location.
The maximum route length is 200 kilometers.
3. Select the vehicle type: All, Passenger or Fleet.
- Passenger: GPS location data from non-professional regular drivers.
- Fleet: GPS location data from professional fleet vehicles, including trucks of different sizes and weights, urban delivery vehicles, and leasing passenger cars. No vehicle type distinction is made within the Fleet data category.
4. Select the map version.
- Using different map versions is only advised in advanced use cases when you know about previous road geometry changes (before construction works and after it) and you want to perform a detailed analysis of how much data has changed because of that road event. Otherwise, it's always advised to use the map version recommended by the tool.
You can read more about map versions in this section:
5. To finish adding a route to your analysis, click Add to report.
The maximum number of routes is 20.
Area - Full
Click Add new area to start drawing a polygon or Add from template if you previously saved one:
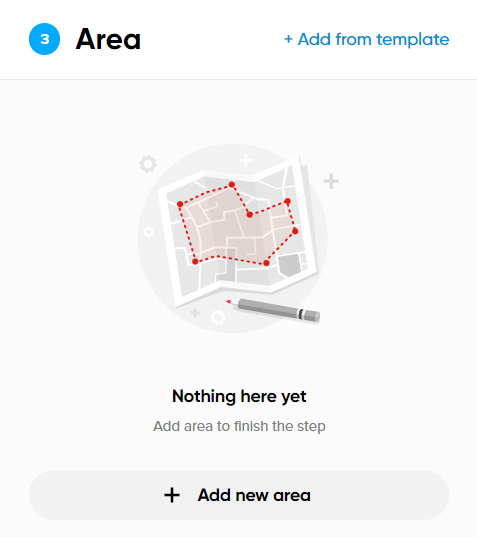
Follow these steps to add an area:
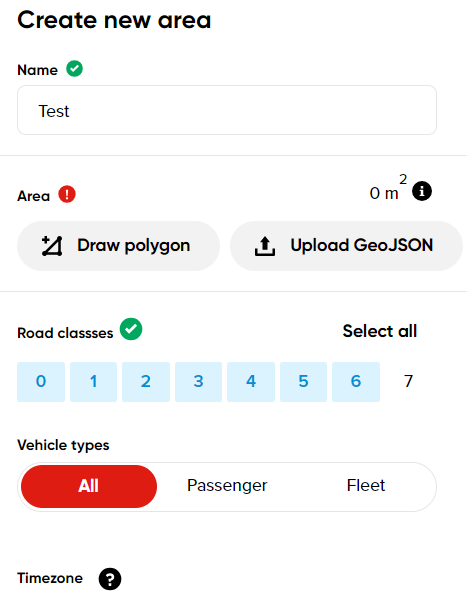
1. Provide a name.
2. Click Draw polygon or Upload GeoJSON.
- Drawing a Polygon: Define an area by placing dots on the map and right-clicking to complete the polygon.
- Upload GeoJSON: Upload a GeoJSON file from your device. It is possible to upload the GeoJSON file with multiple polygons (take note that the polygons in a multipolygon may not overlap, and may only touch at single points).
The maximum area size is 20,000 km2.
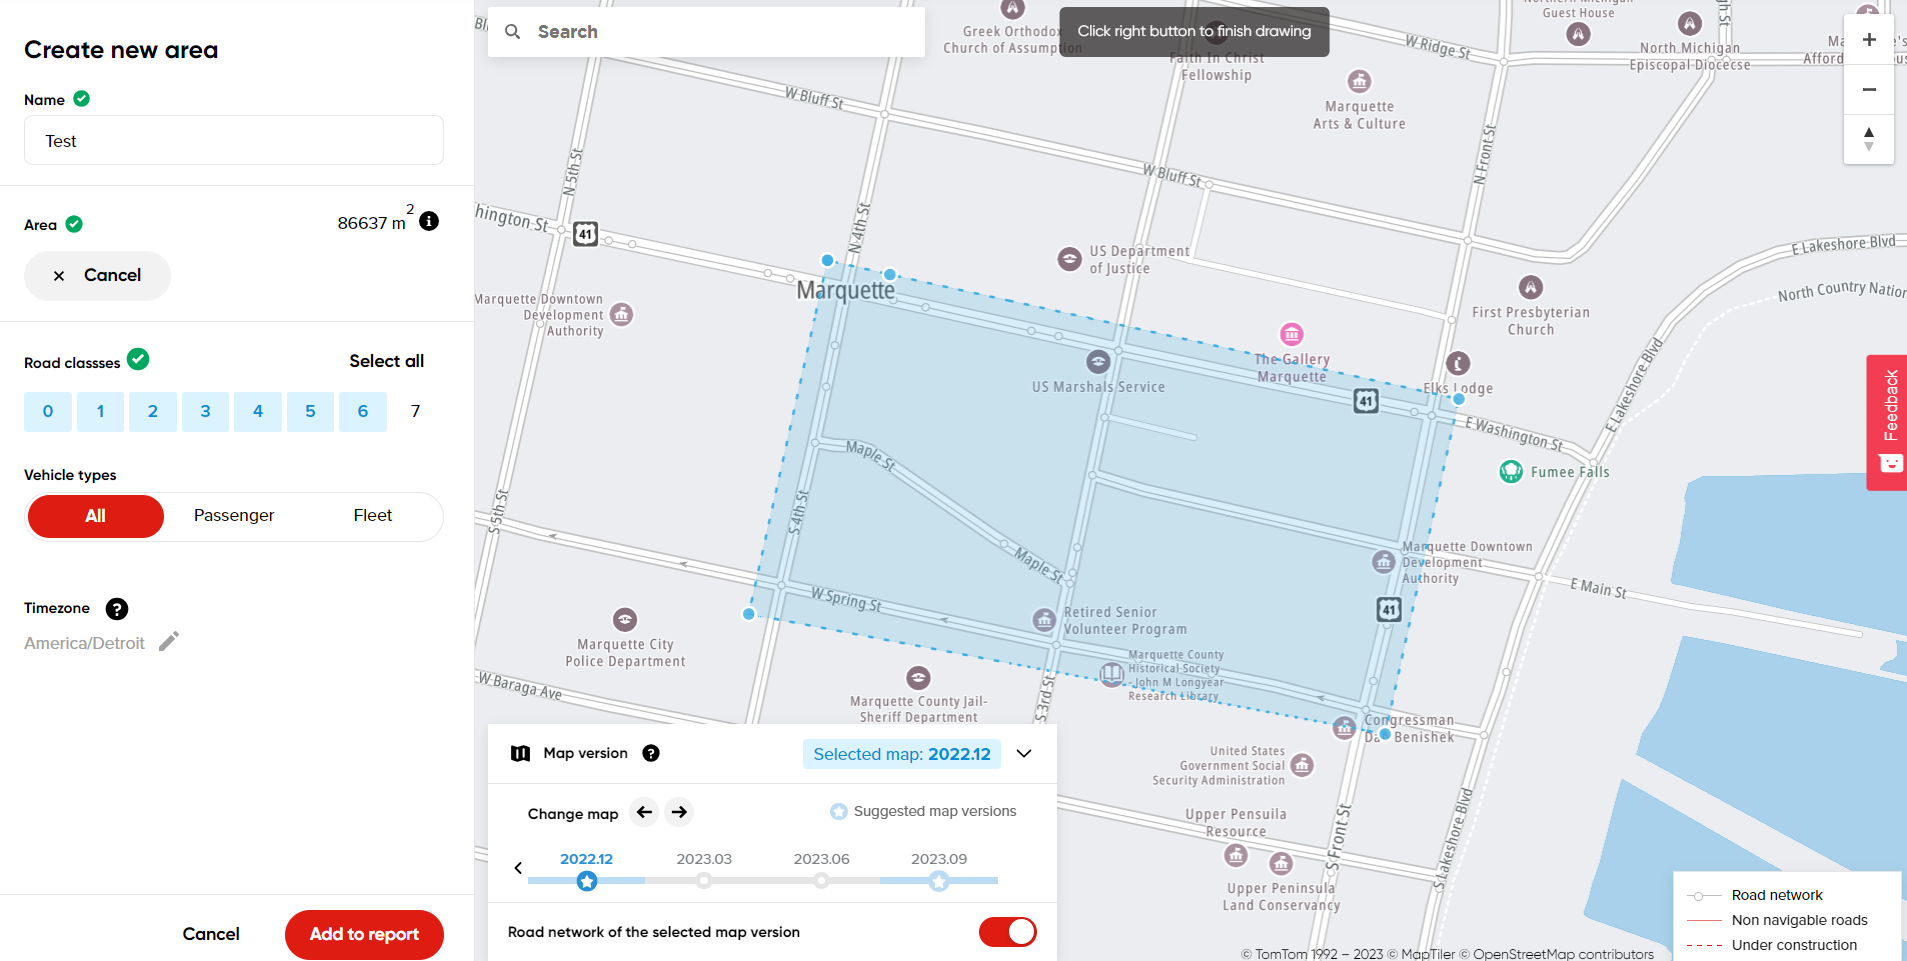
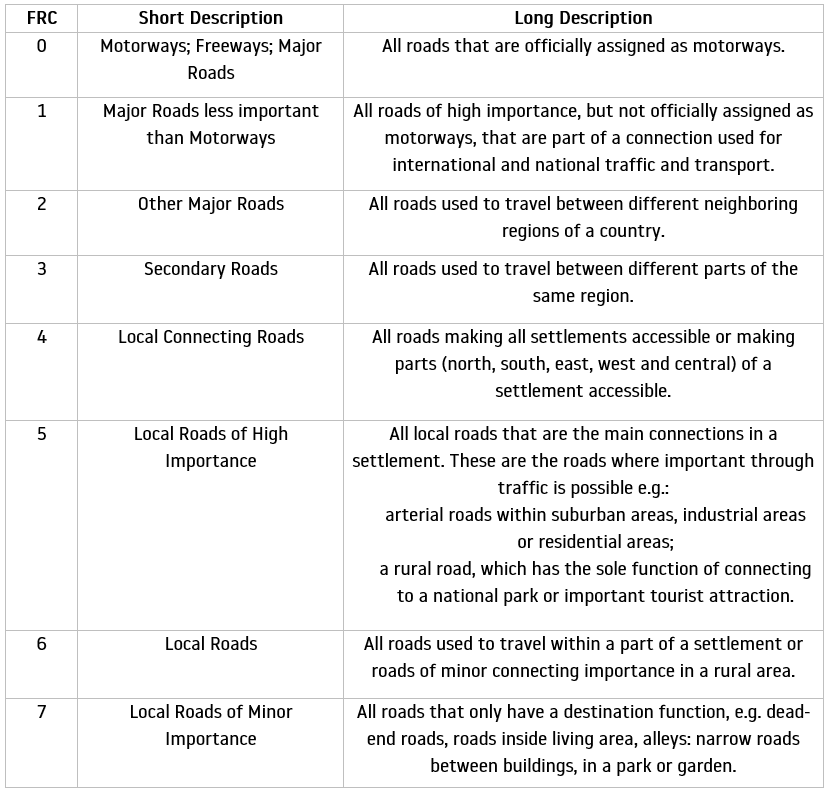
3. Define which FRCs (Functional Road Classes) to include in the query.
FRC is a hierarchical designation of the entire road network, ranging from Highways (FRC 0) to local city roads (FRC 7).
You will notice when selecting and deselecting FRC's, a grey line will appear on that road class when selected and disappear when deselected.
Please see the table below with the explanation of each FRC:
4. Select the vehicle type.
- Passenger: GPS location data from non-professional regular drivers.
- Fleet: GPS location data from professional fleet vehicles, including trucks of different sizes and weights, urban delivery vehicles, and leasing passenger cars. No vehicle type distinction is made within the Fleet data category.
5. Select the map version.
You can read more about map versions in this section:
6. Click Add to report.
Area - Traffic Density
The main difference between the Full Area Analysis and Traffic Density Analysis is that instead of the full report information (speed, travel time and other average values), you will receive only the vehicle number observed for every segment.