Adding regions
Area definition
There are two main methods for defining regions for your analysis:
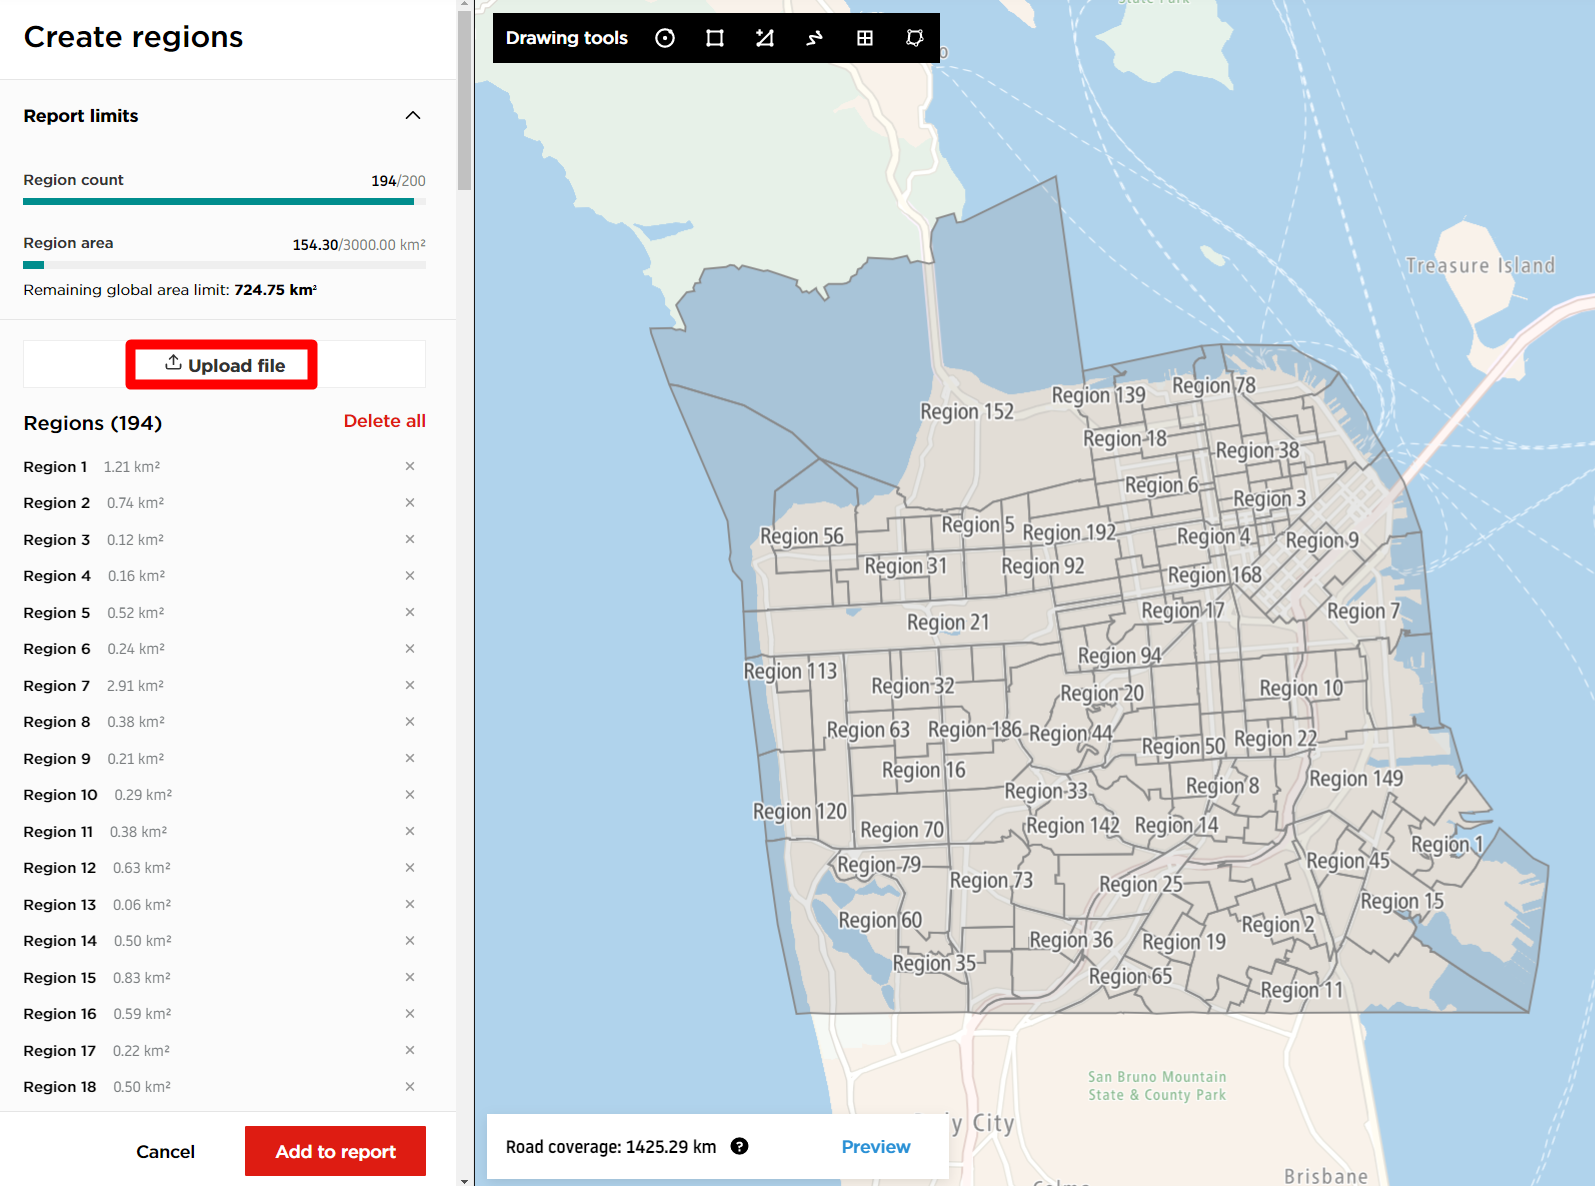
Method 1: Click the Upload file option. This feature allows you to import regions using one of the supported file formats:
- .GeoJSON
- .TopoJSON
- .SHP (all files should be provided in a single zip archive)
- .KML
- .KMZ
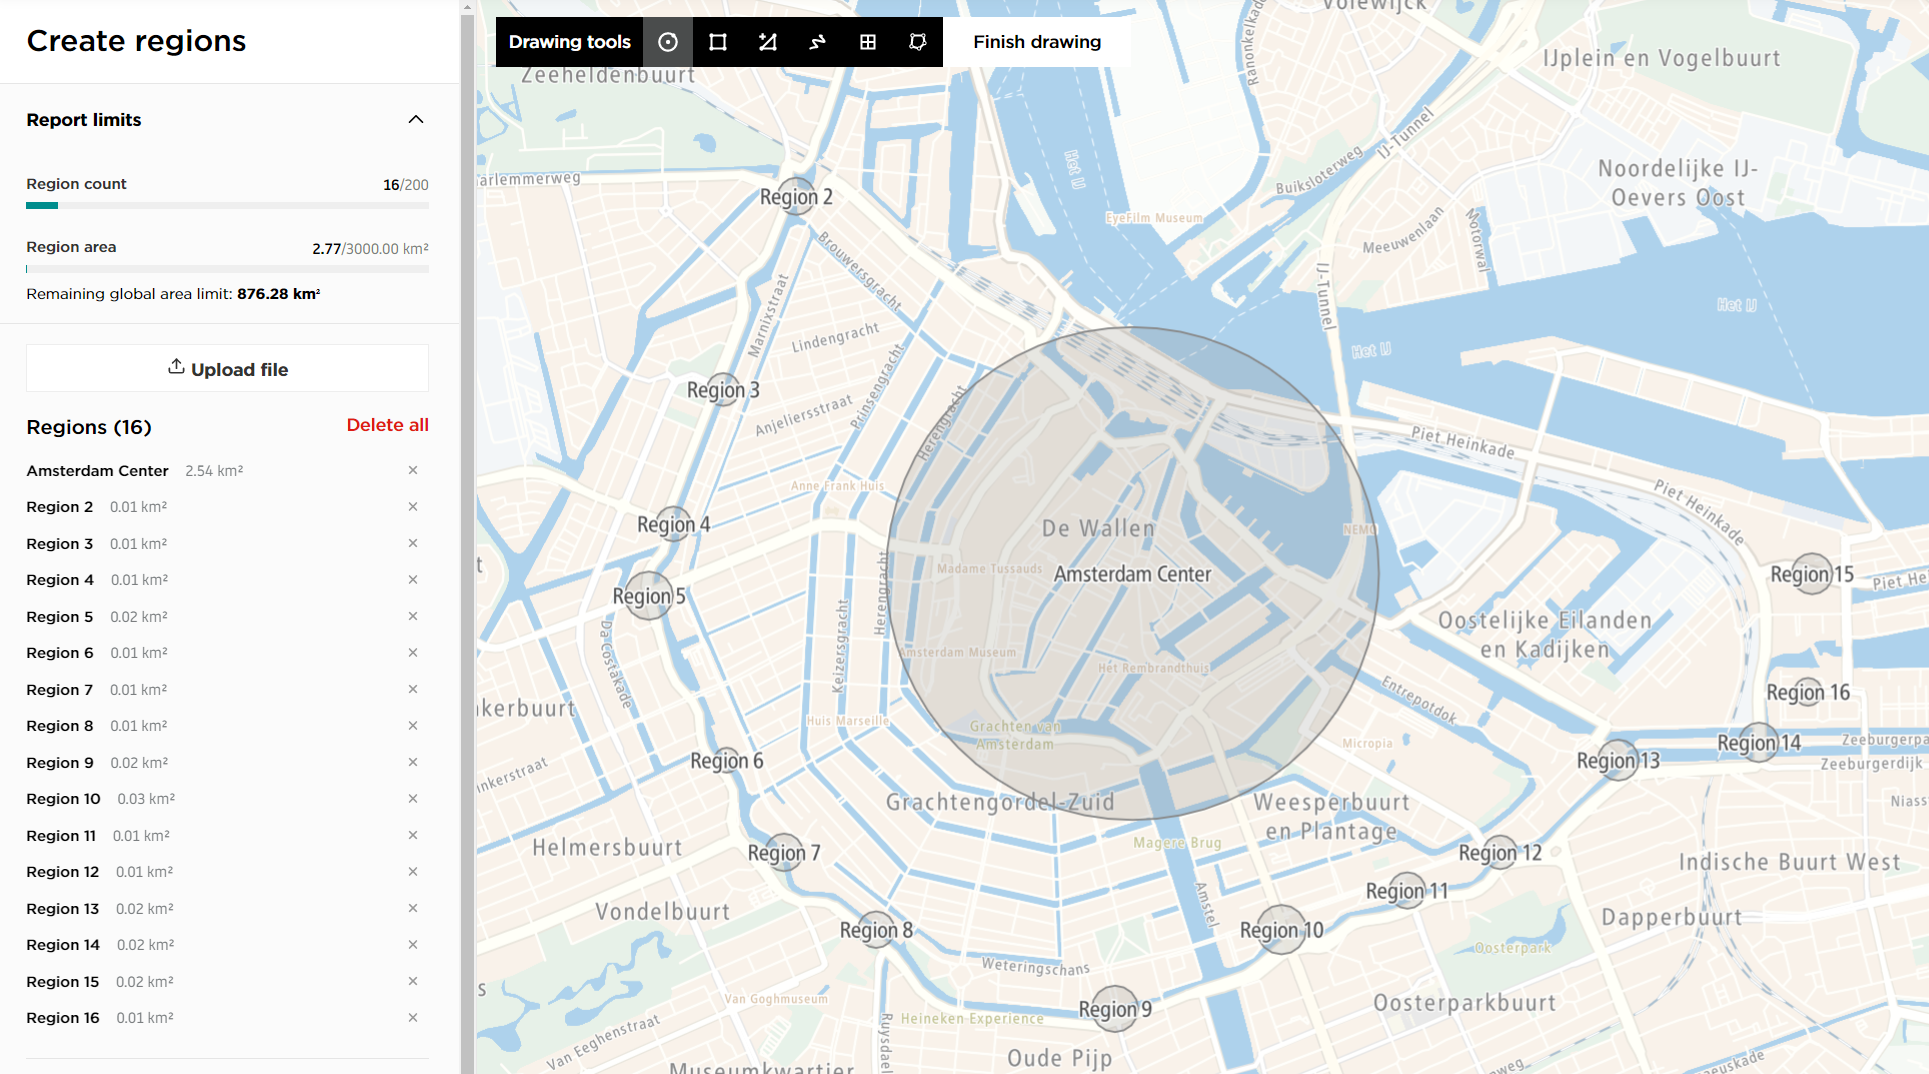
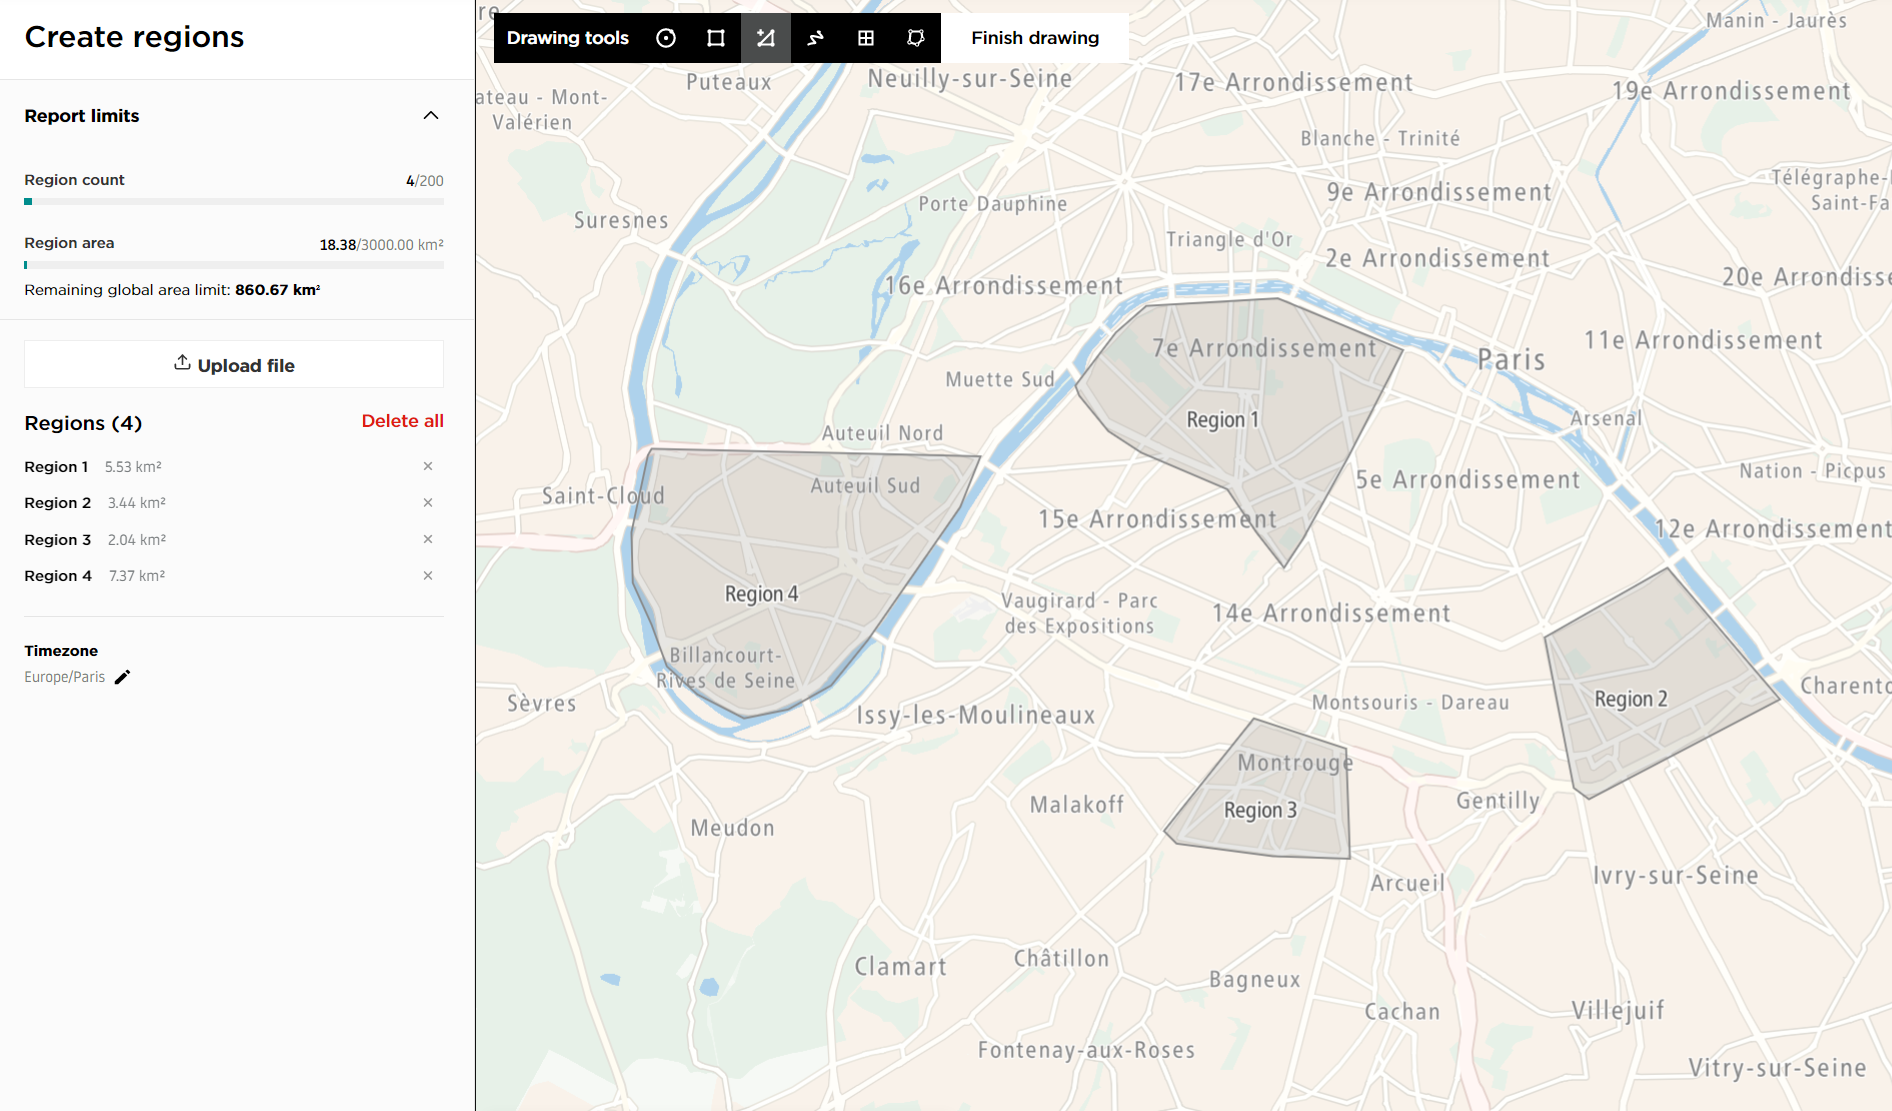
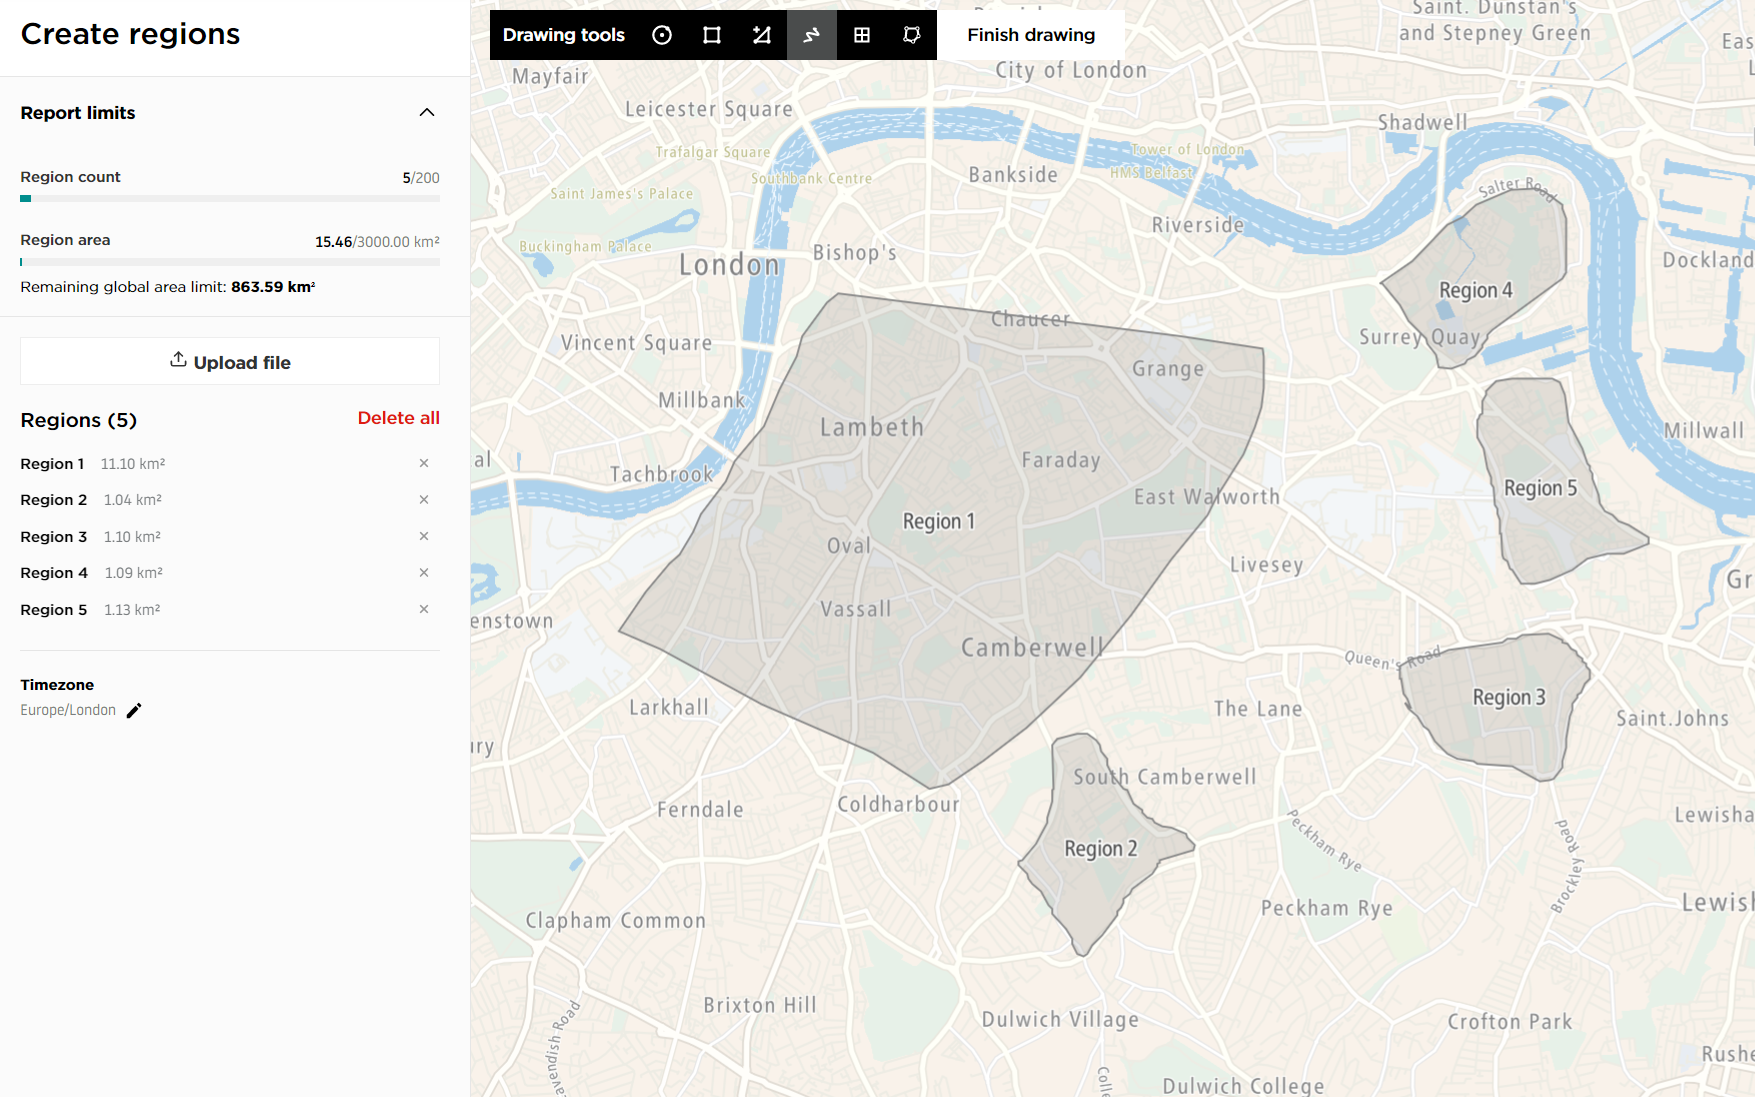
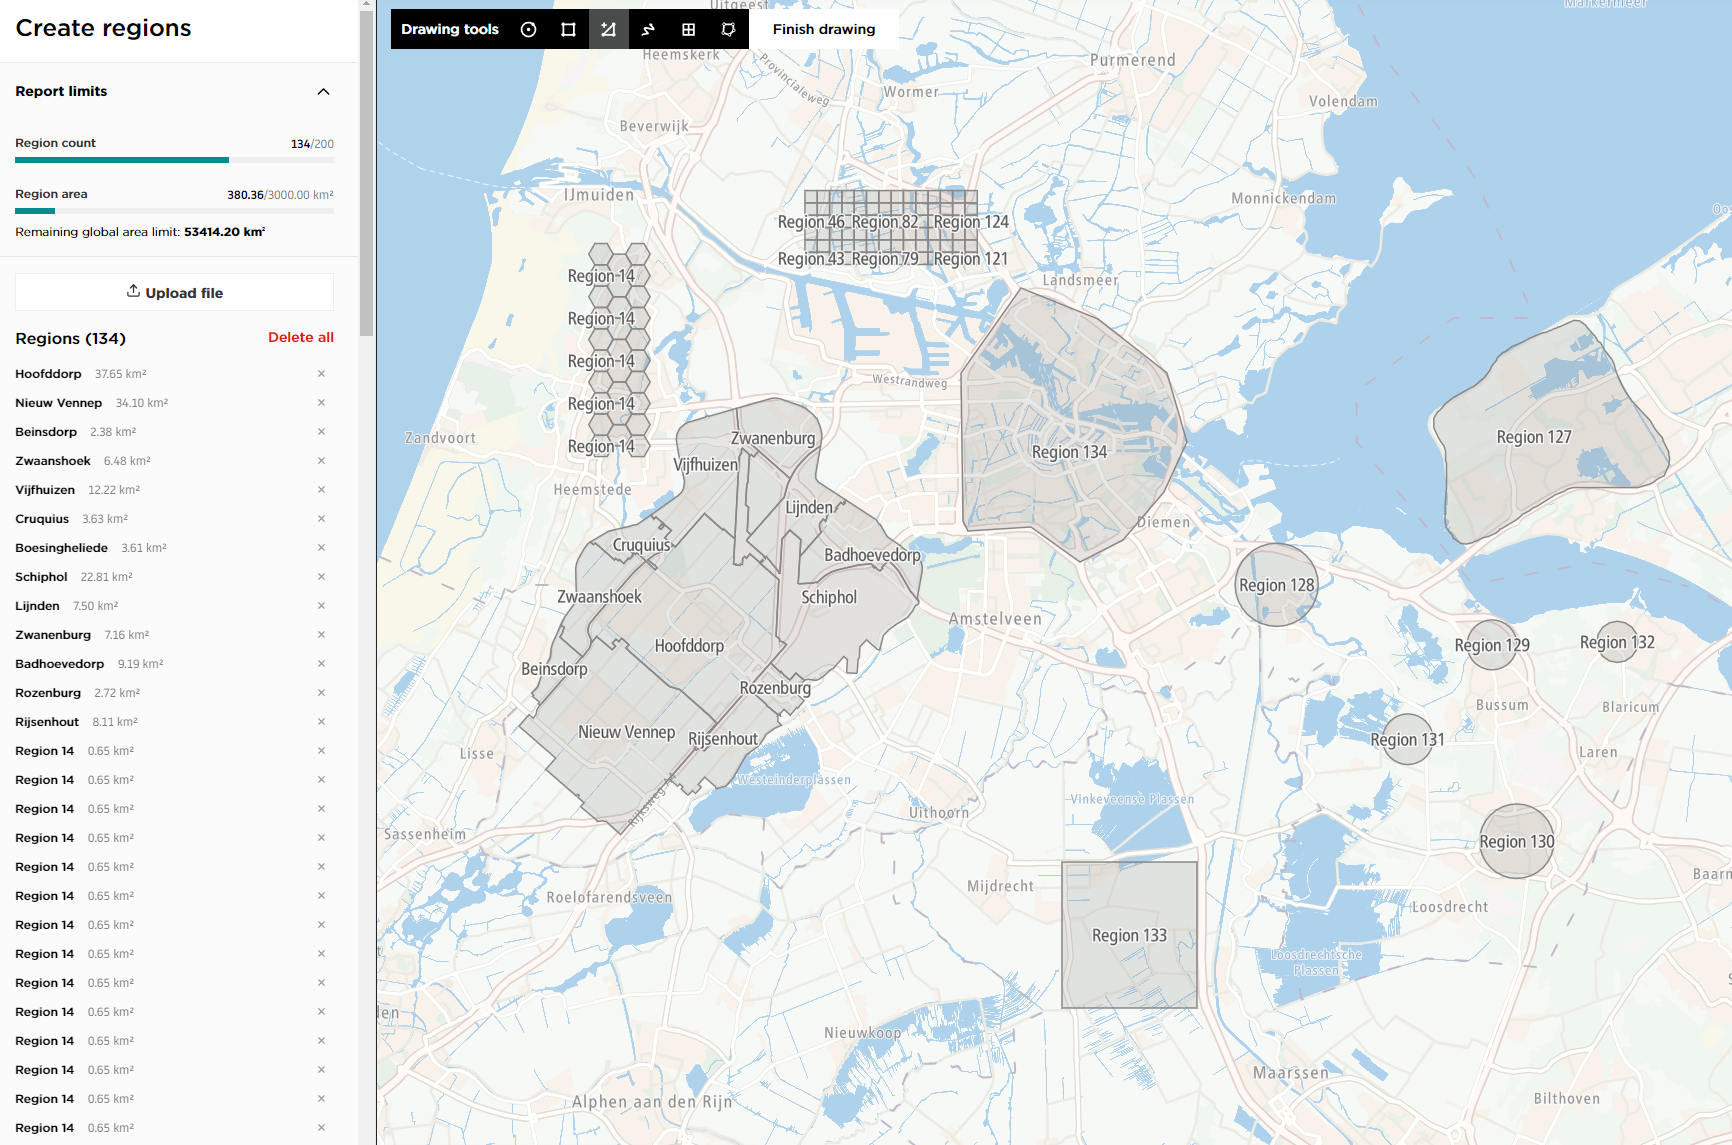
Method 2: The second method is using the Draw regions option, which uses the following tools:
- Circle: This tool allows you to draw circular areas by selecting the center and then increasing the radius.
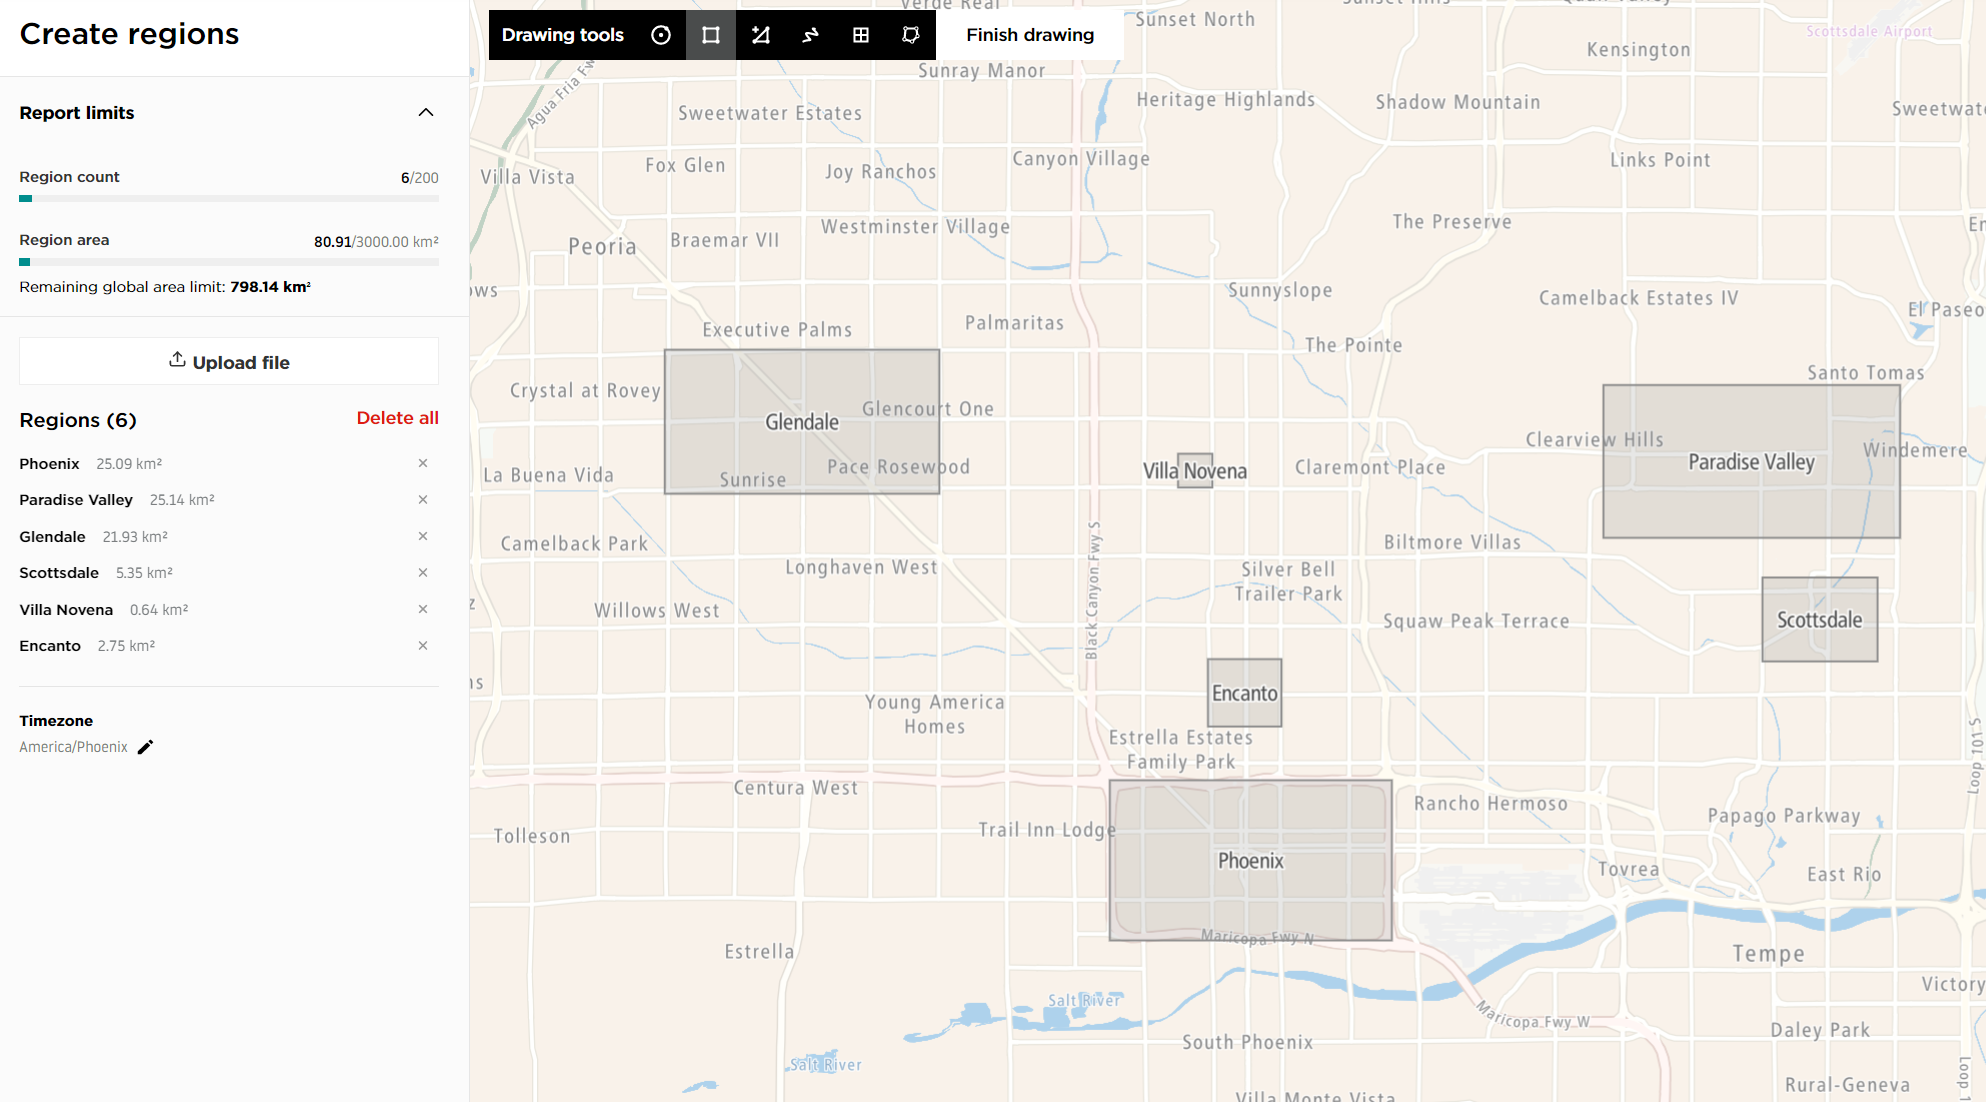
- Rectangle: This tool allows you to draw rectangular areas.
- Polygon: This tool allows you to draw polygonal areas.
- Shape painter: This tool allows you to draw custom shapes that will be converted into areas.
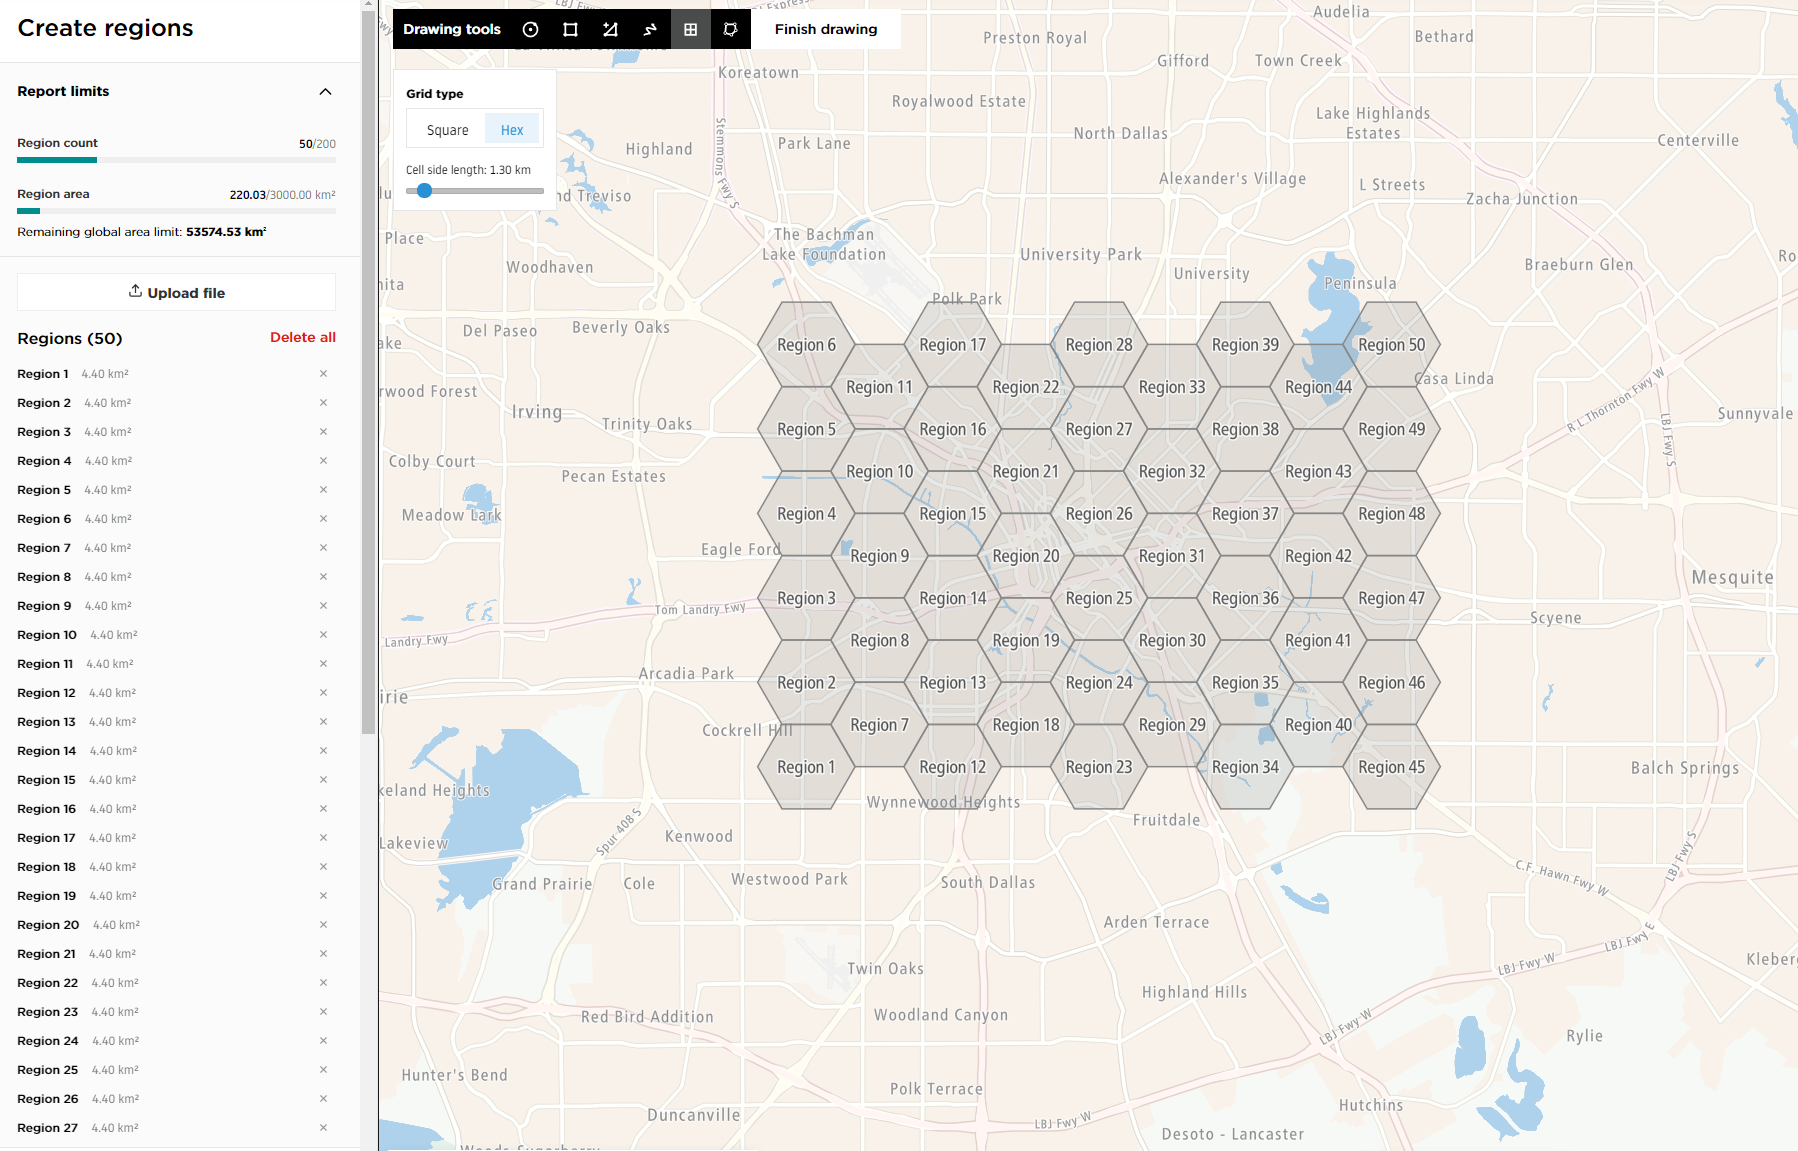
- Grid: This tool allows you to create a grid of connected square or hexagonal areas with a customizable cell side length from 0.50 km to 10 km.
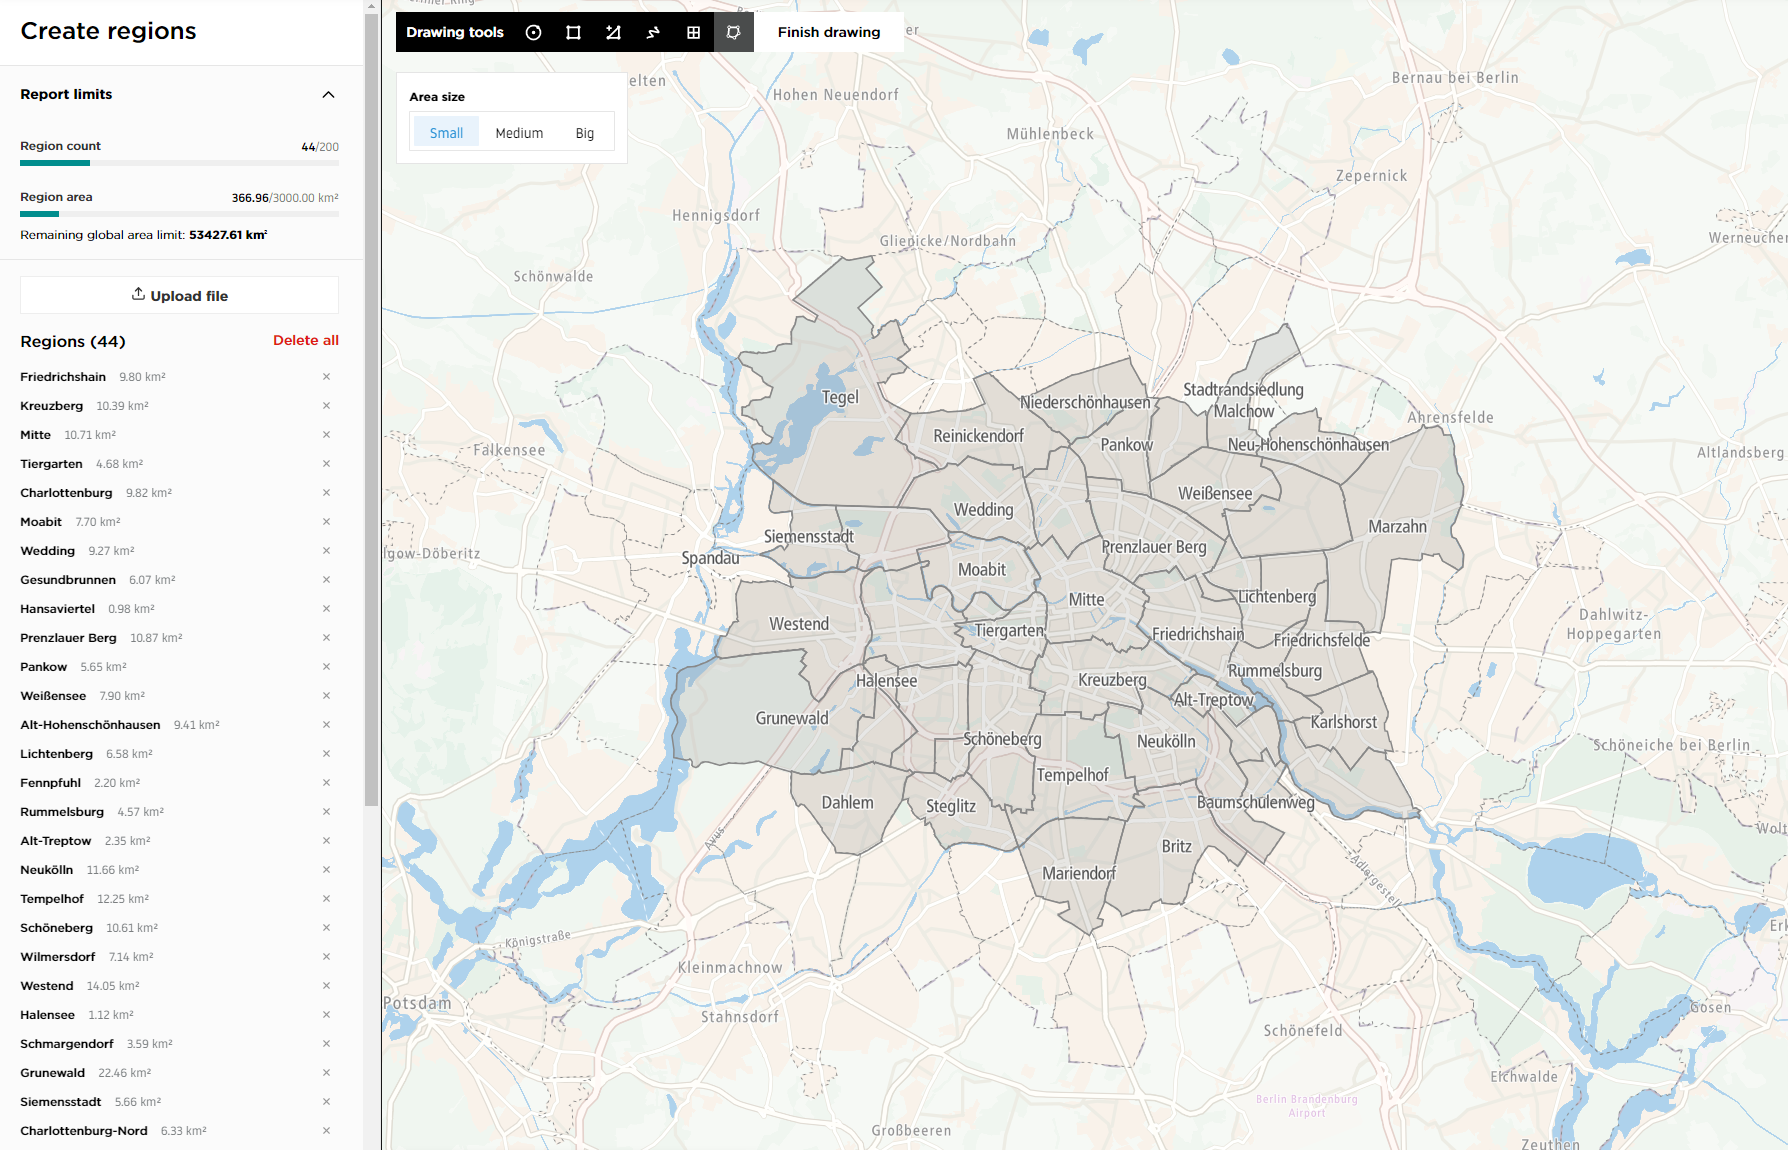
- Administrative area: This tool allows you to select the administrative areas (e.g., neighborhoods, districts or cities) available in the TomTom map.
In addition to the individual methods described previously, you can combine these region types. For example, you can import pre-defined shapefiles or GeoJSON files and draw custom shapes at the same time.
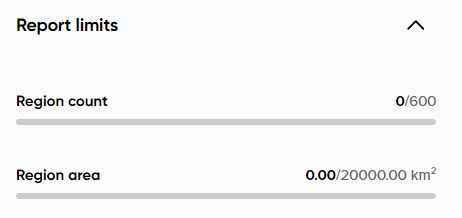
The total region area (per analysis) is a maximum of 20,000 km², while the maximum number of regions (per analysis) is 600.