Trip statistics
This option allows you to analyze additional information besides the main data provided in the O/D Analysis output. You can view these results in the Flows Explorer section.
In addition to the default O/D Analysis results of trip values between regions, the Trip statistics feature provides histograms of:
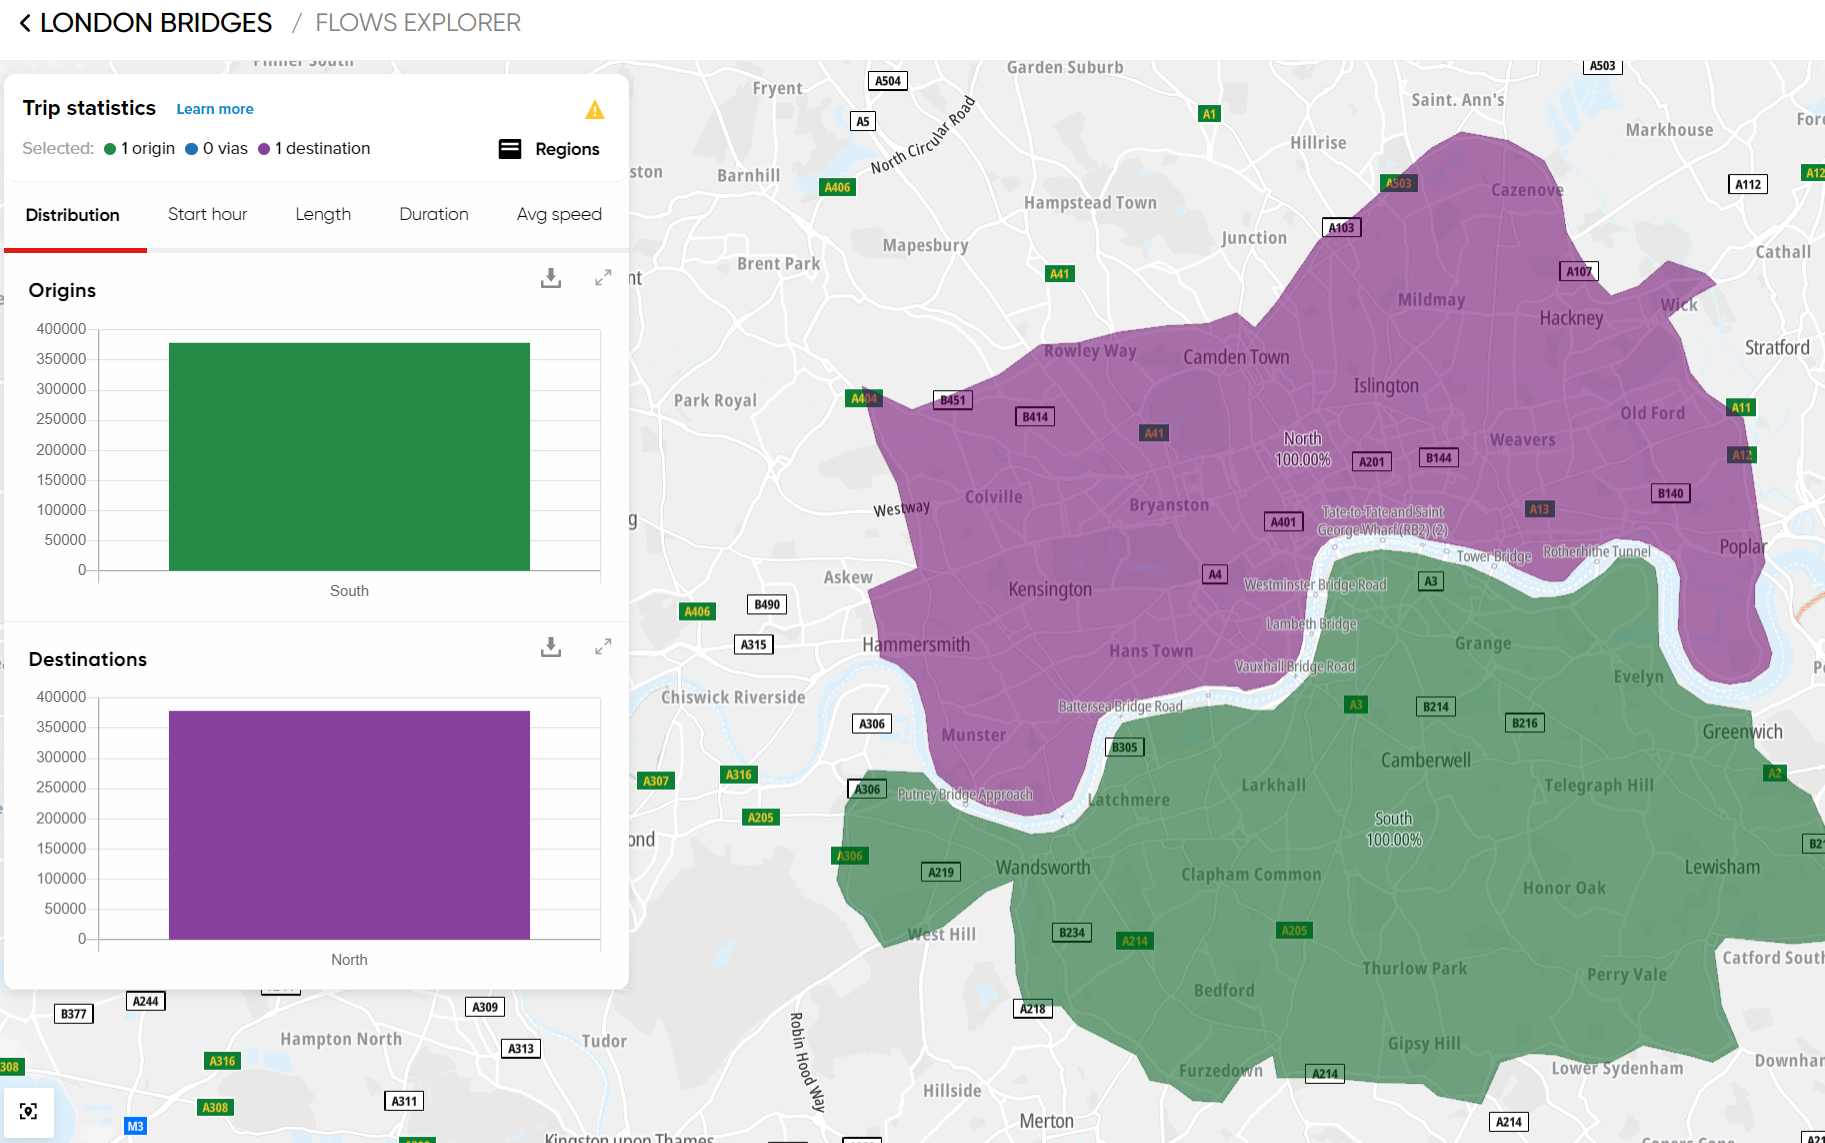
- Distribution - shows the number of vehicles that traveled in a specific direction defined by you based on the regions in your analysis.
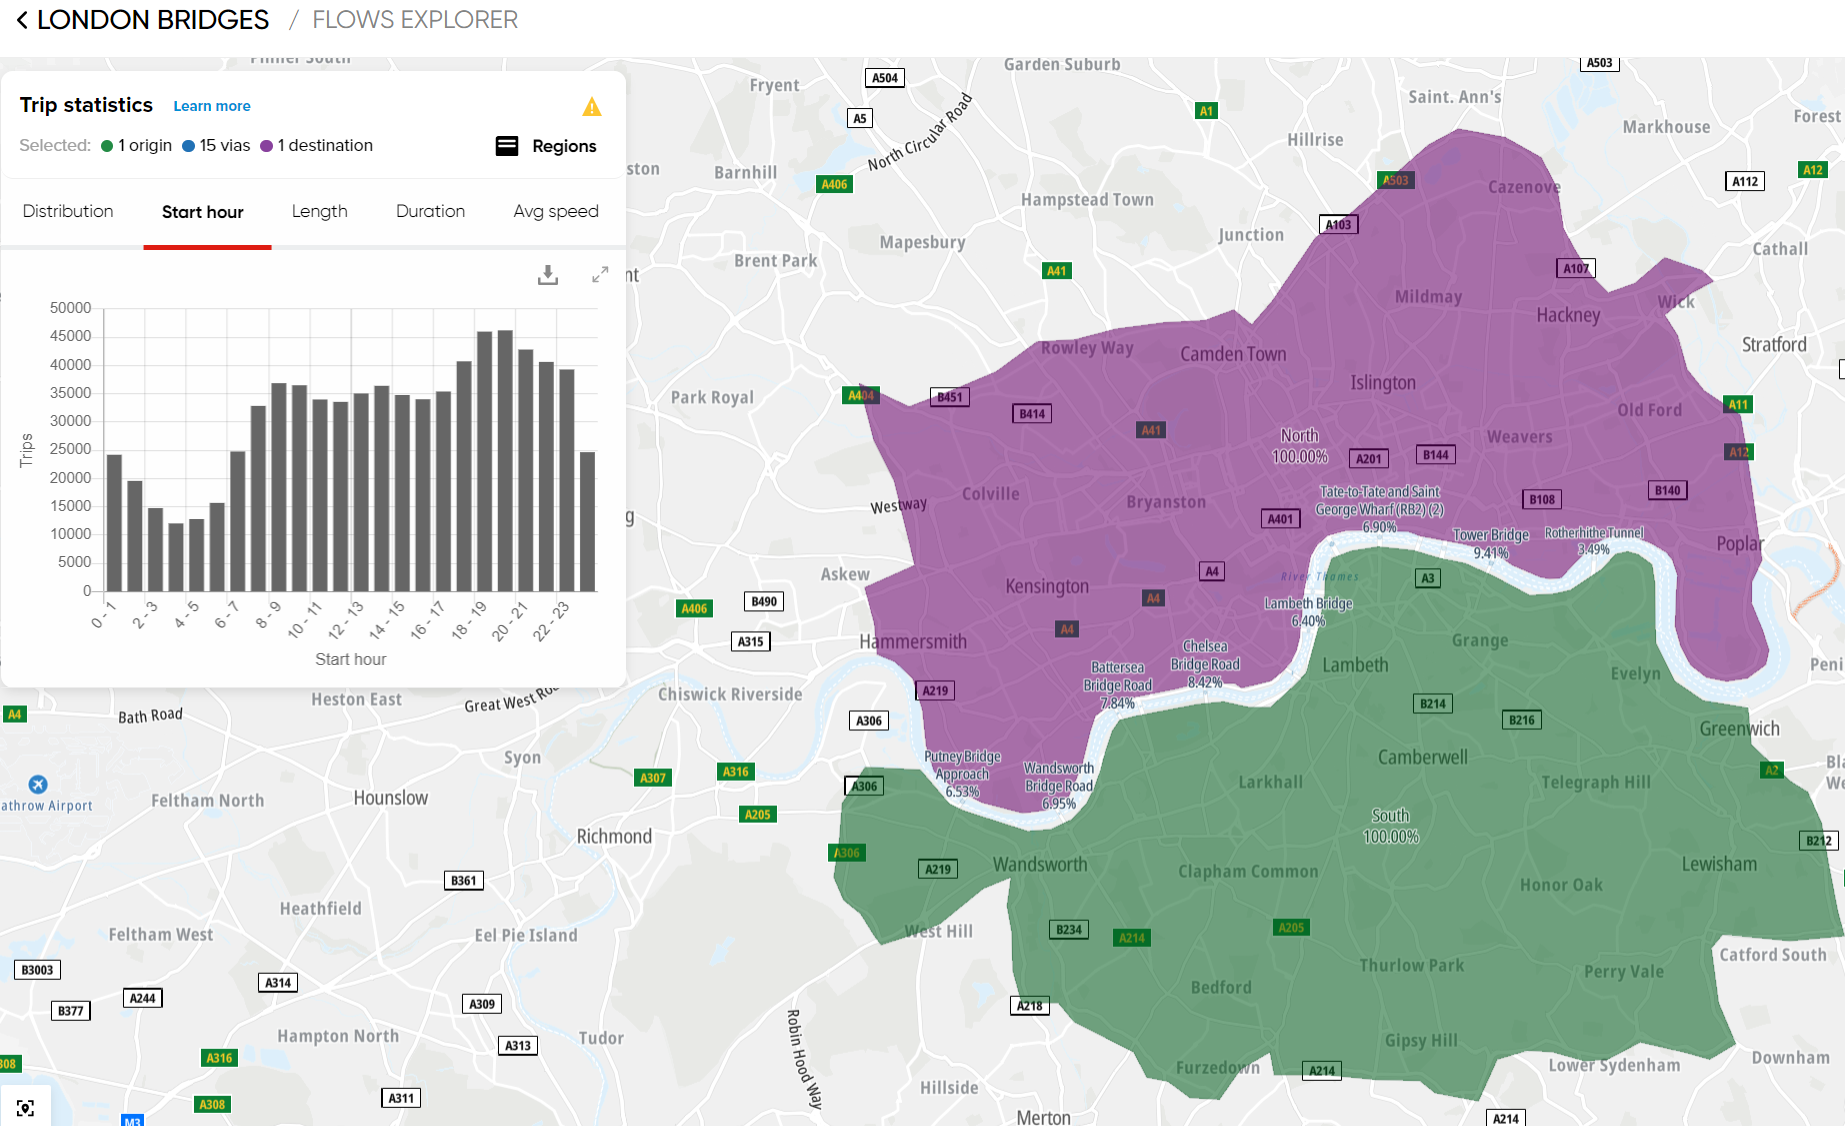
- Start hour - shows the number of vehicles that started the trip at a specific hour.
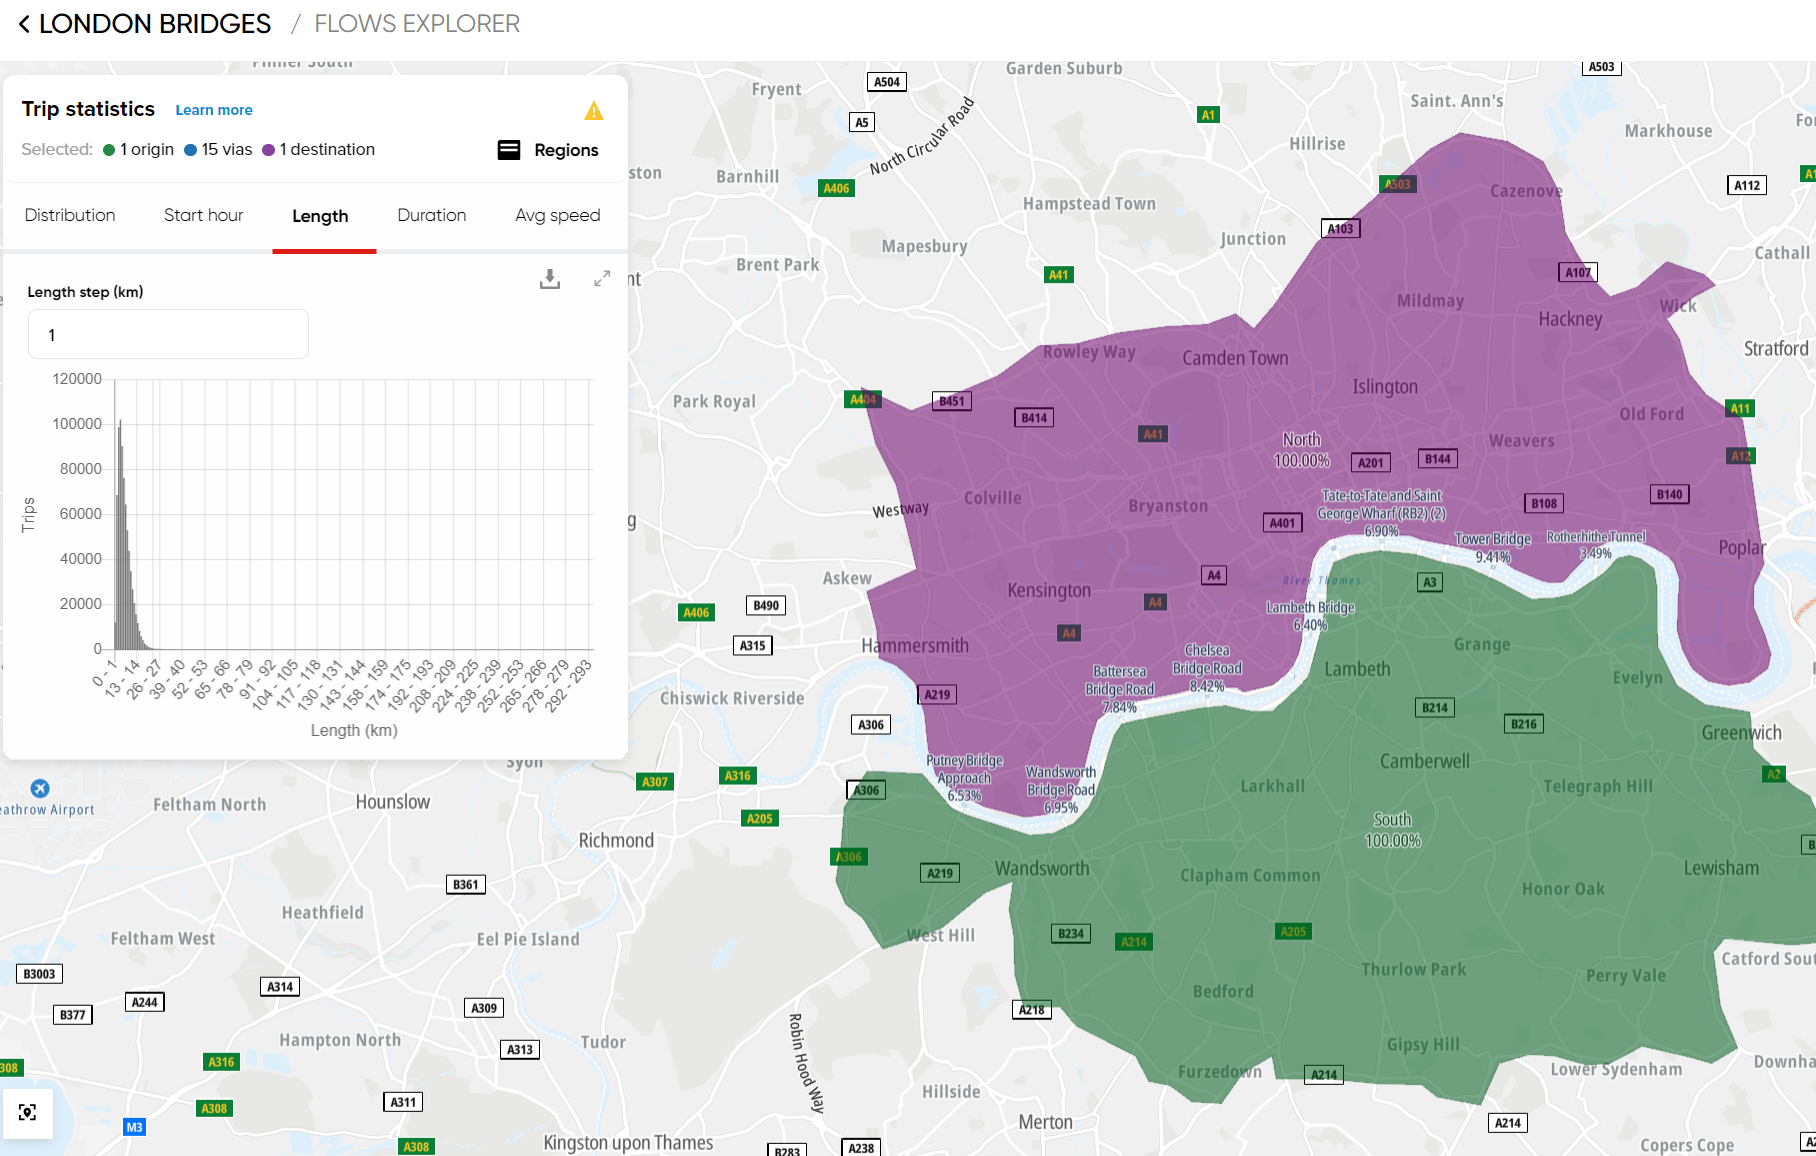
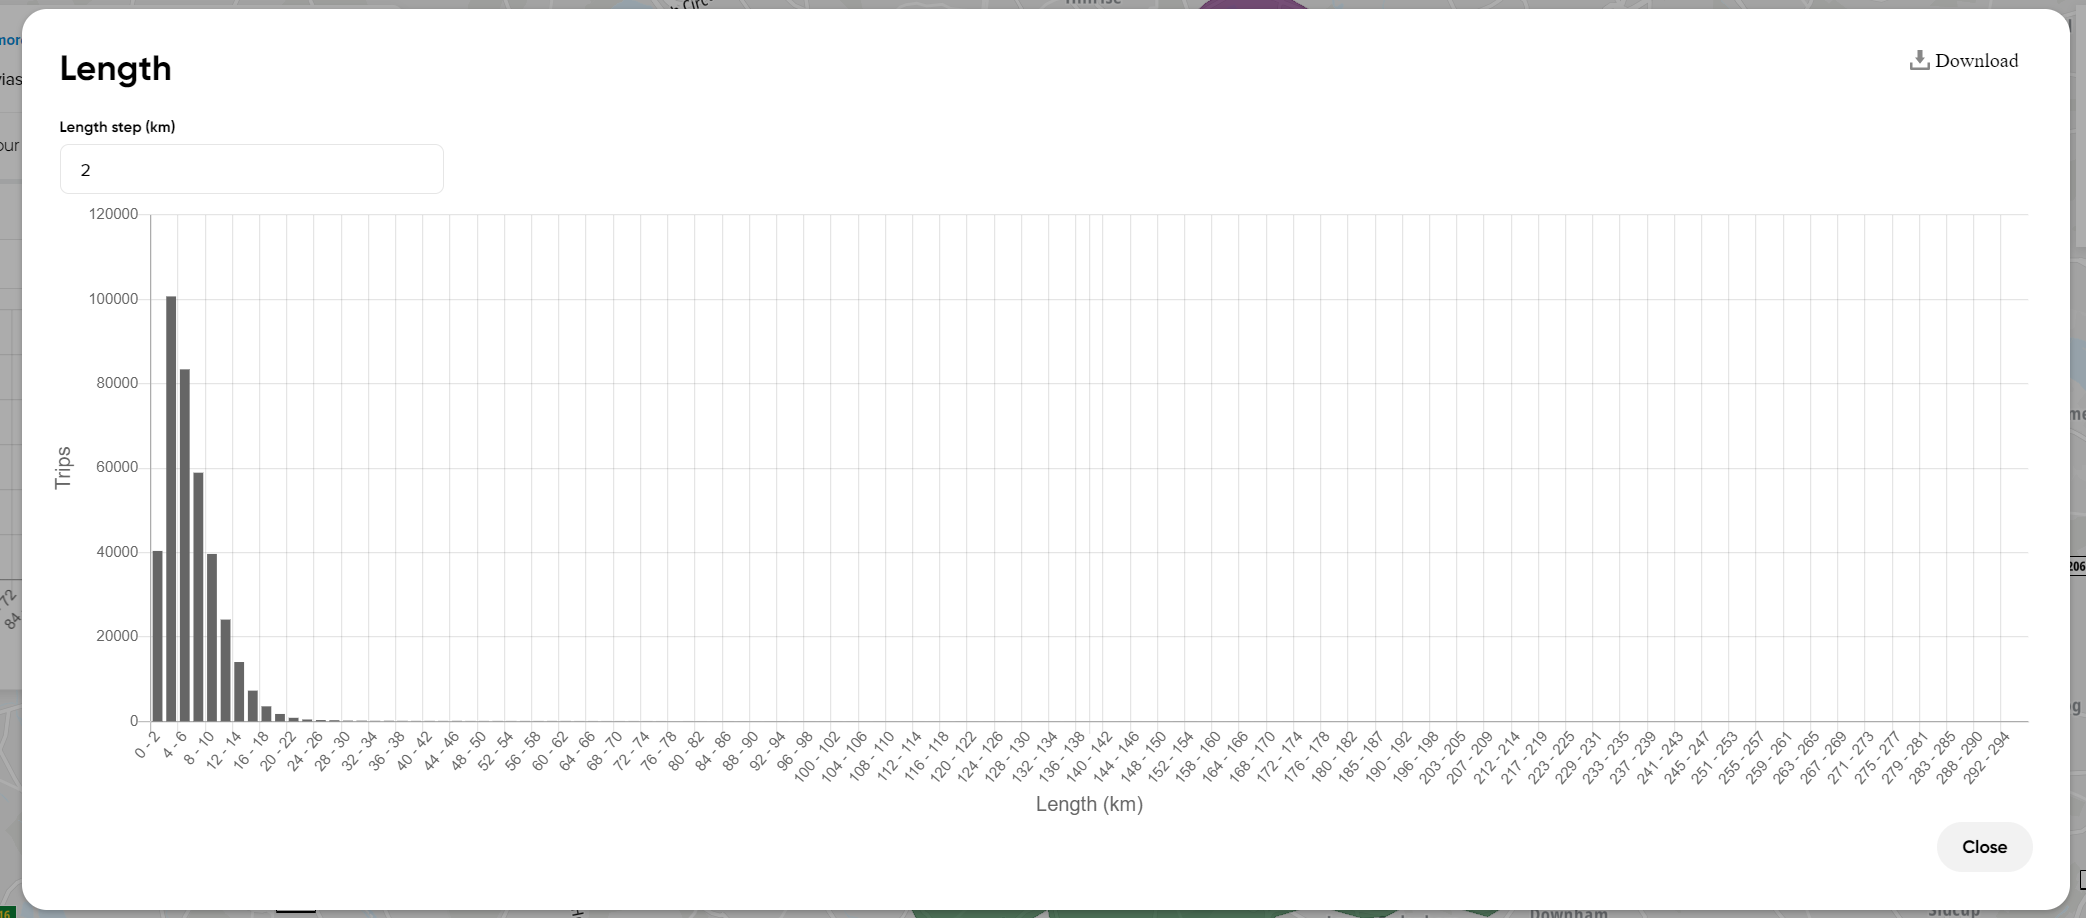
- Length - shows the number of vehicles that traveled a specific distance in kilometers based on the regions you defined in your analysis.
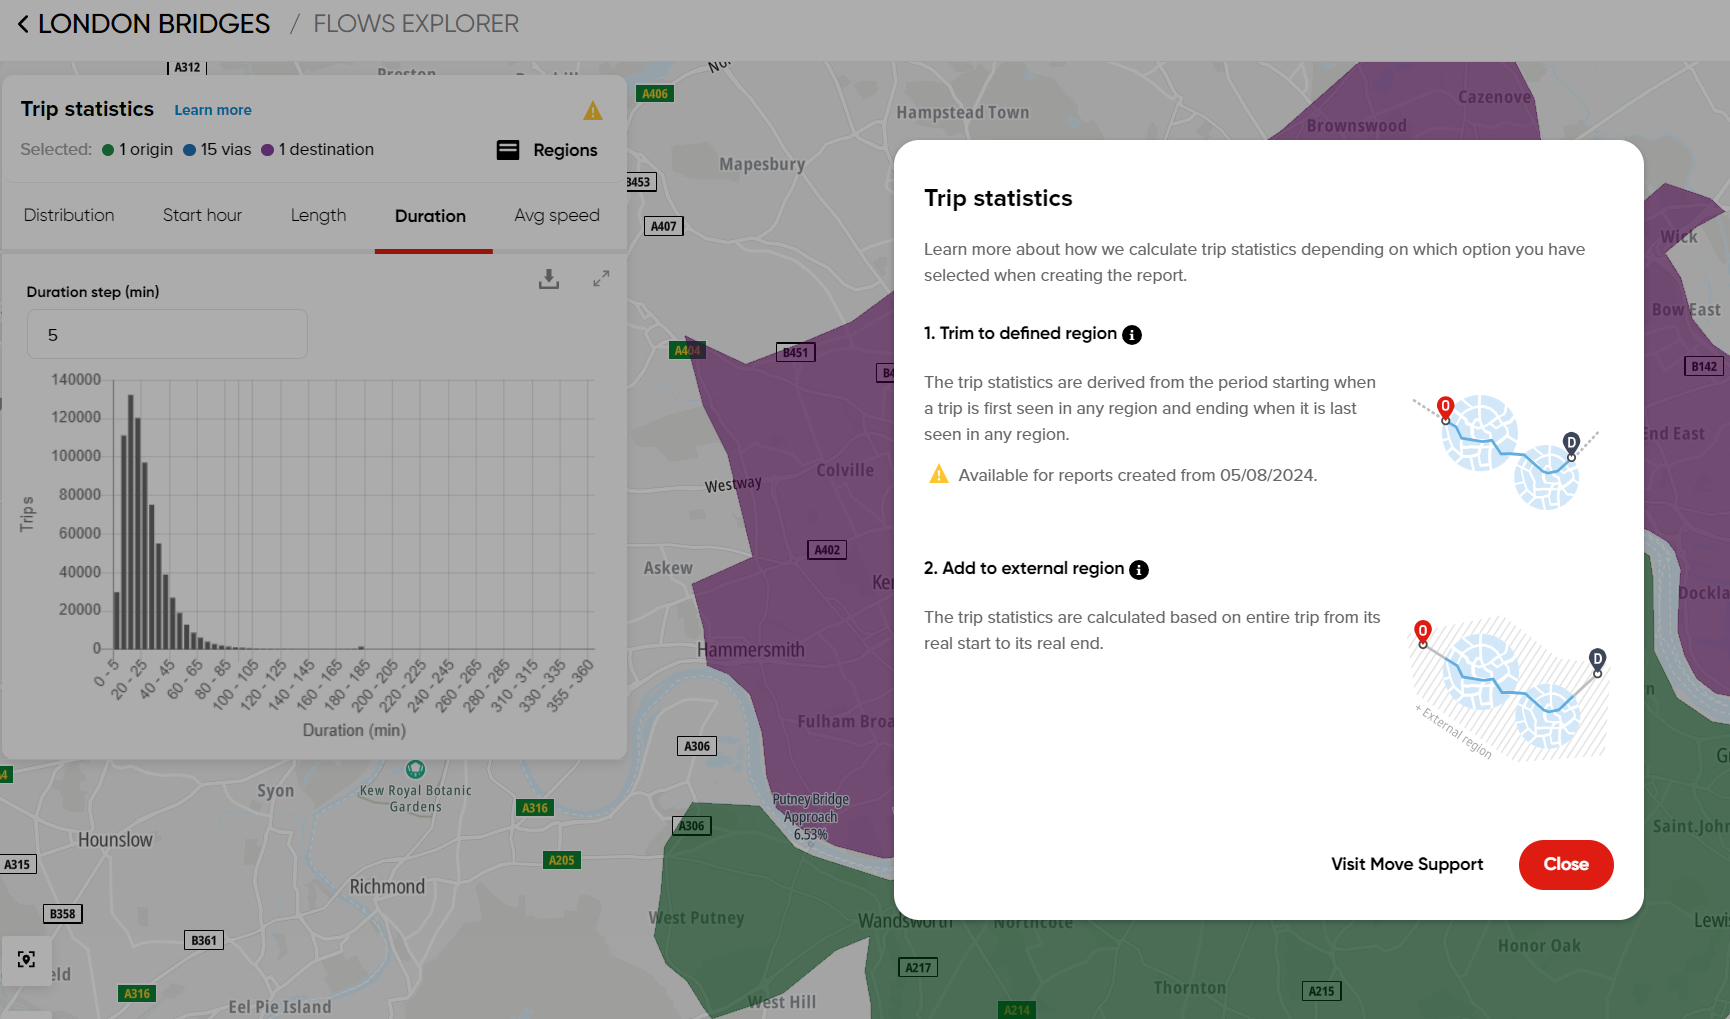
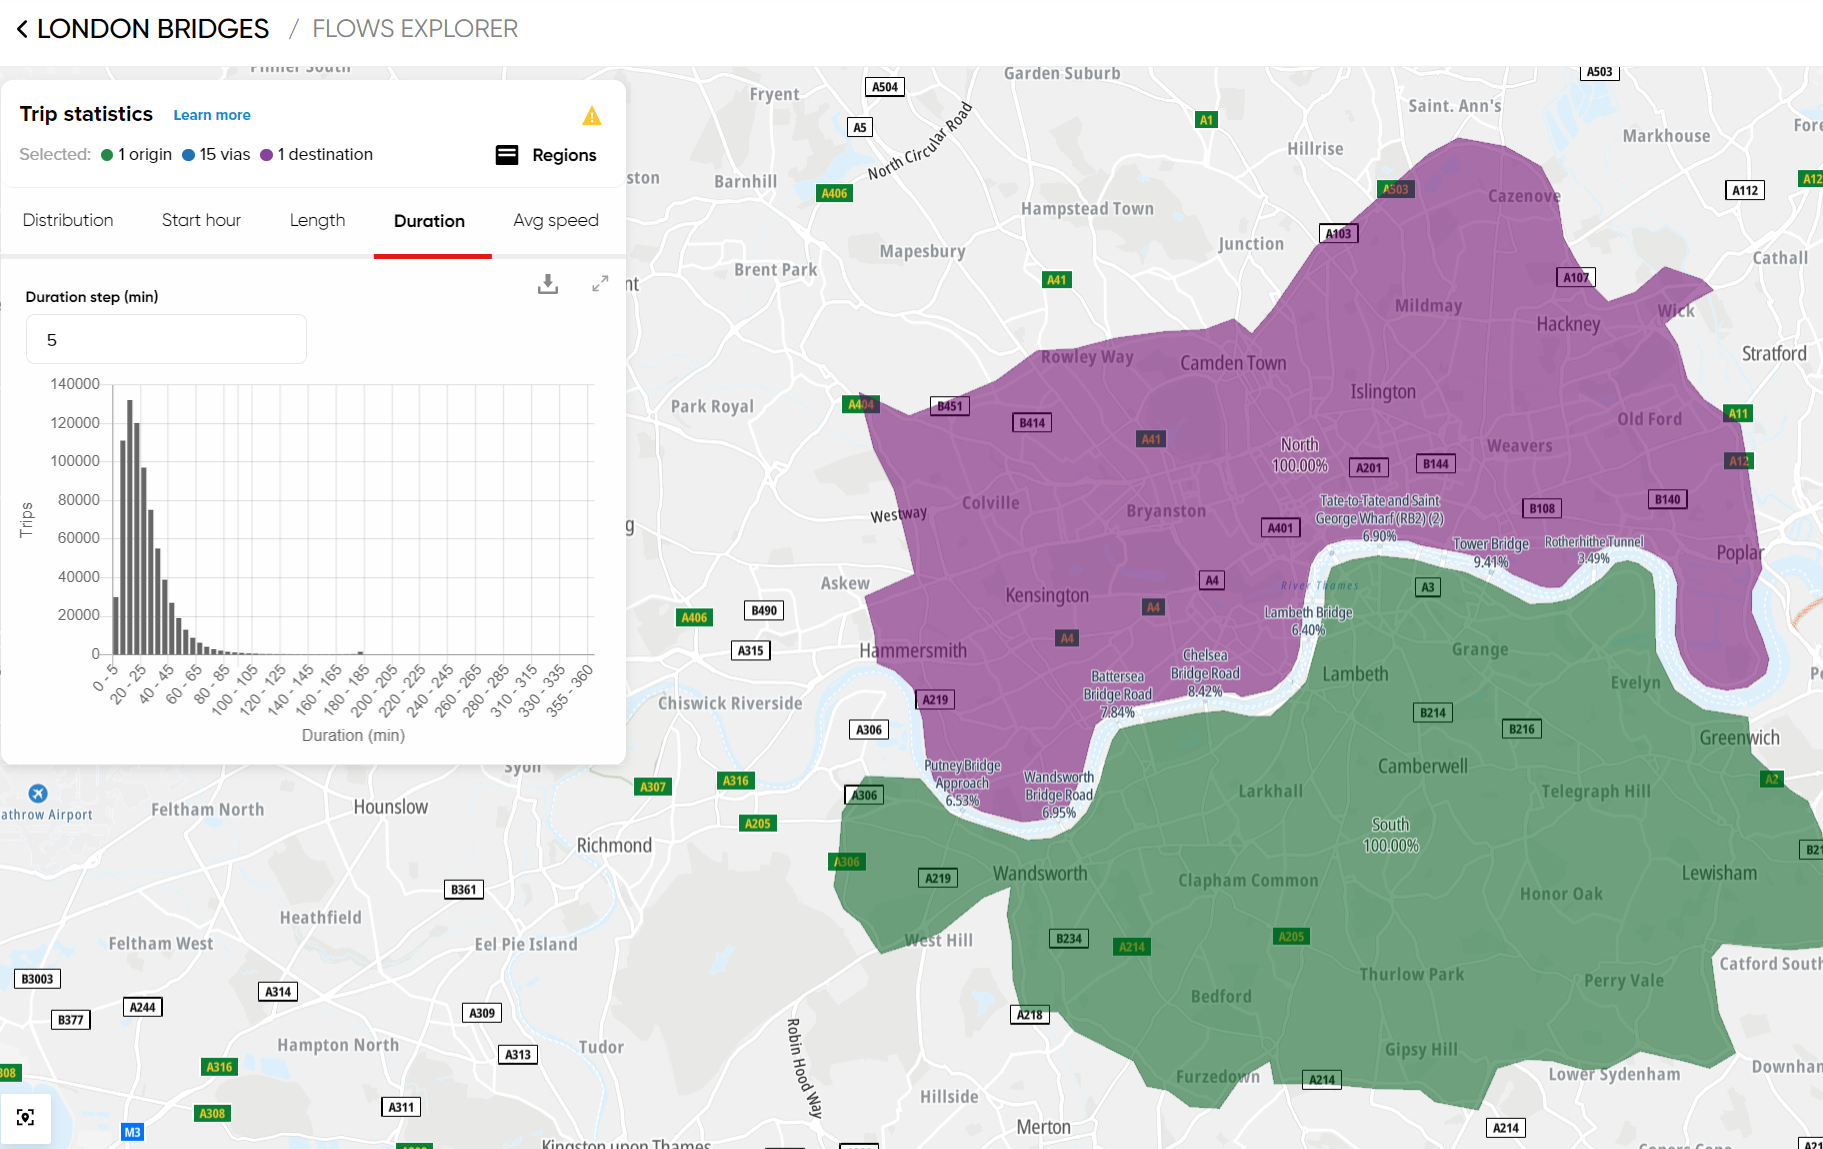
- Duration - shows the number of vehicle trips that lasted for a specific time (in minutes) based on how you defined the regions in your analysis.
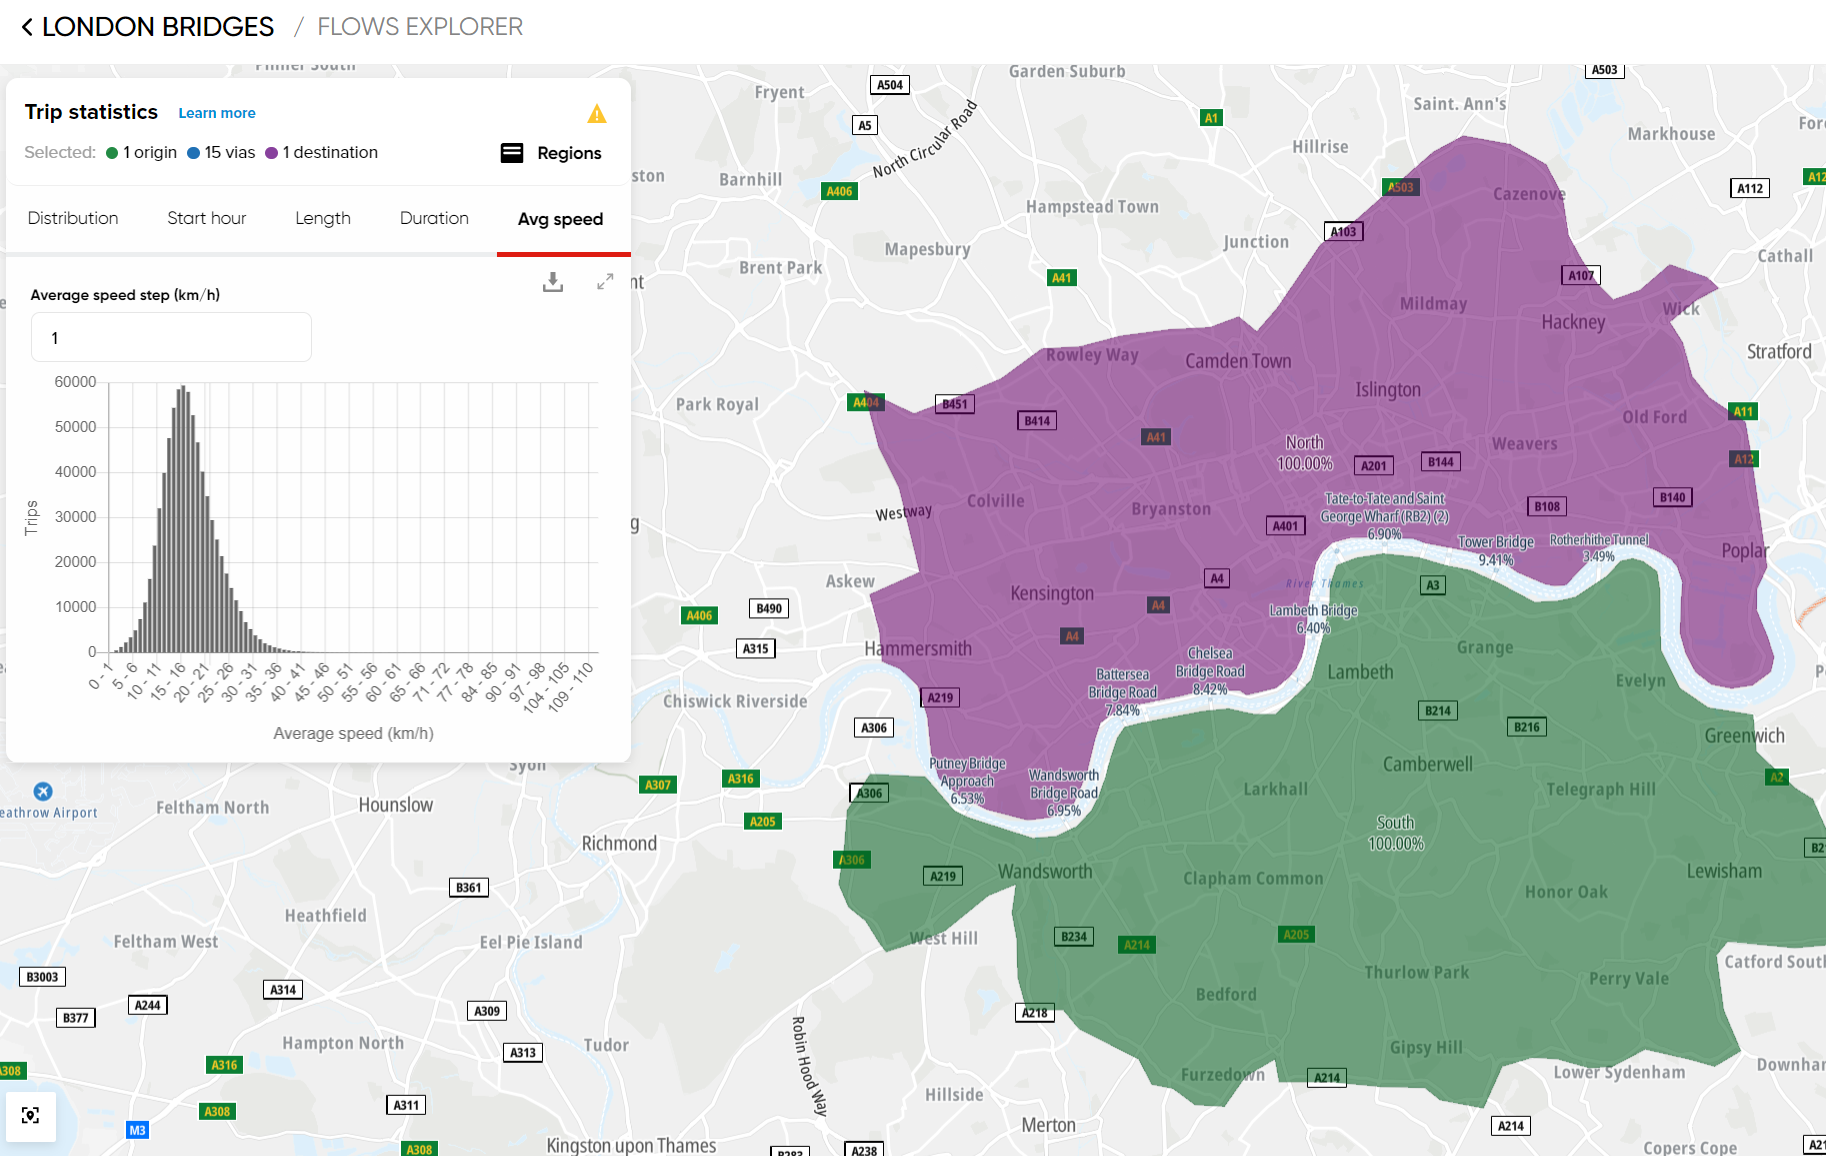
- Average speed - displays the number of vehicle trips that traveled at a specific average speed value.
Important Note! Please note that the calculation of these values depends on the selected analysis parameter: 'Add to external region' or 'Trim to defined region'.
-
For Add to external region, the values are based on the whole trips.
-
For Trim to defined region, the values are derived from the period starting when a trip is first seen in any region and ending when it is last seen in any region.
Additional Trip Statistics histogram customization
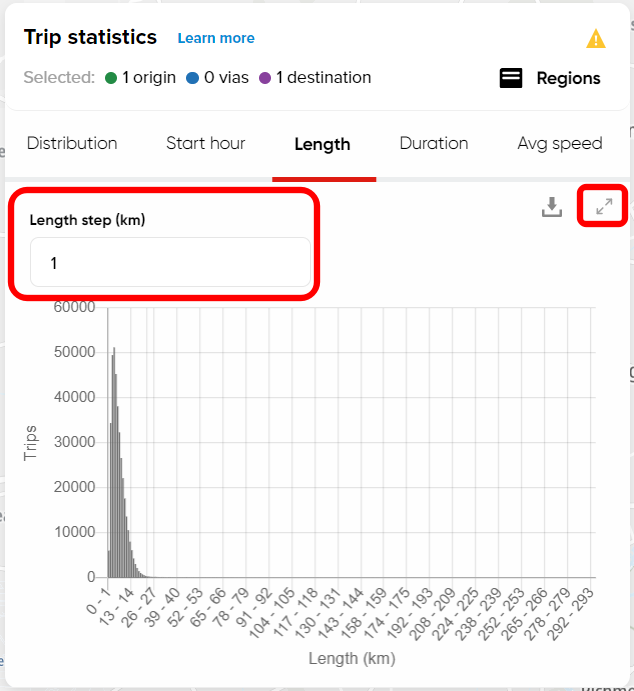
Each histogram you see in the Flows Explorer can be expanded to make it easier to review the results. To do that, you simply need to click the expand arrows in the upper-right corner.
Additionally, it's also possible to adjust the histogram bin size by defining a different step value.
Downloading Trip Statistics results
It is possible to extract the trip statistics histograms in a .CSV file format. That will generate a list of all the relations between regions in form of raw data.
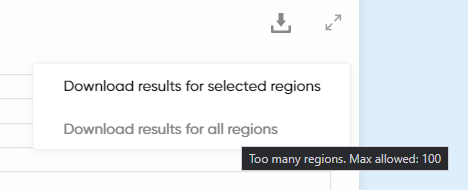
To do that, you simply click the download button and choose one of the two options.
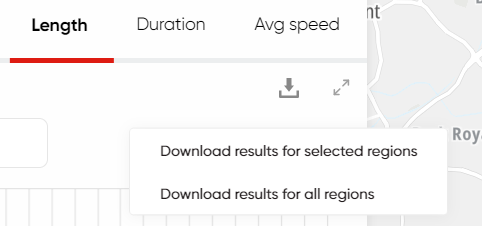
The first option will generate a list based on your current region settings in the Flows Explorer, just the way you see the histogram at the current moment in the O/D Analysis tool.
The second option will provide you with a list of all the relations between all your regions in your analysis (with certain limitations in the case of a large number of regions).
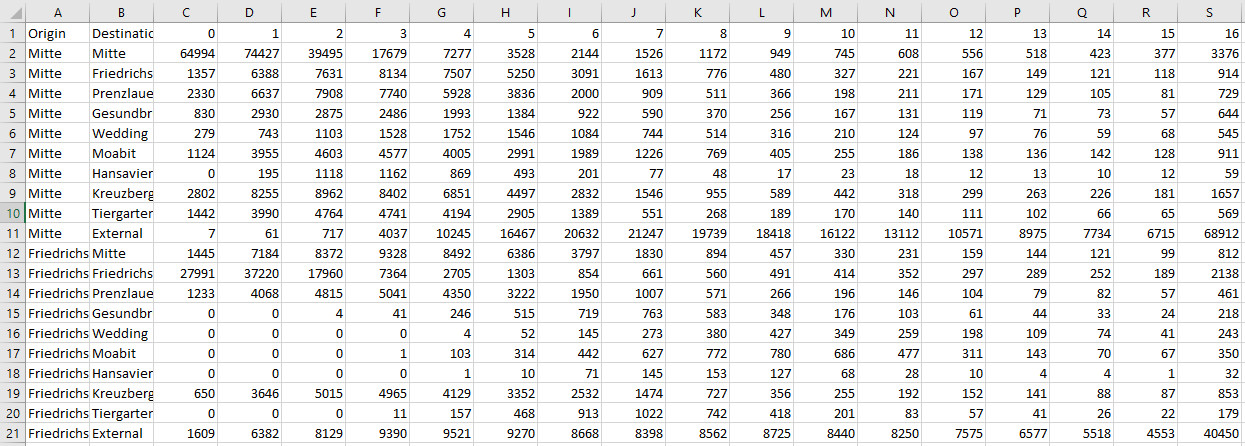
Please keep in mind that the second option providing all regions information is limited and won't be available if there are more than 100 regions in the analysis: