Analysis introduction

The entire analysis creation process consists of five steps:

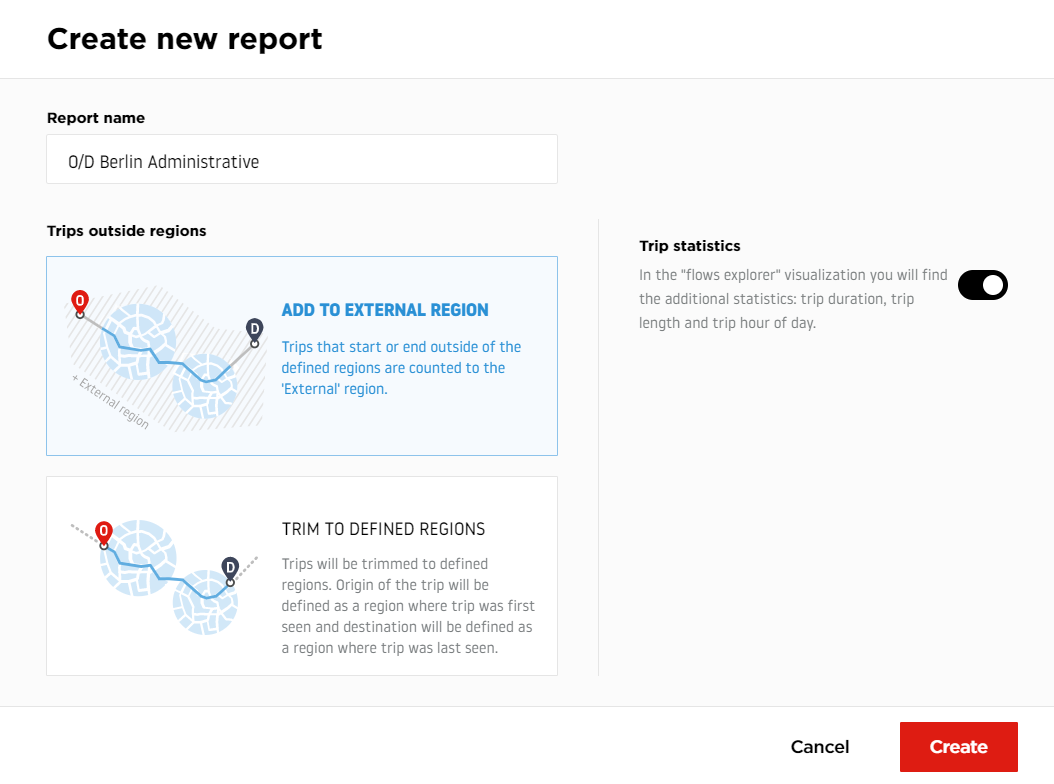
Step 1: Choosing the name of the analysis and additional parameters.

New analysis form showing text input field for analysis name and radio button options for trip parameters
Setting up a new analysis name and additional parameters

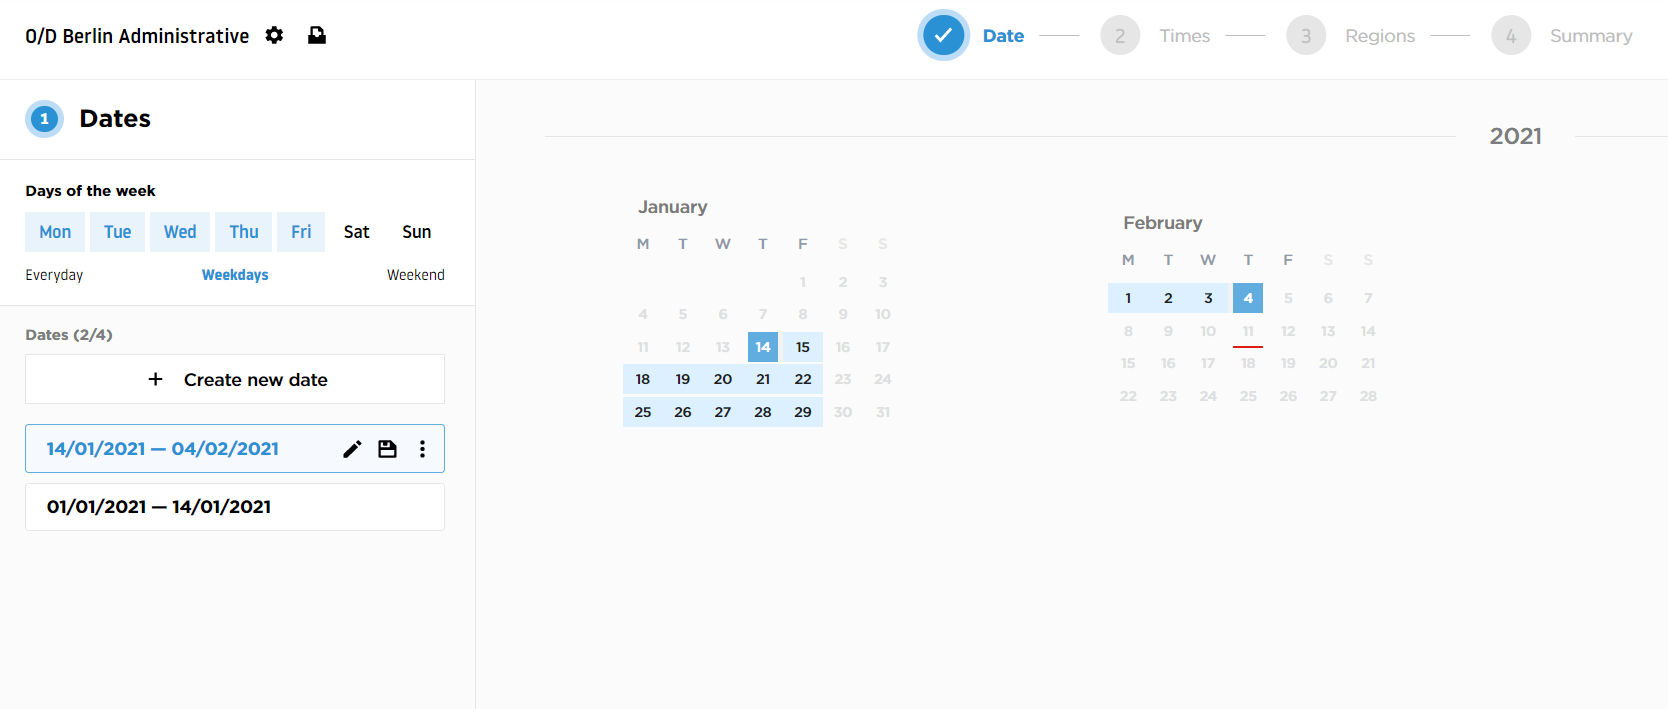
Step 2: Defining the date ranges.

Date range selection interface with calendar widget showing month view and start/end date picker fields as well as day of week selection
Date range section of the new analysis

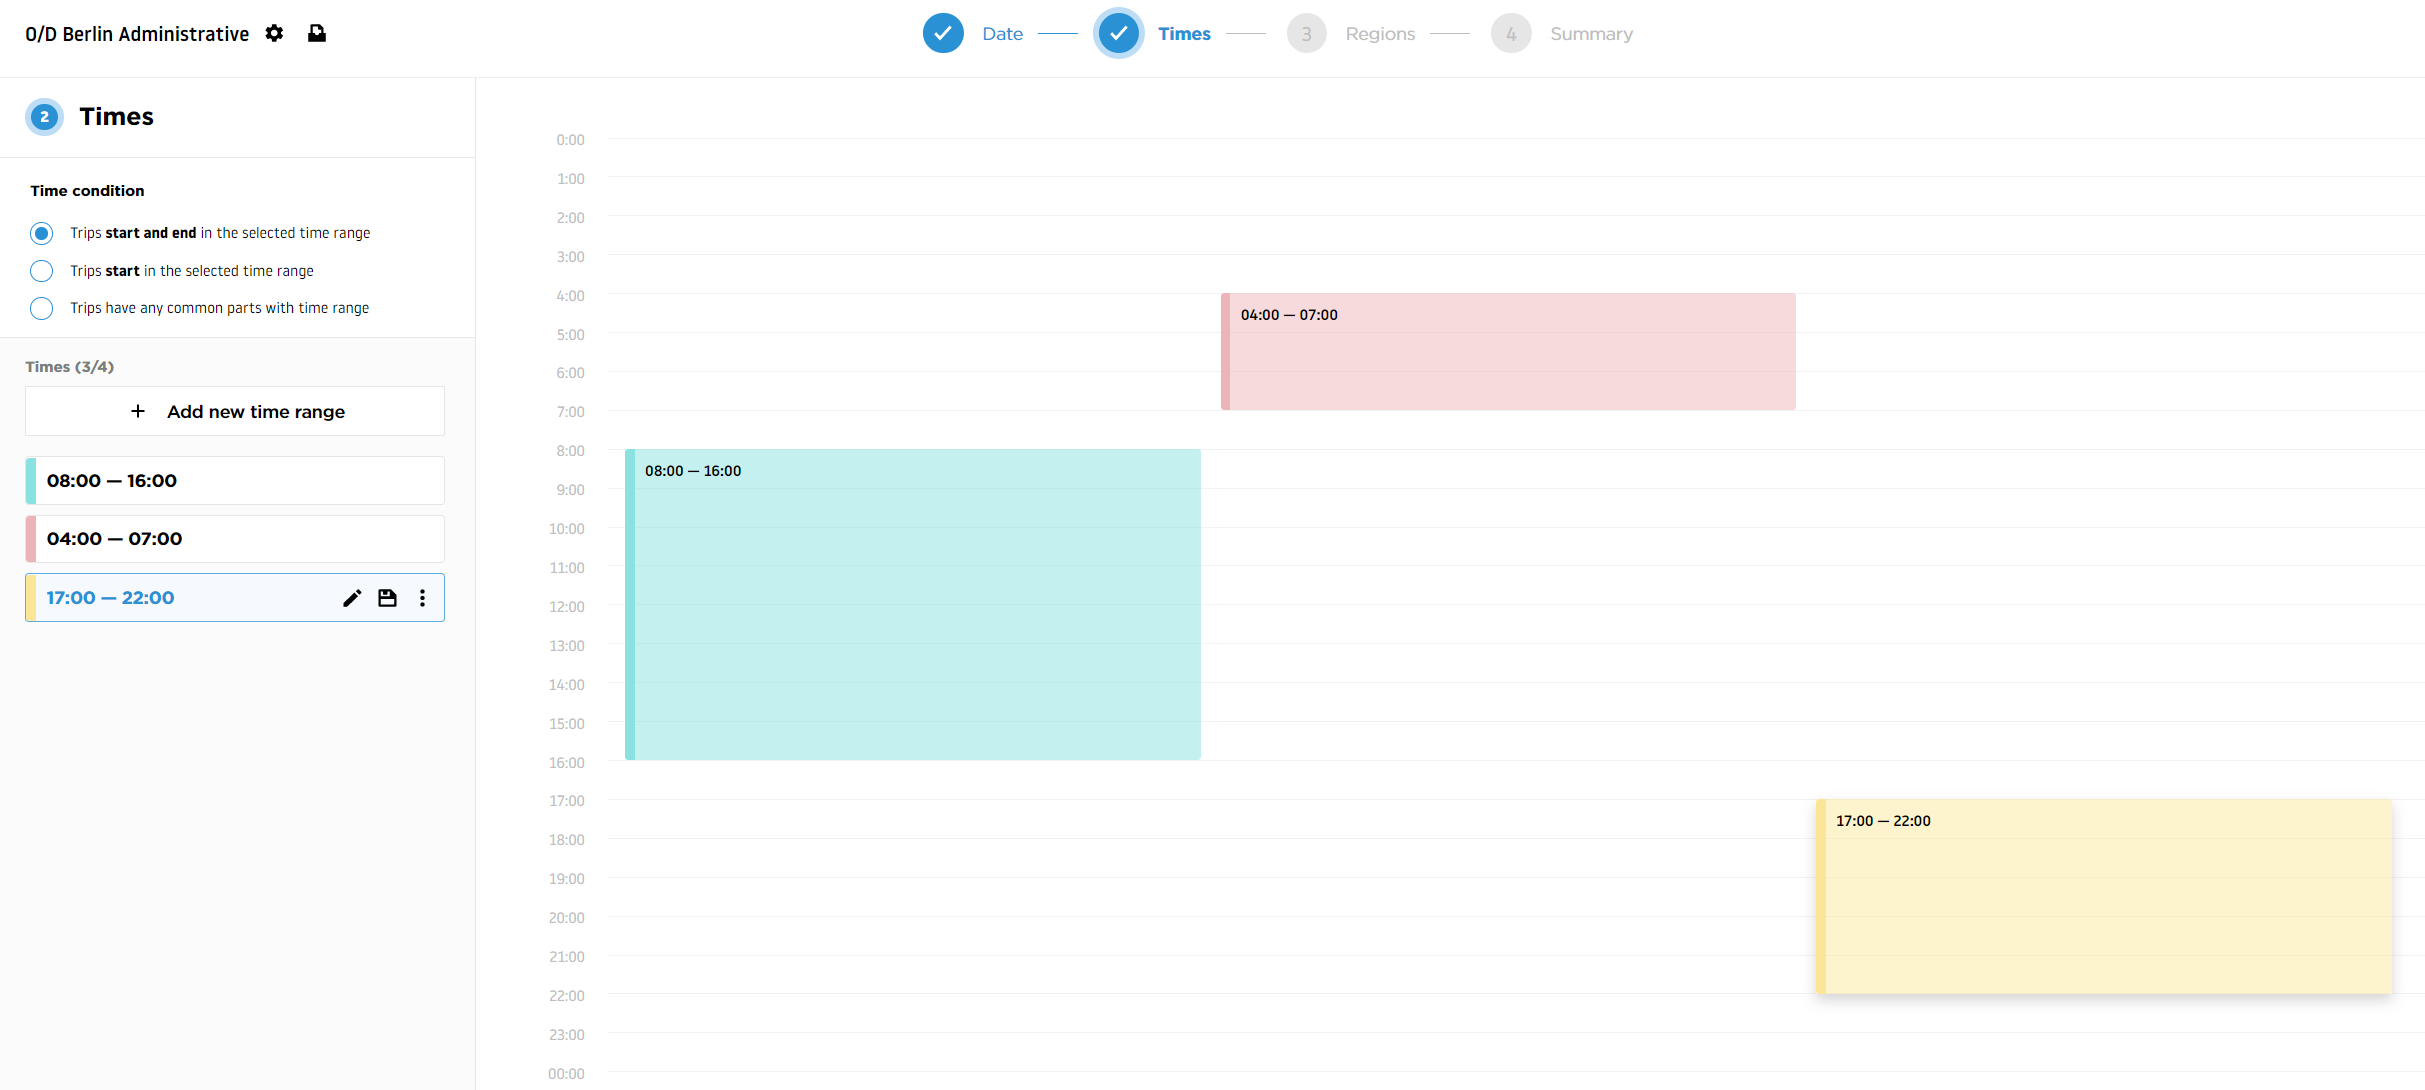
Step 3: Defining the time ranges.

Time range selection interface with 24-hour timeline slider, timezone selector, and time condition dropdown menu
Time range section of the new analysis

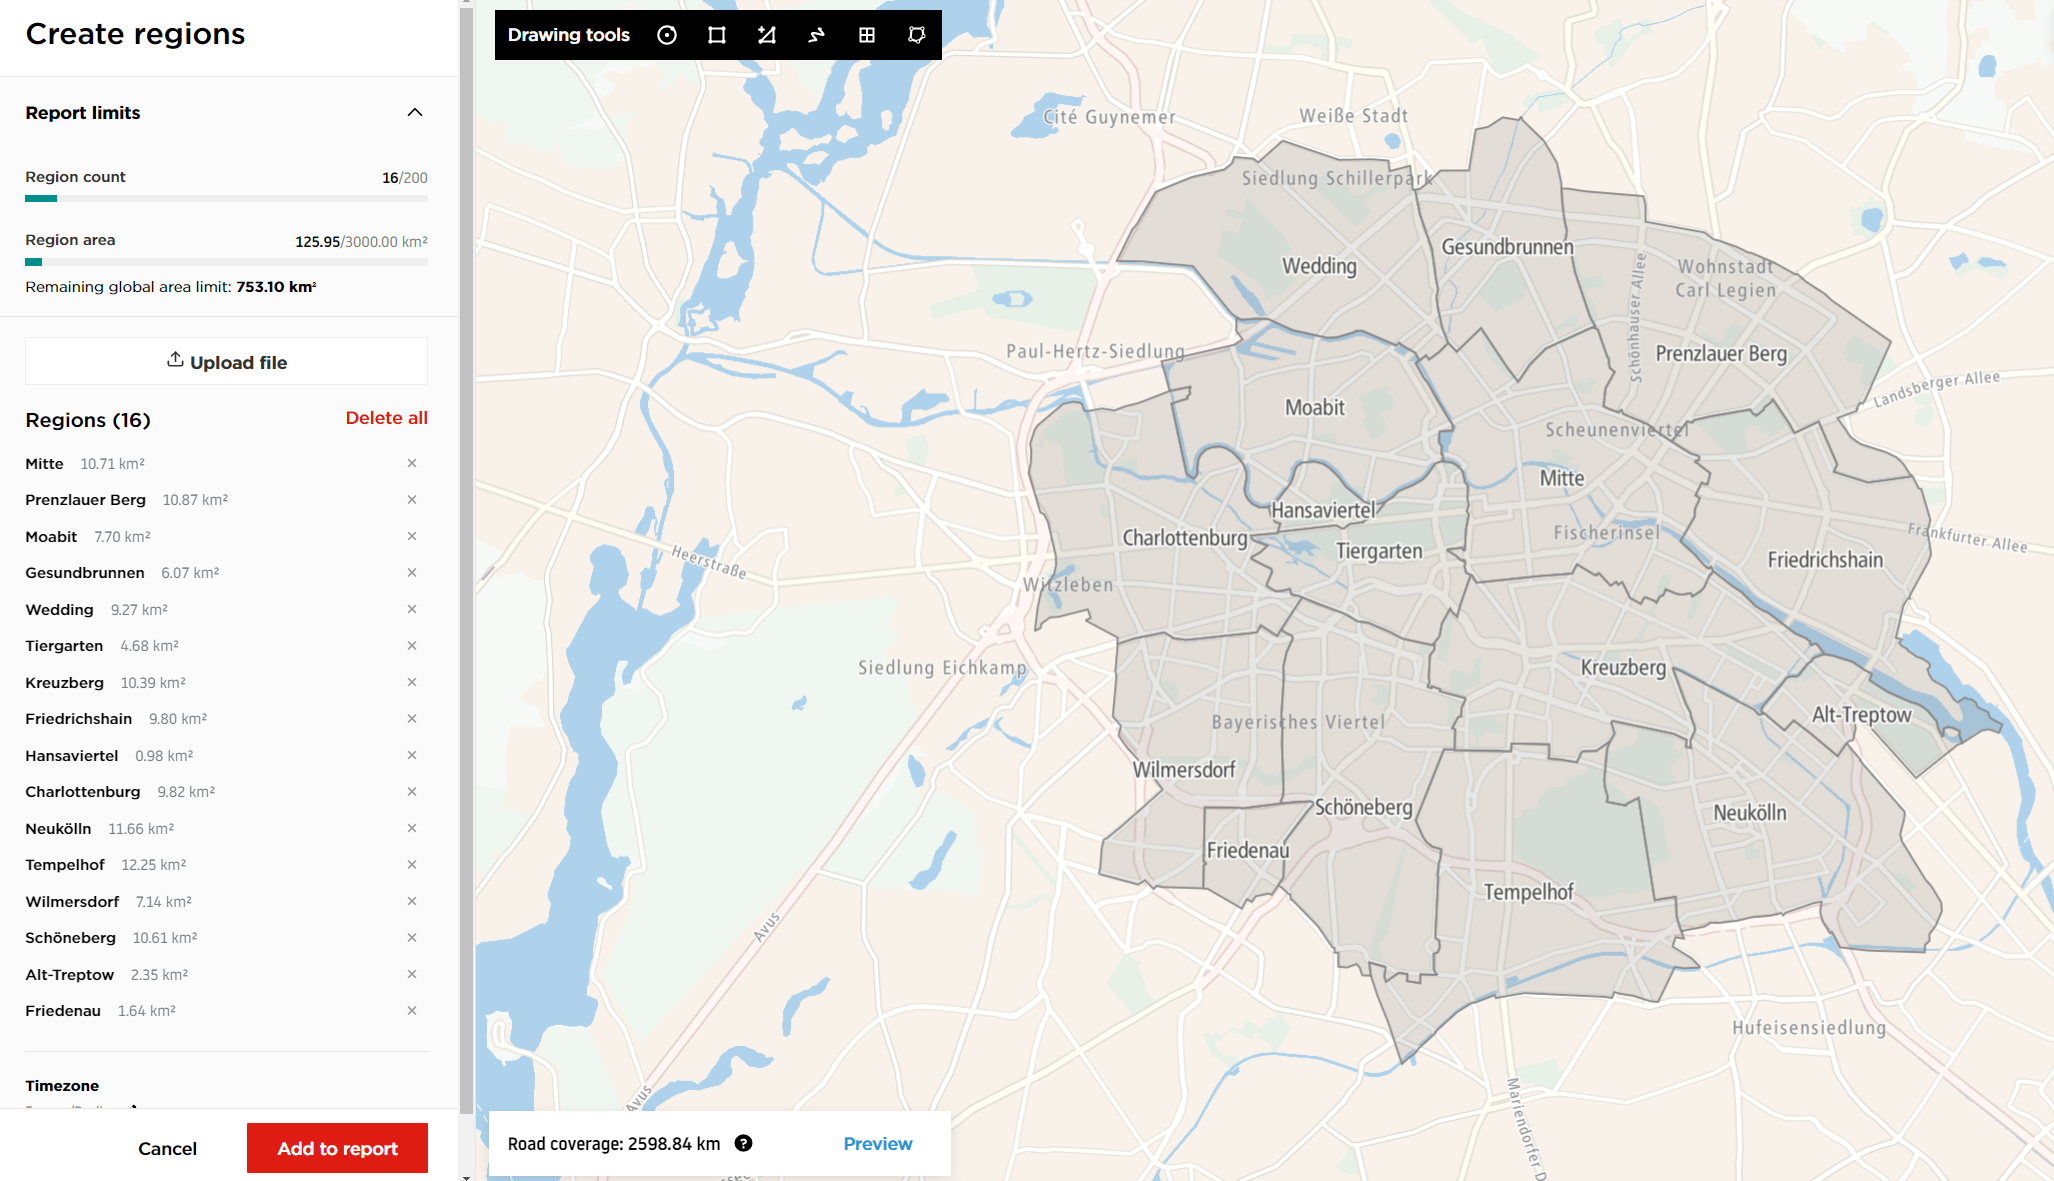
Step 4: Defining the regions of the analysis.

Interactive map view with drawing tools panel on the top, map in center showing defined polygon regions
TomTom O/D Analysis map where the region areas can be defined and visualized while creating a new analysis

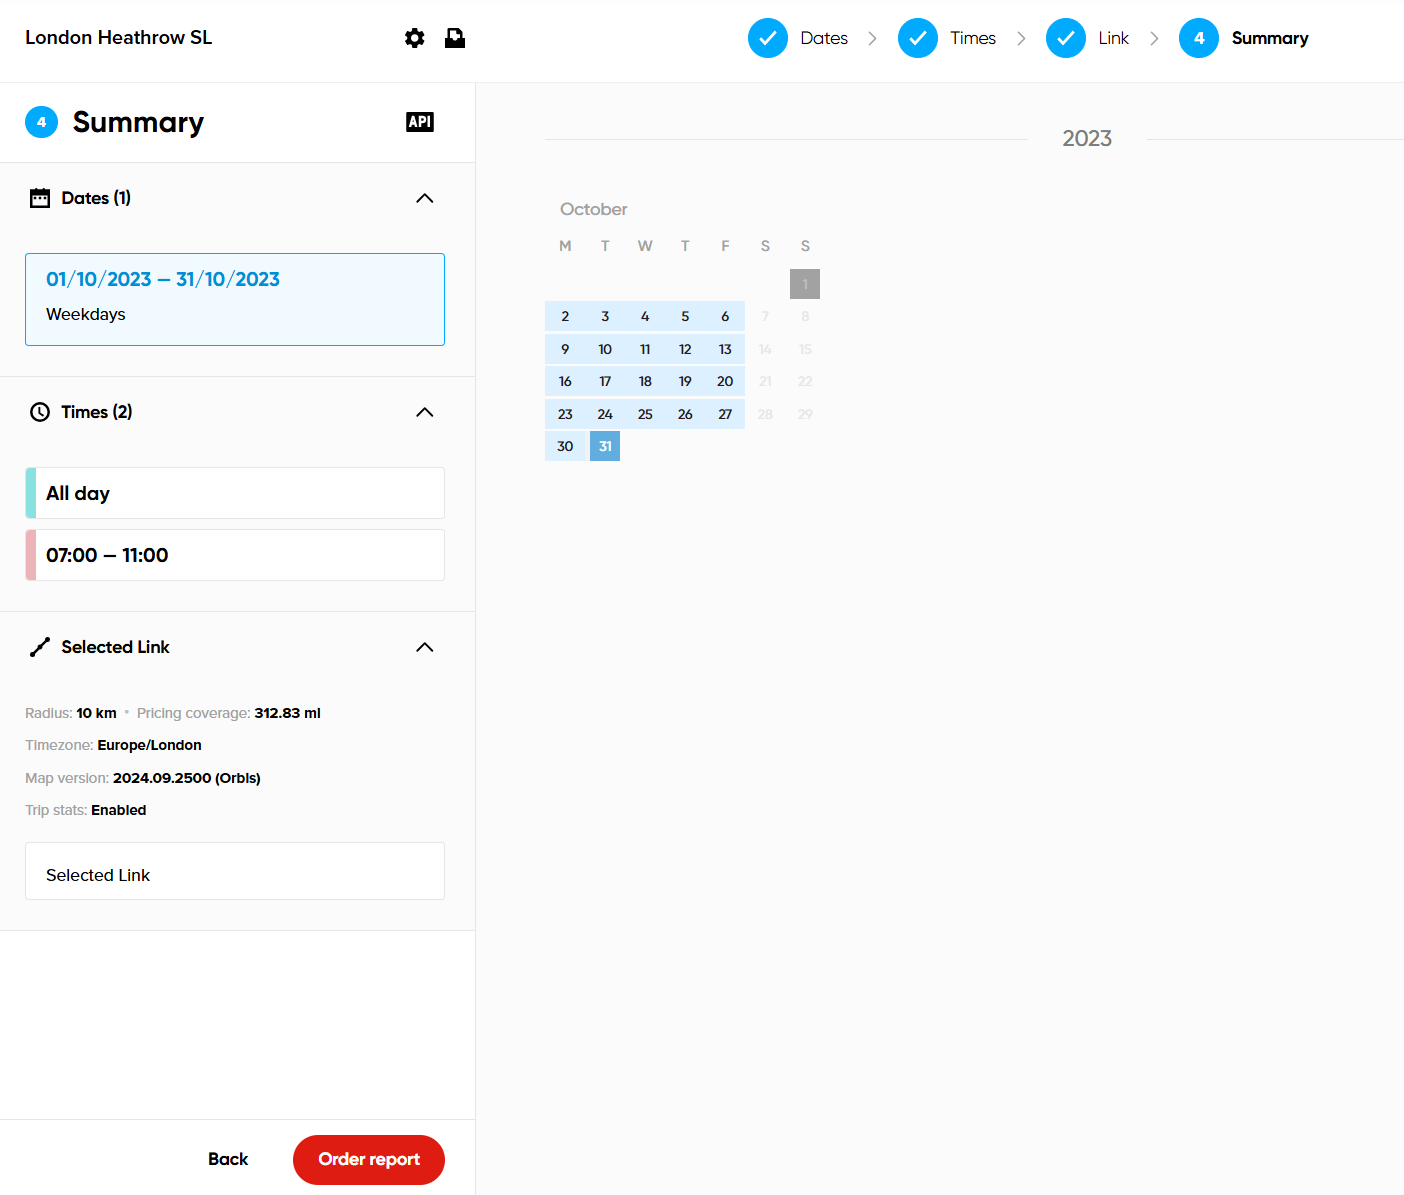
Step 5: Reviewing the analysis summary and ordering the report.

Summary page displaying analysis name at top, defined regions on map, date and time ranges listed, total area and region count, and Order report button at bottom
Analysis summary overview with all the settings defined in previous steps