Segment information
Besides the route information, Route Monitoring also delivers detailed traffic data on a segment level. The segment information is given in a pop-up on the map and in the interactive chart, where your selected segment will be highlighted in dark green.
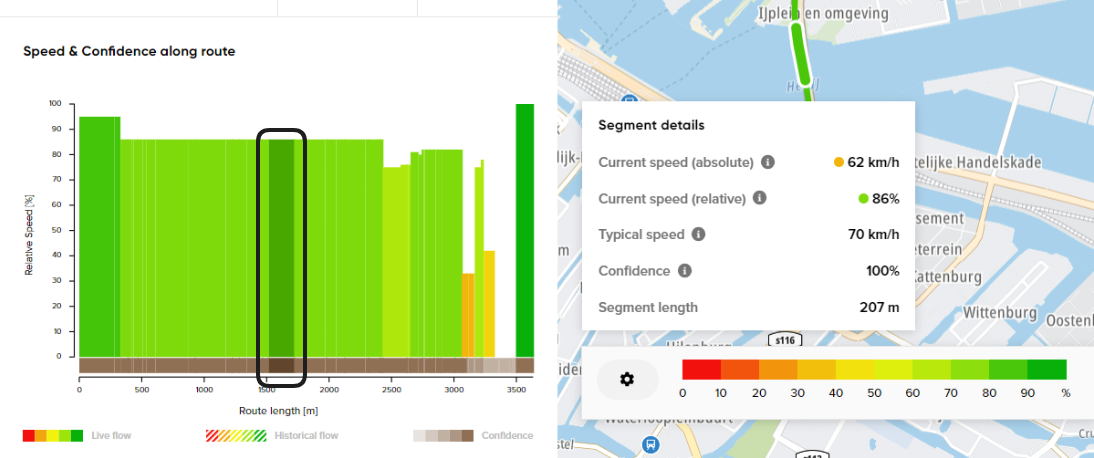
- Current speed (Absolute): The real-time average speed for the specific segment.
- Current speed (Relative): The real-time average speed in comparison to TomTom's free-flow speed.
- Typical speed: The typical speed at a given time based on TomTom Speed Profiles data (calculated per each five-minute time bin). We do not provide any fallback if it is not available.
- Confidence: The confidence level (volume and quality) of the real-time data provided for the specific segment.
- Length: The length of the selected segment.
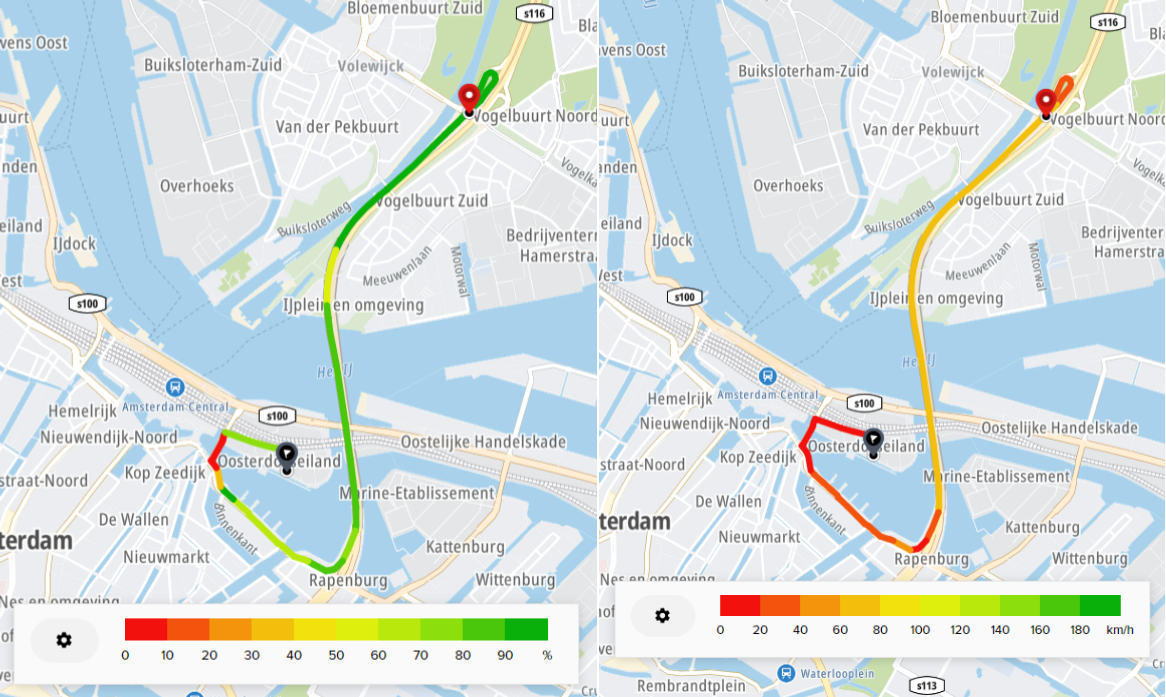
The route segments are colored based on the below values:
Relative values (current speed relative to free-flow):
Red: 0% - 60%
Orange: 60% - 70%
Yellow: 70% - 80%
Light Green: 80% - 90%
Green: 90% - 100%
Absolute values (km/h):
Red = 0 to 30
Orange = 30 to 60
Yellow = 60 to 95
Light Green = 95 to 120
Green = 120+