Matrix
If the analysis was calculated properly and accepted, opening it from your My reports list will load a results page.

TomTom O/D Analysis offers five different methods you can use to review the results. In this chapter, we will focus on the second one - Matrix.
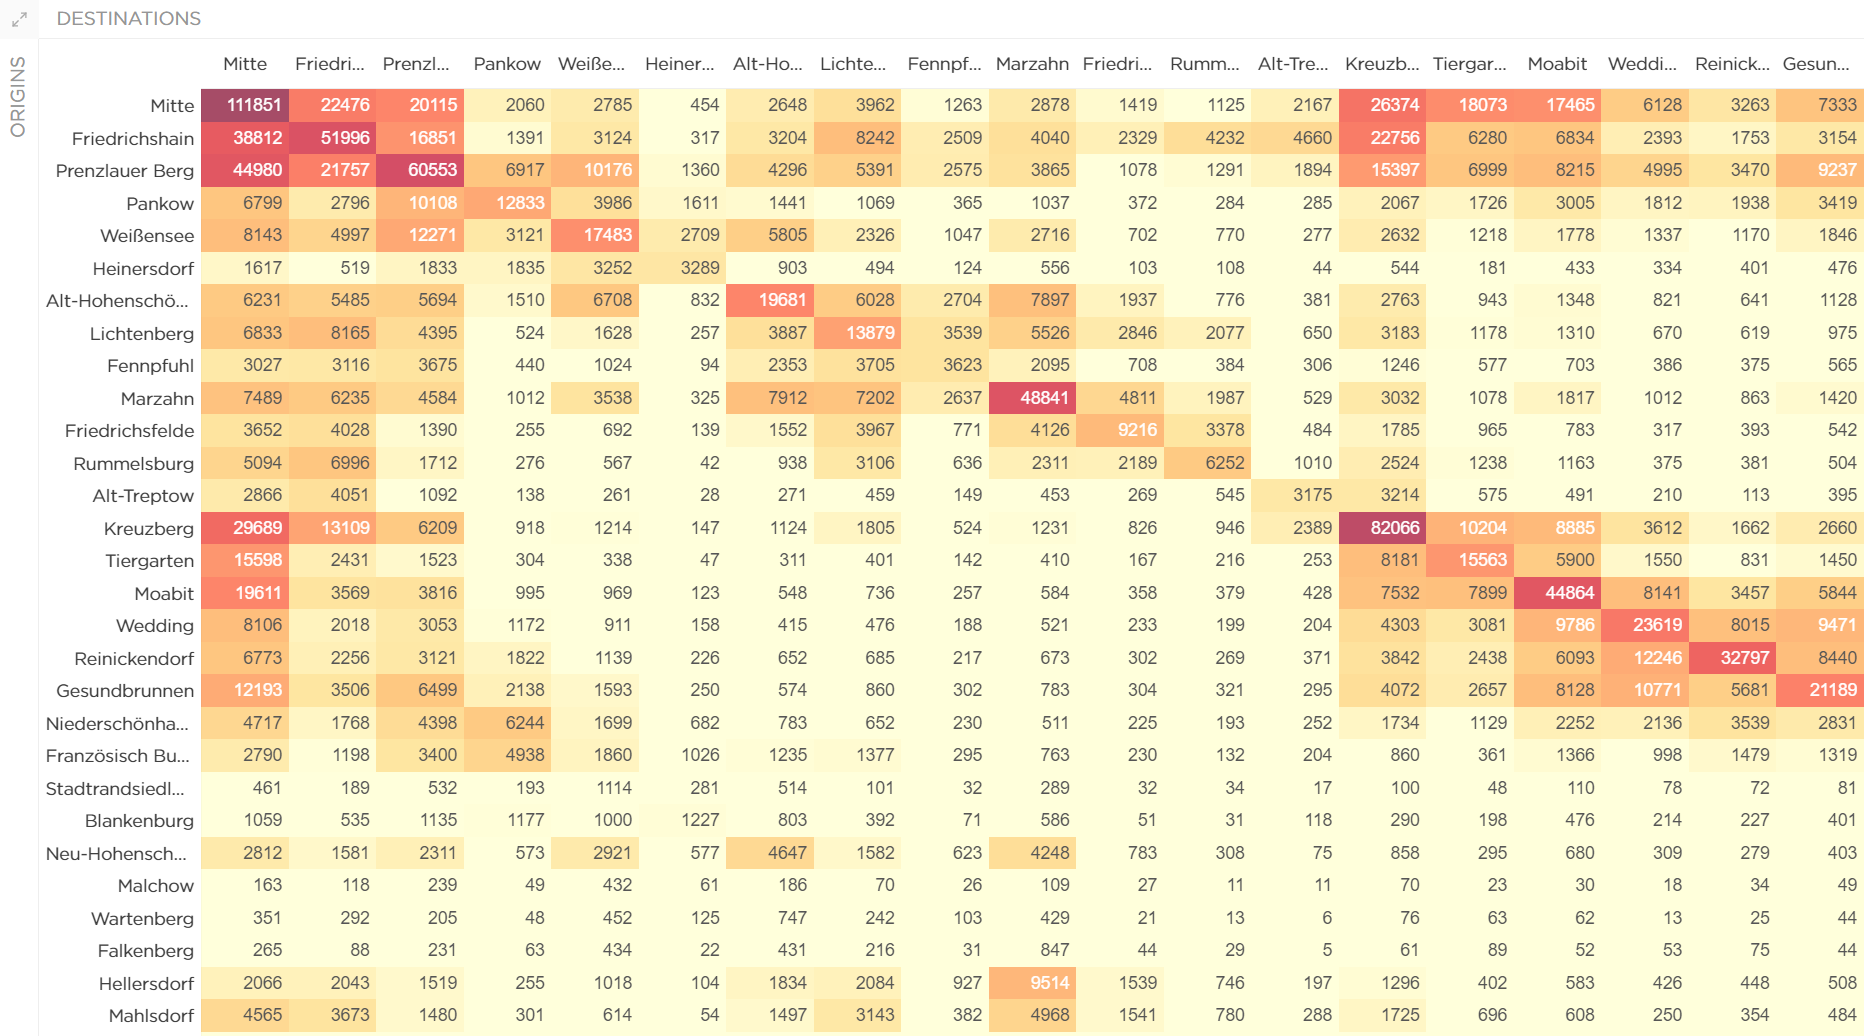
Matrix
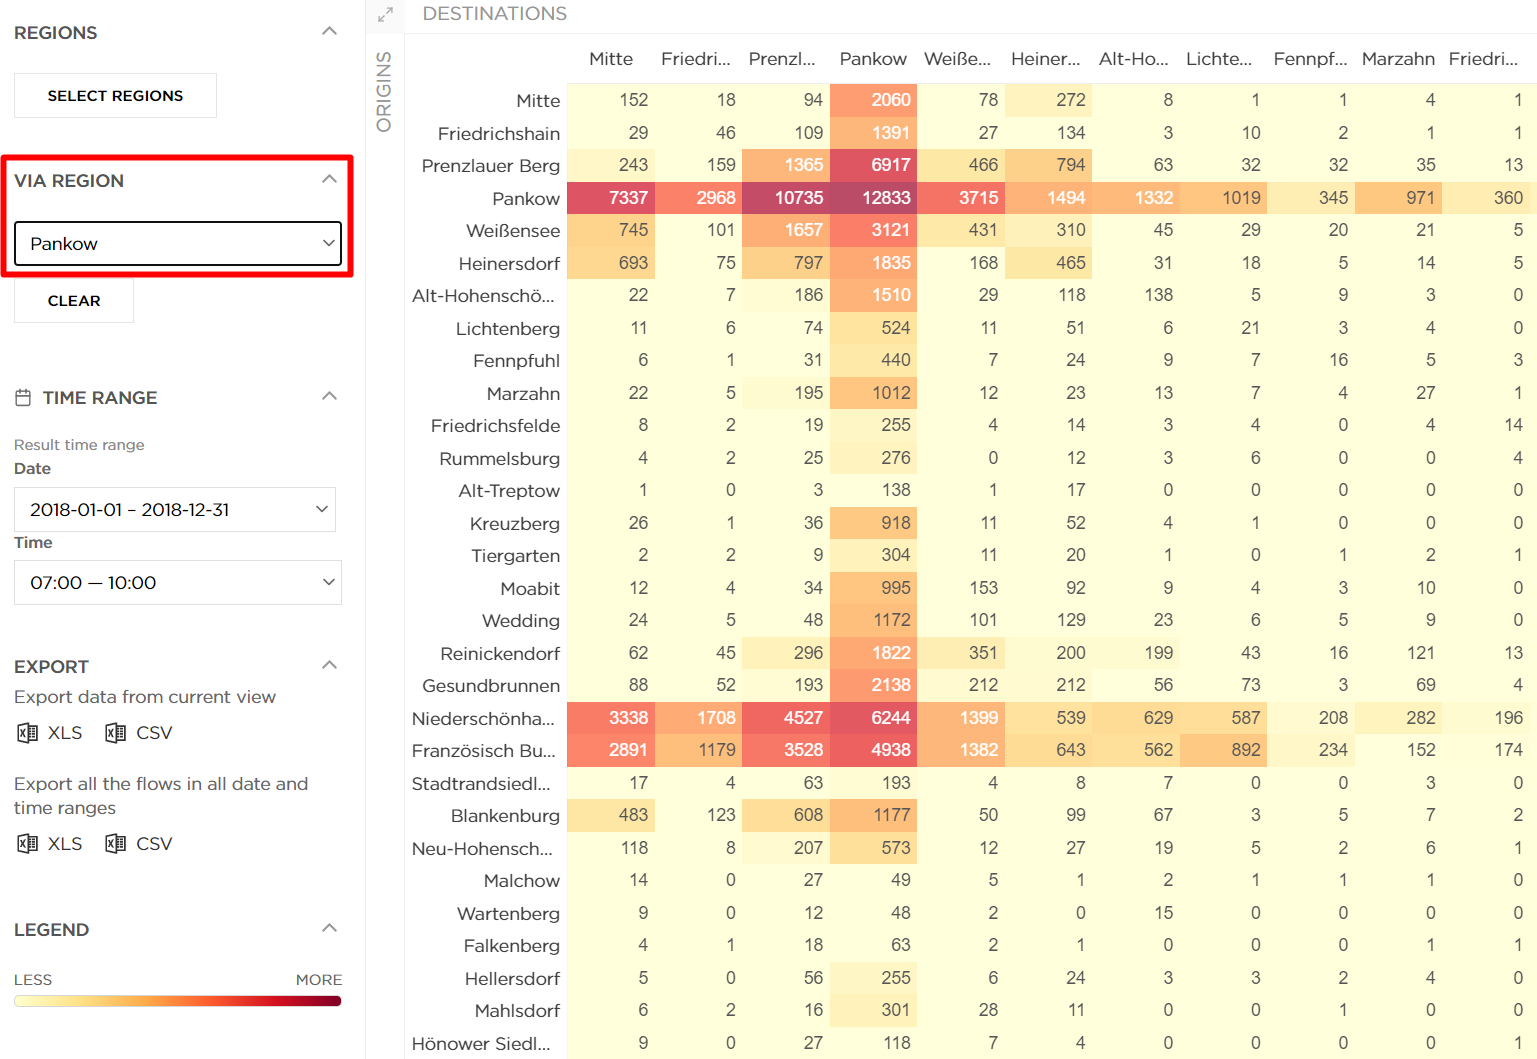
This option shows you all the connections between all your defined regions in the form of a table.
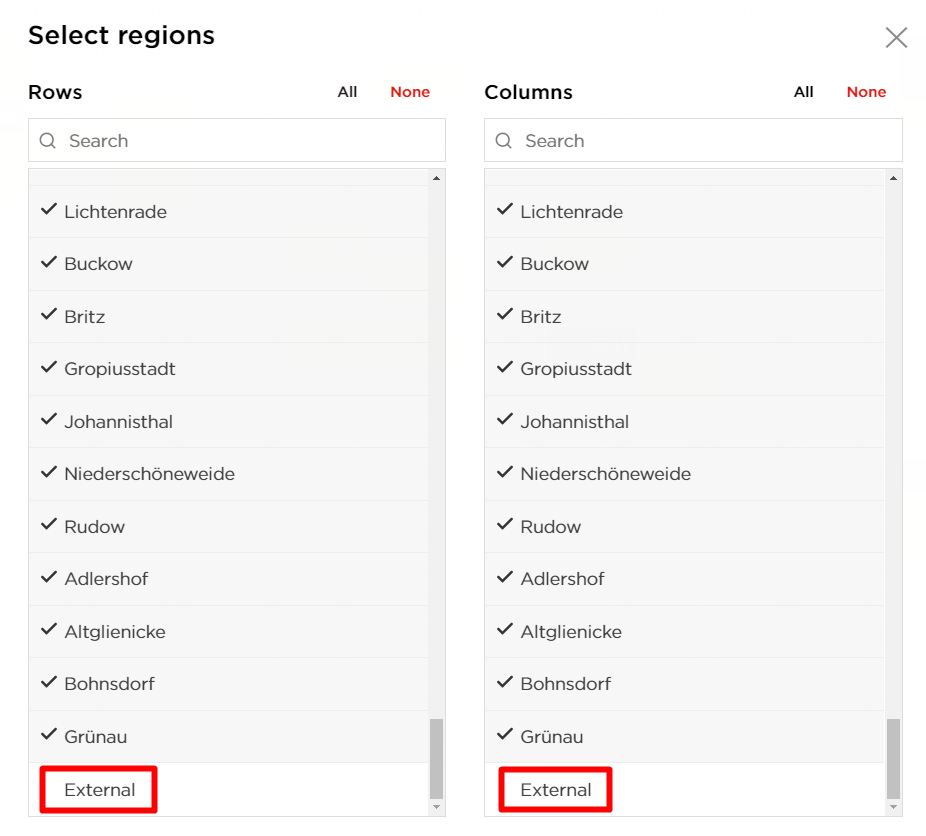
You can also select which regions you want to see in the report.
The additional region that is not selected by default is External. Checking this region shows you the number of trips coming from the area outside the selected regions and vice-versa, from your regions to the outside.
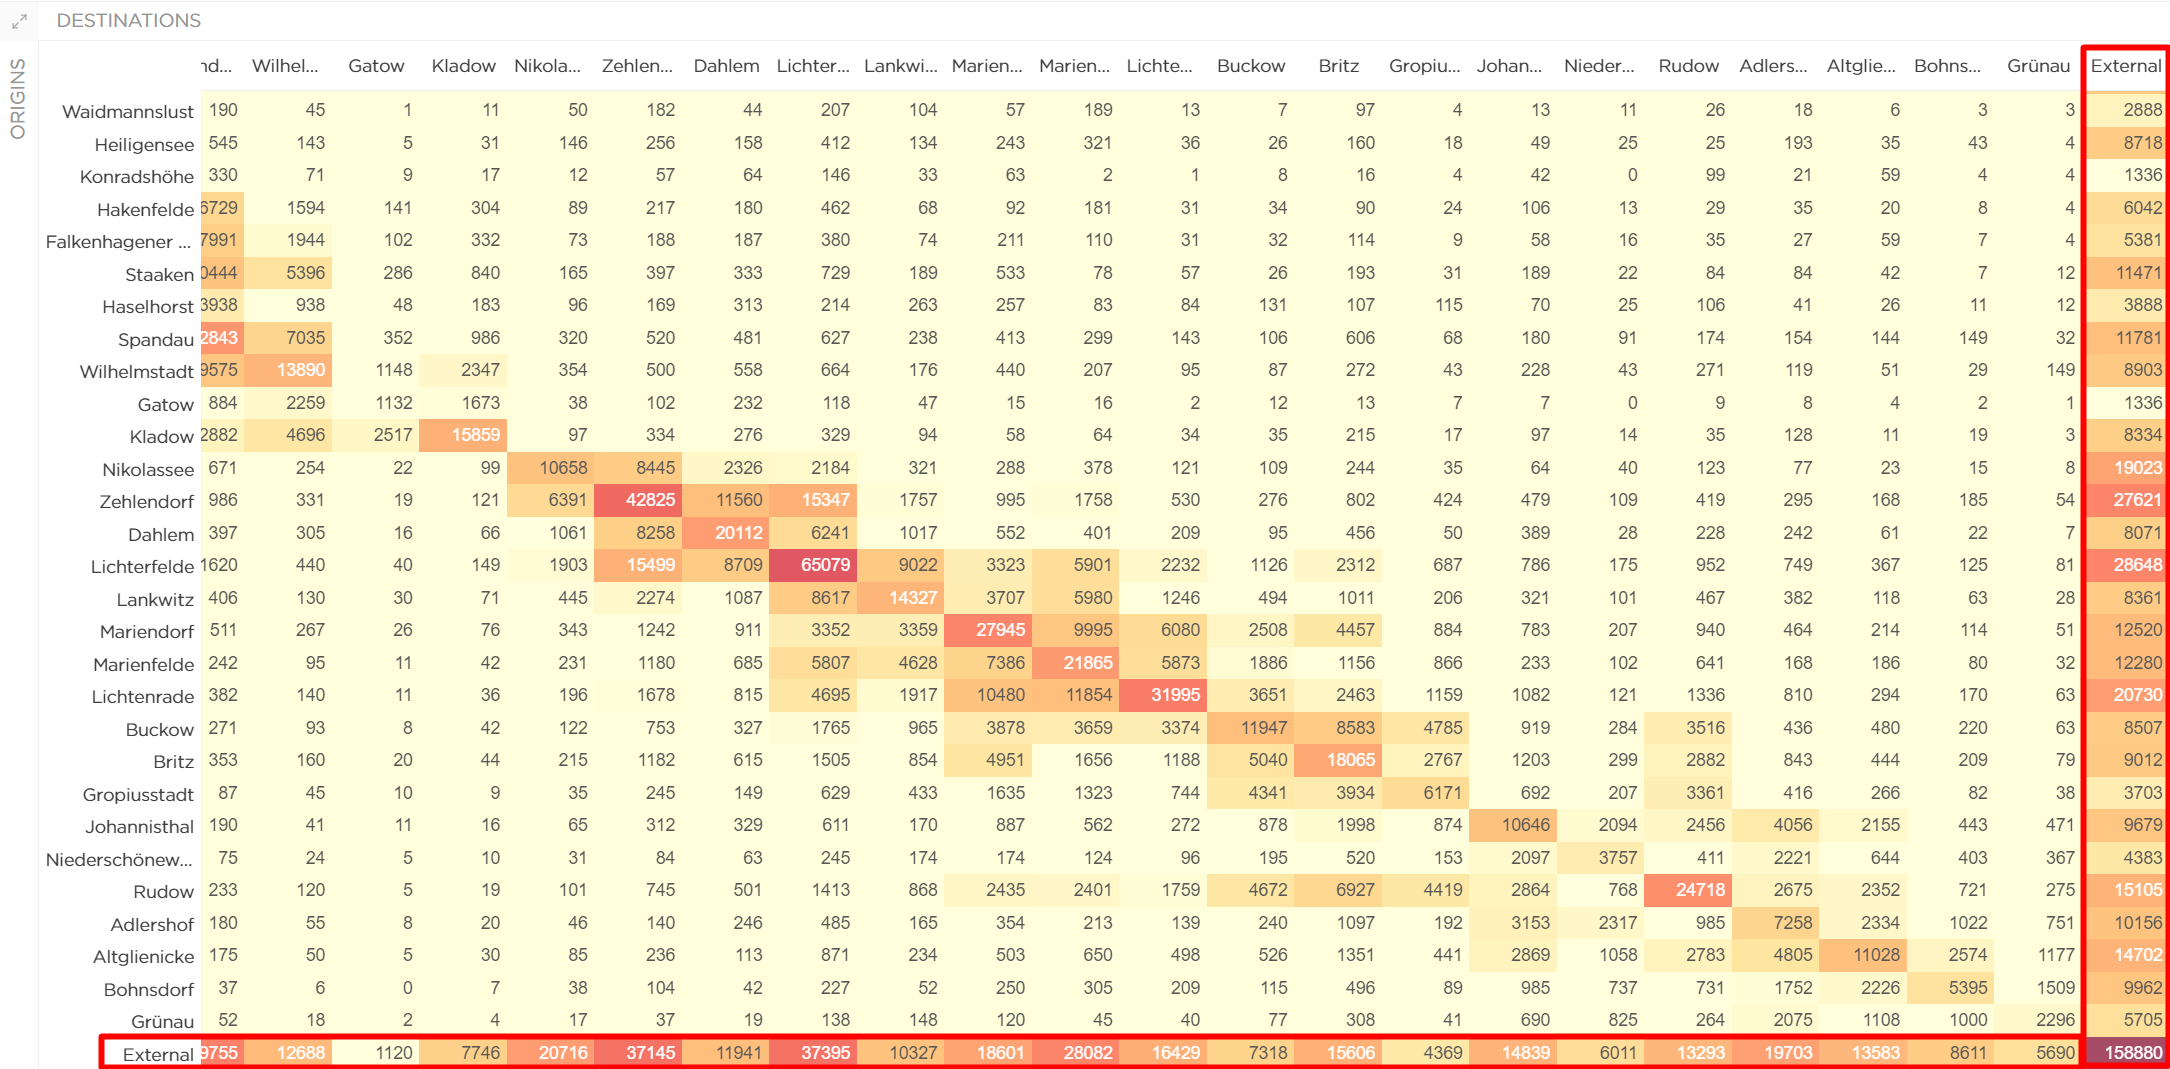
Below, you can see a Colored Matrix report result when the External region is checked and visible at the very bottom and on the right side.
Another option available in the Matrix view is to select the Via region. This means you will see the number of trips between different regions that specifically traveled through the region selected as Via.
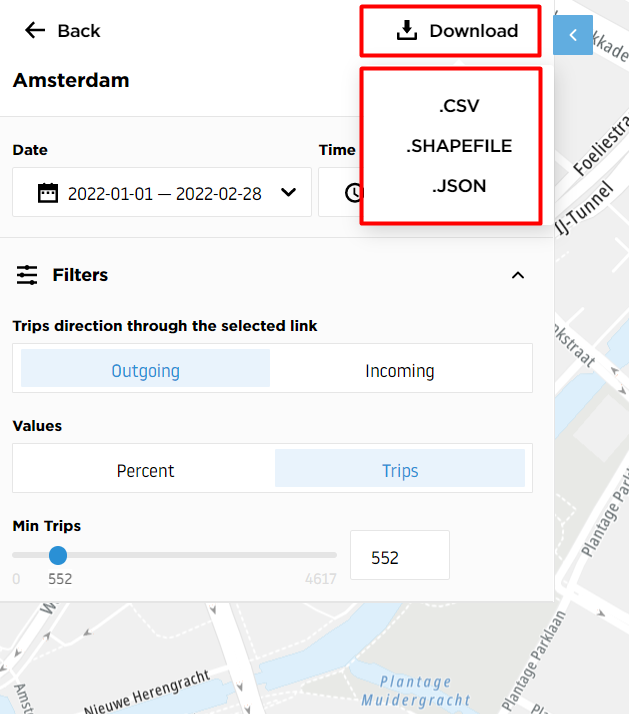
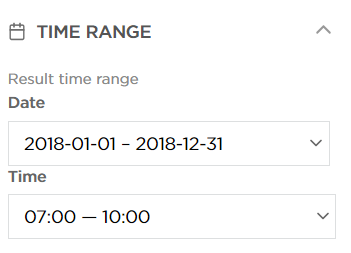
The time and date ranges can be changed on the left side:
The Matrix table results can be downloaded in two file formats: