Route analysis results
Keep in mind: Analysis results are available for two years. After two years, the report will expire. We strongly recommend saving the results on your device or cloning the report to maintain the results for a longer time.
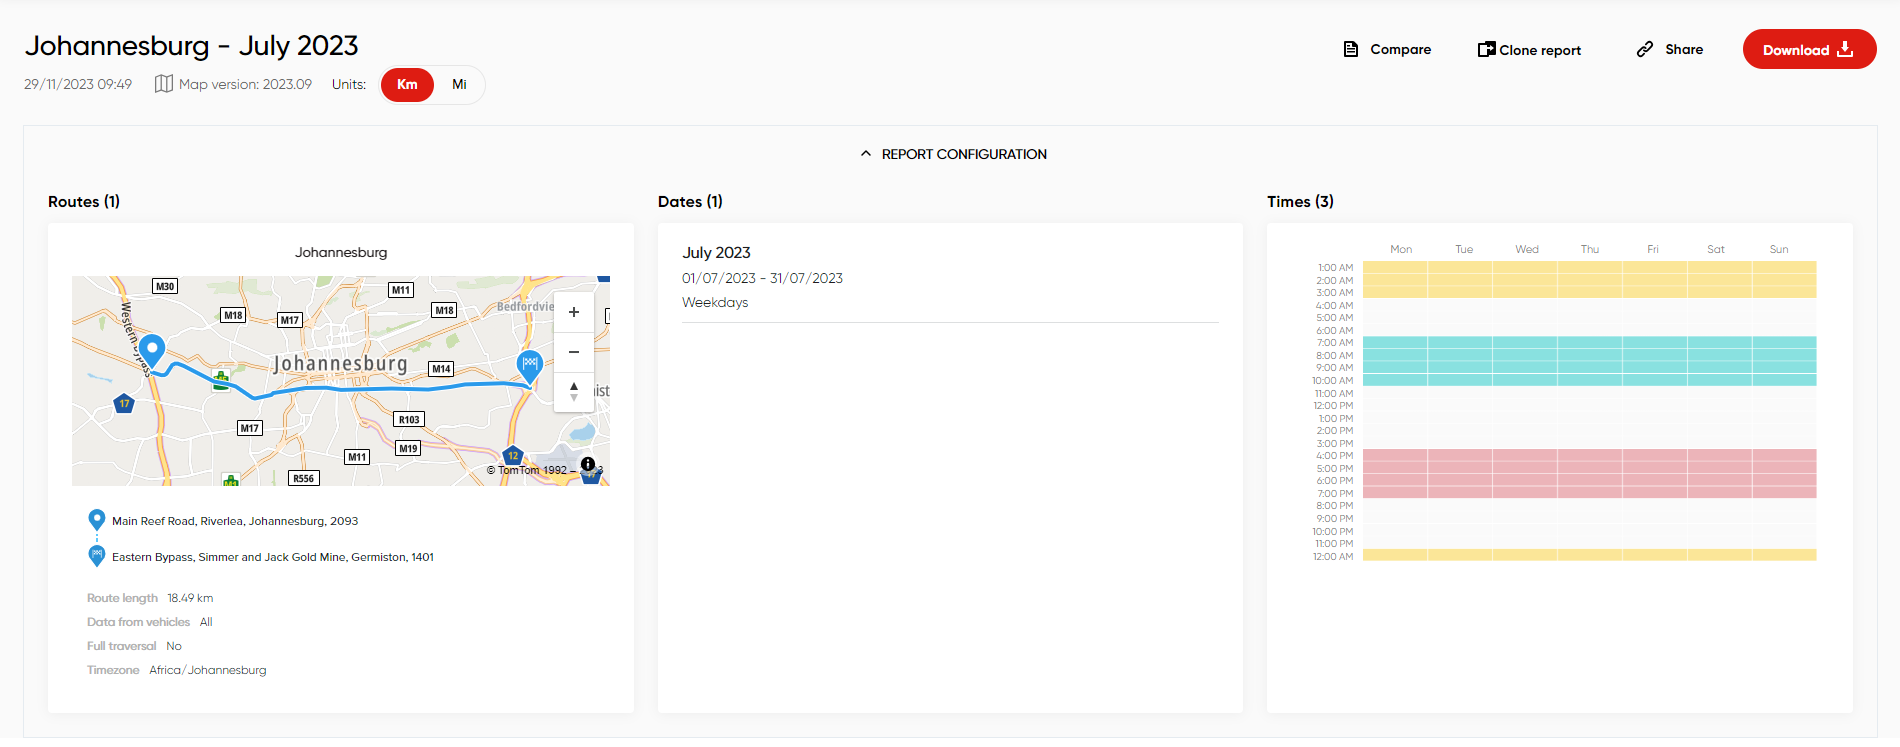
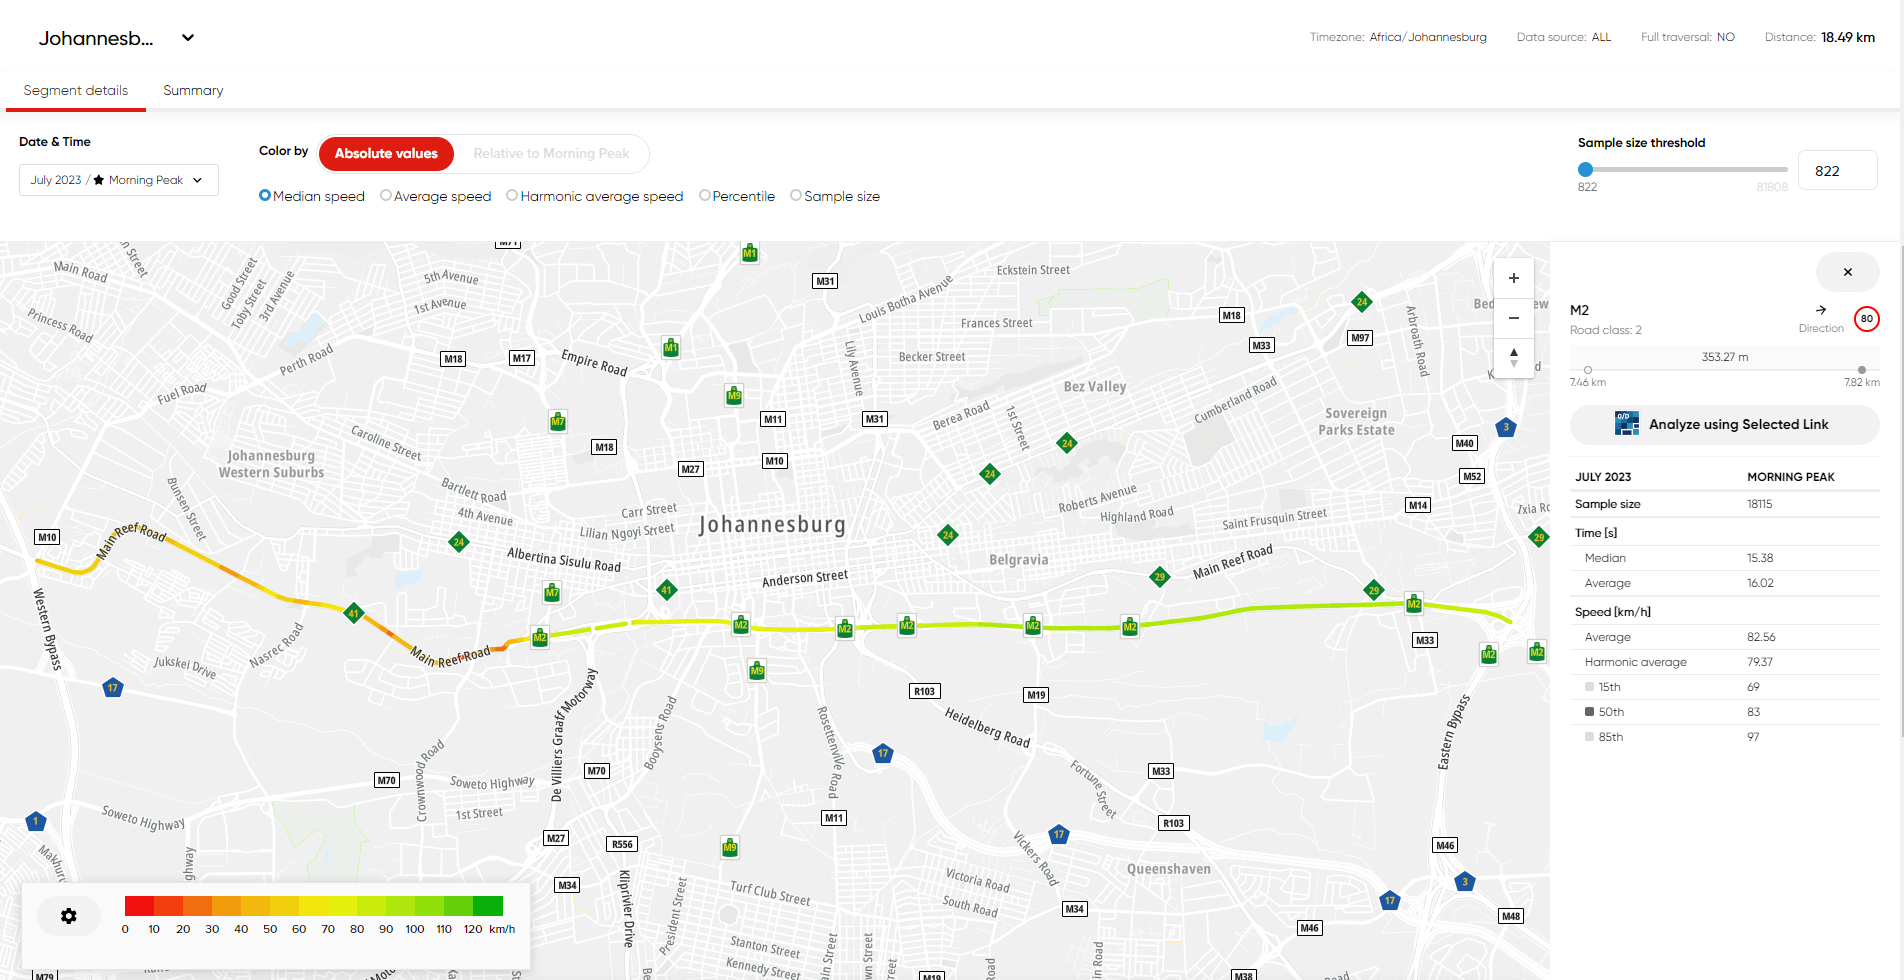
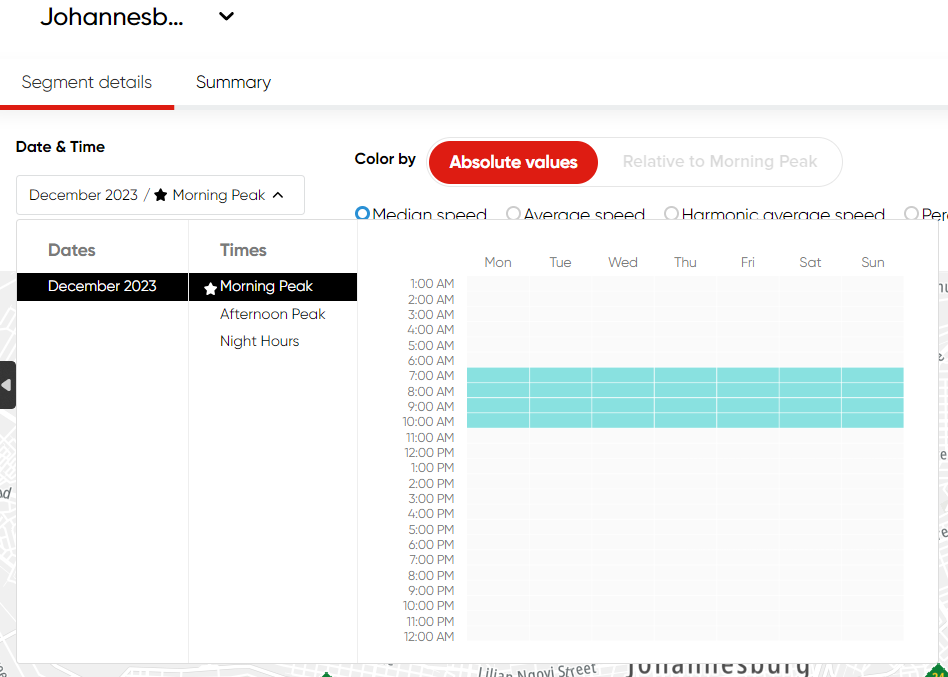
Example of route results visualization:
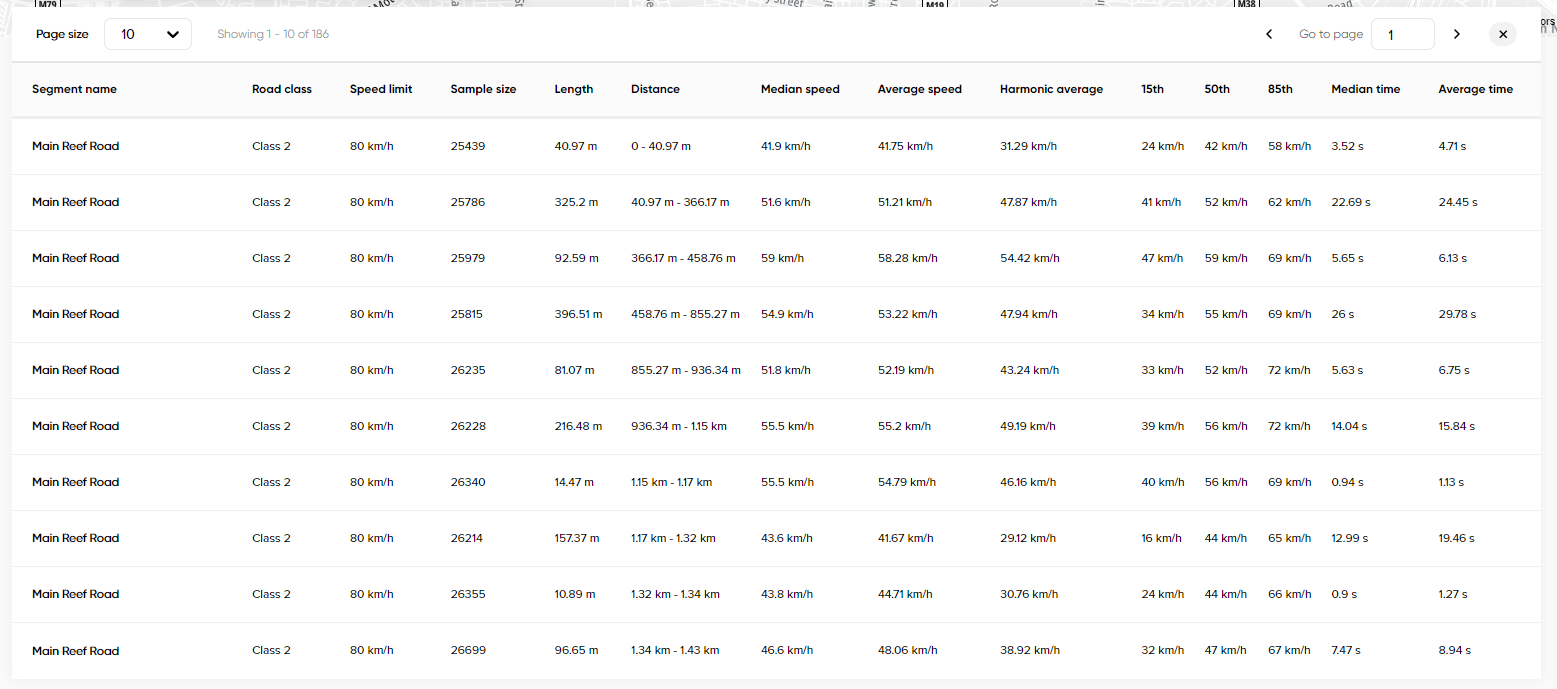
Segment list of the route analysis:
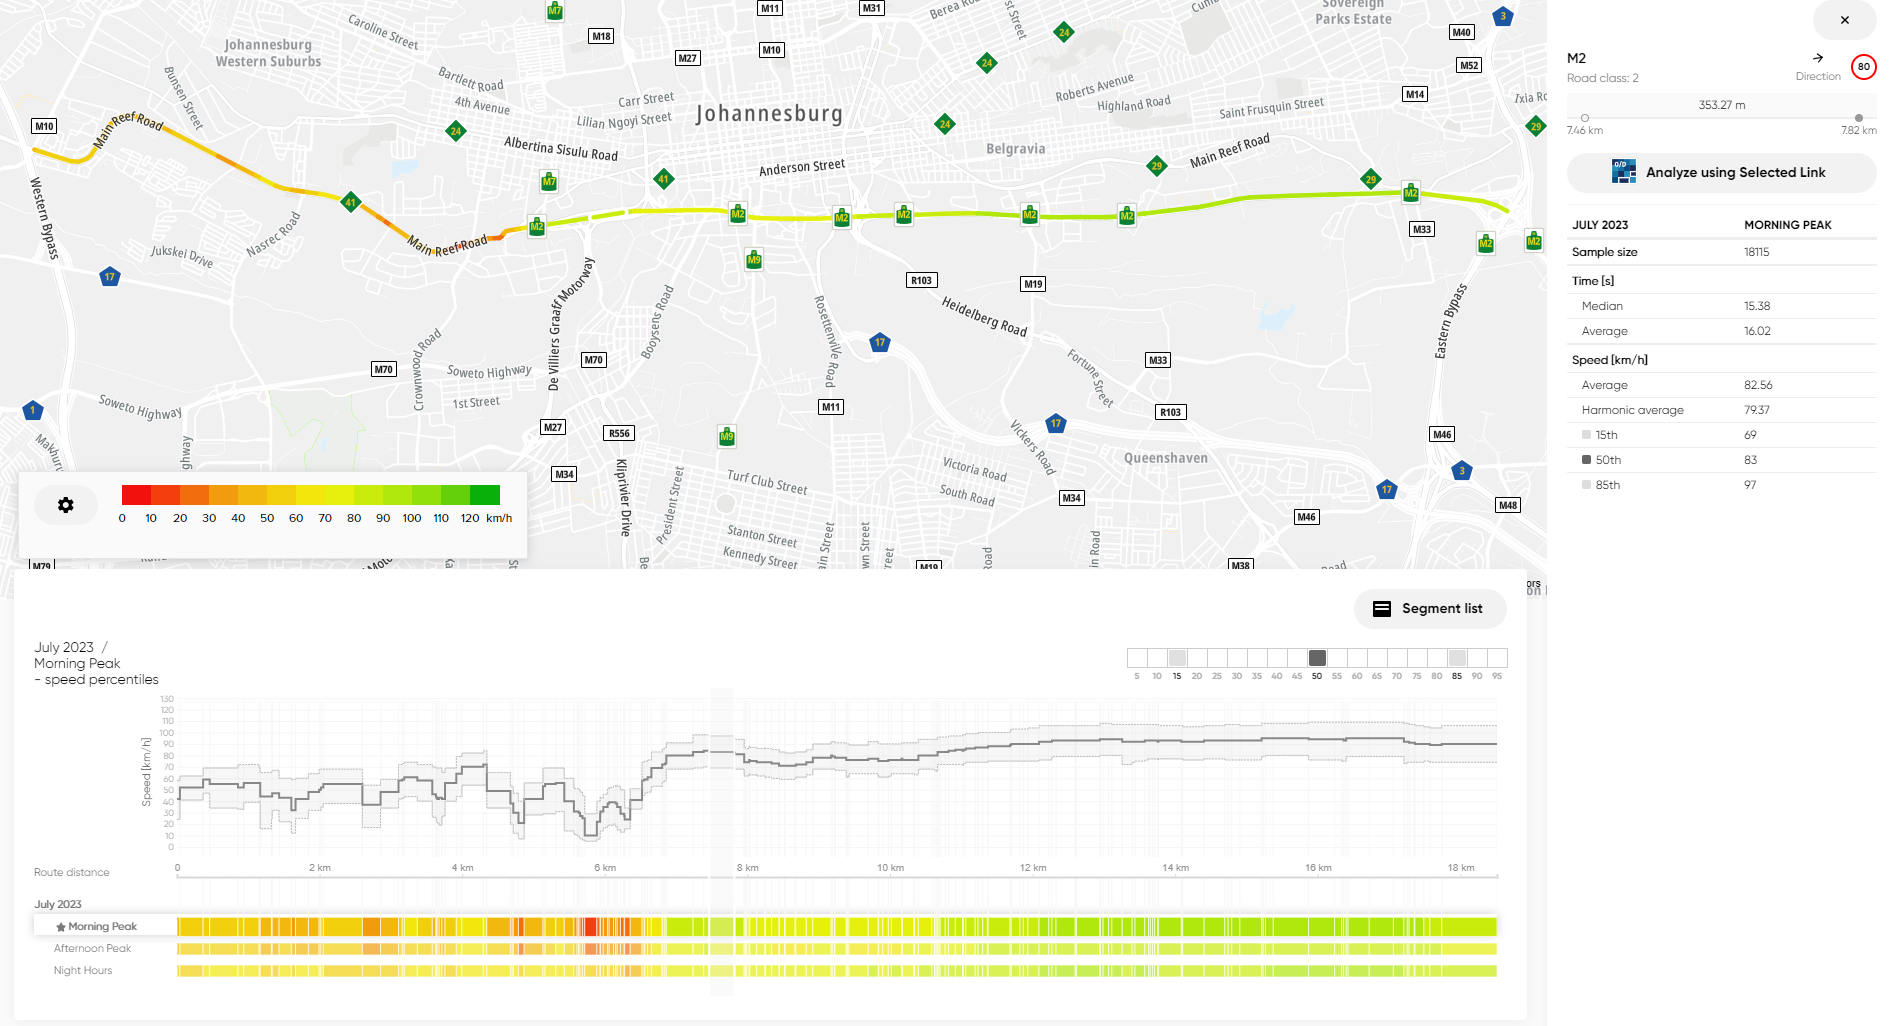
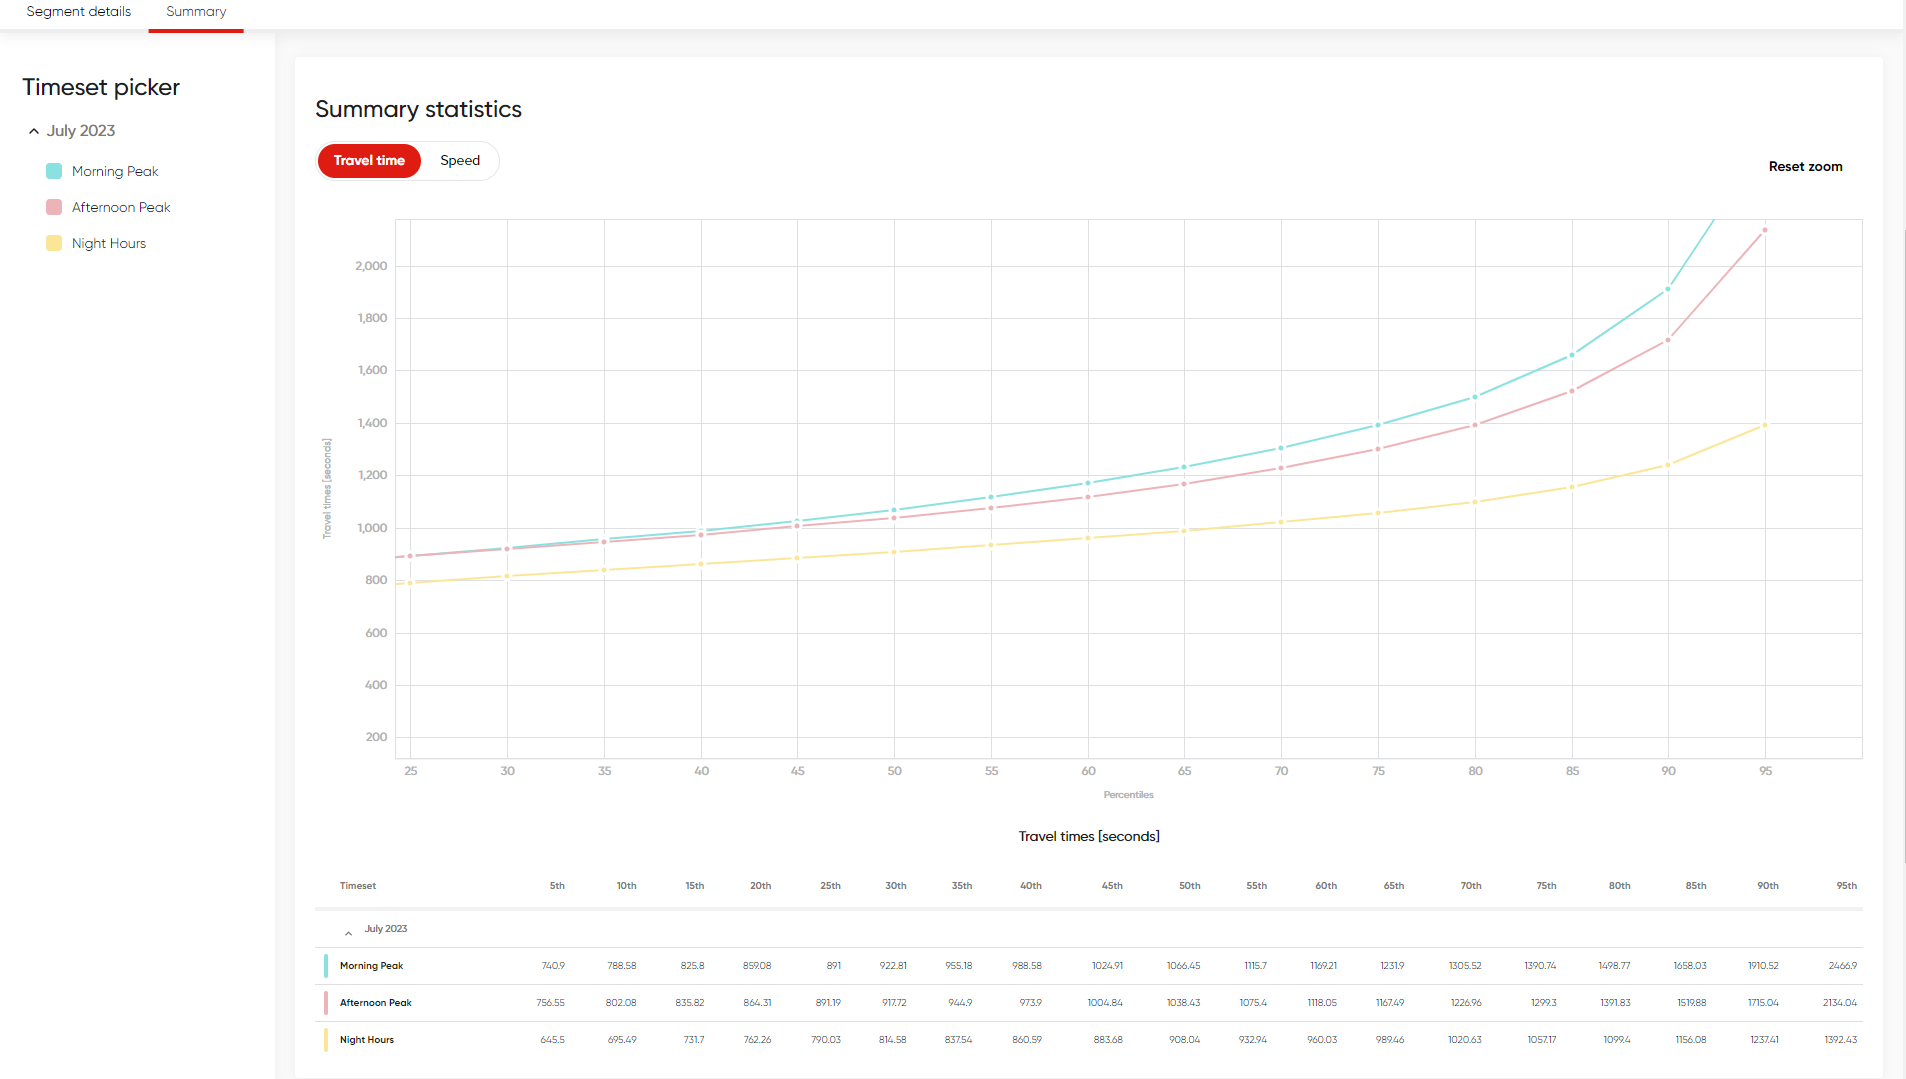
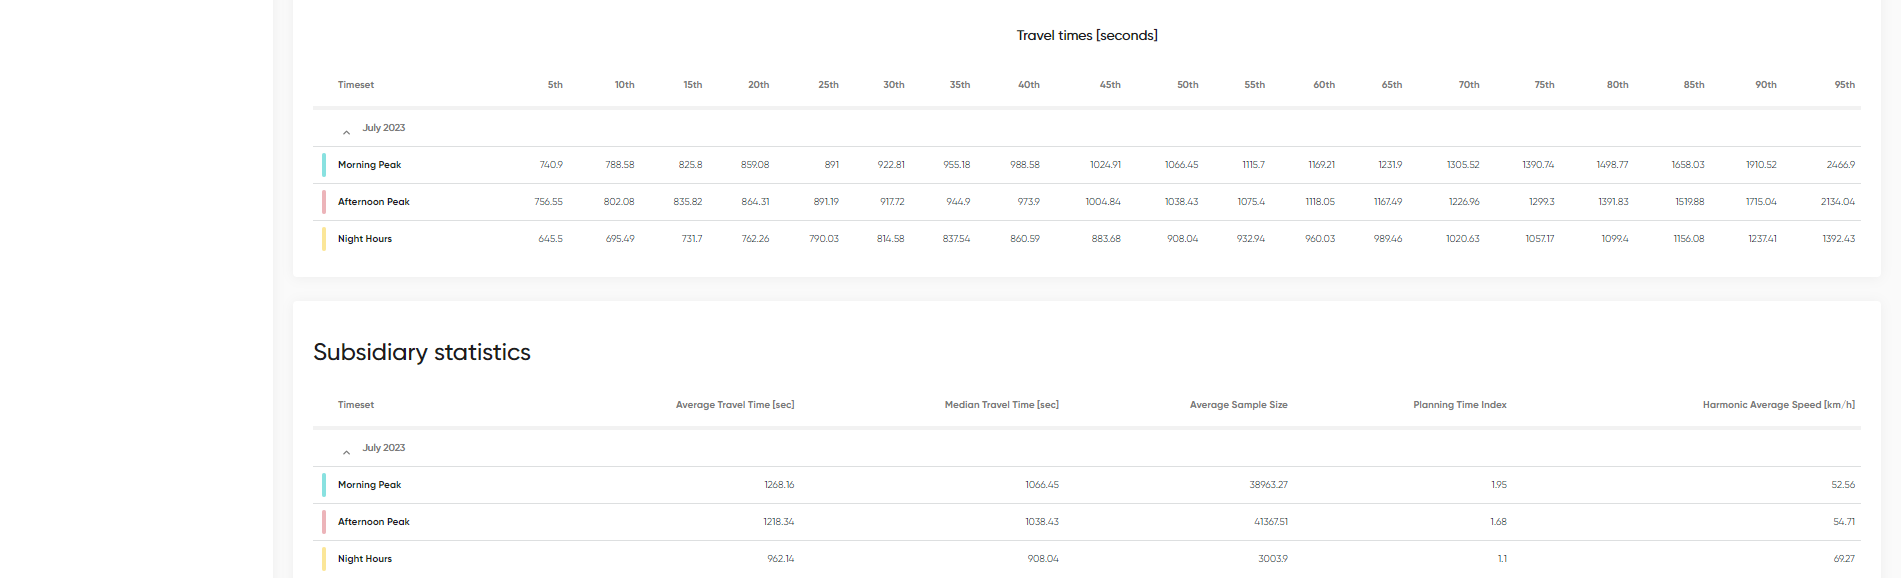
Example of route results visualization - summary:
For every Route Analysis, the results and route definition can be downloaded. The downloadable files include:
- Zip (GeoJSON)
- JSON
- KMZ
- Zip file
- XLSX (Microsoft Excel)
GeoJSON GeoJSON is a format for encoding a variety of geographic data structures.
JSON The JSON file contains all information presented in the XLSX file but presented in a human-readable text format. Please refer to the XLSX section below.
KMZ A Google file format with route geometry, average speeds and travel time ratios that can be displayed e.g on Google Earth.
XLSX The spreadsheet (Excel format) file gives basic information about the analysis, such as the name of the job, creation date, date ranges and time sets, presented within the first sheet of the workbook. In addition, the first sheet contains information on a route level:
- Route ID
- Route name
- Date Range
- Time set
- Full traversal
- Probe source
- Covered route length [meters]
- Sample size [average per segment]
- Average travel time [hh:mm:ss]
- Median travel time [hh:mm:ss]
- Harmonic average speed [kph]
- 15th percentile Speed [kph]
- 85th percentile Speed [kph]
- Average travel time ratio (ratio of travel time in the current time set to travel time in the base set)
- Planning Time Index
- From 5th to 95thpercentile of travel time
- Total route length [meters]
- Map versions
- Standard deviation of travel time (available only for tull traversals)
In each Traffic Stats report, one of the time sets is marked as the base set, indicated by a black star. When you have more than one time set in the analysis, the travel time ratio shows you a comparison of a given time set to the base one.
The following sheets in the Excel file provide:
- Speeds (harmonic average) - on segment level
- Speeds (median) - on segment level
- Percentile speeds - on route level
- Percentile travel times - on route level
- Cumulative travel times - on segment level
- Relative standard deviation - on segment level
- Travel time ratio - on segment level
- Percentiles each segment - on segment level
ZIP file The compressed file delivers the Shapefile (Esri format) with route geometry and DBF tables corresponding to the time sets pre-defined in the analysis.