Junction results
To open the results of a specific junction you previously created in Junction Analytics, click its name in the My Junctions section, as explained in the previous article.
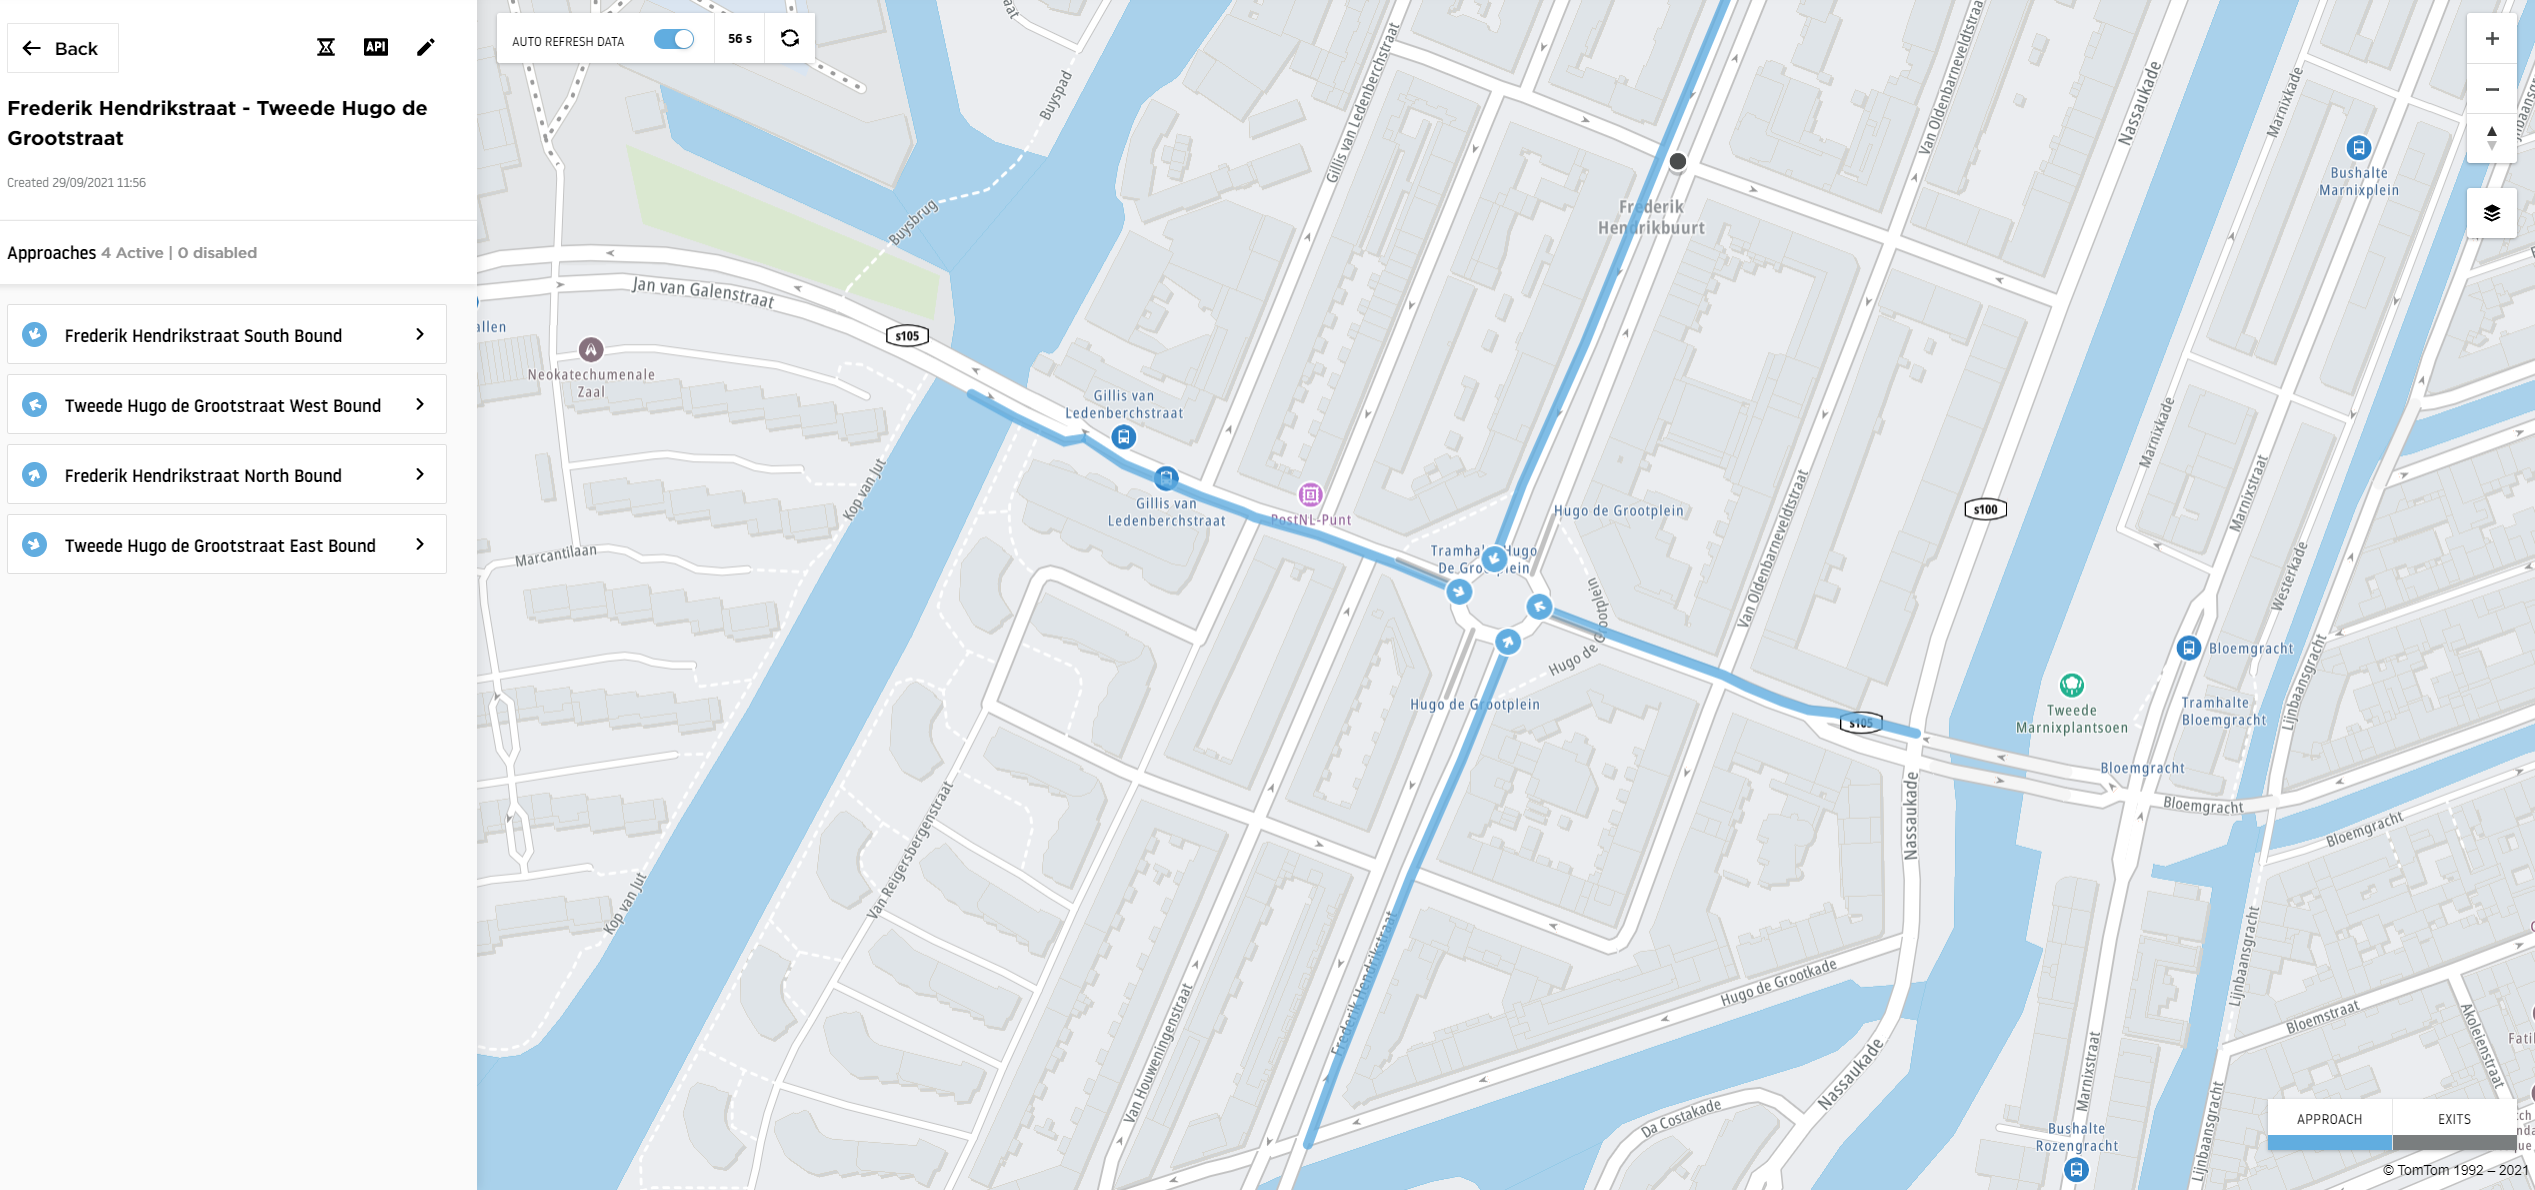
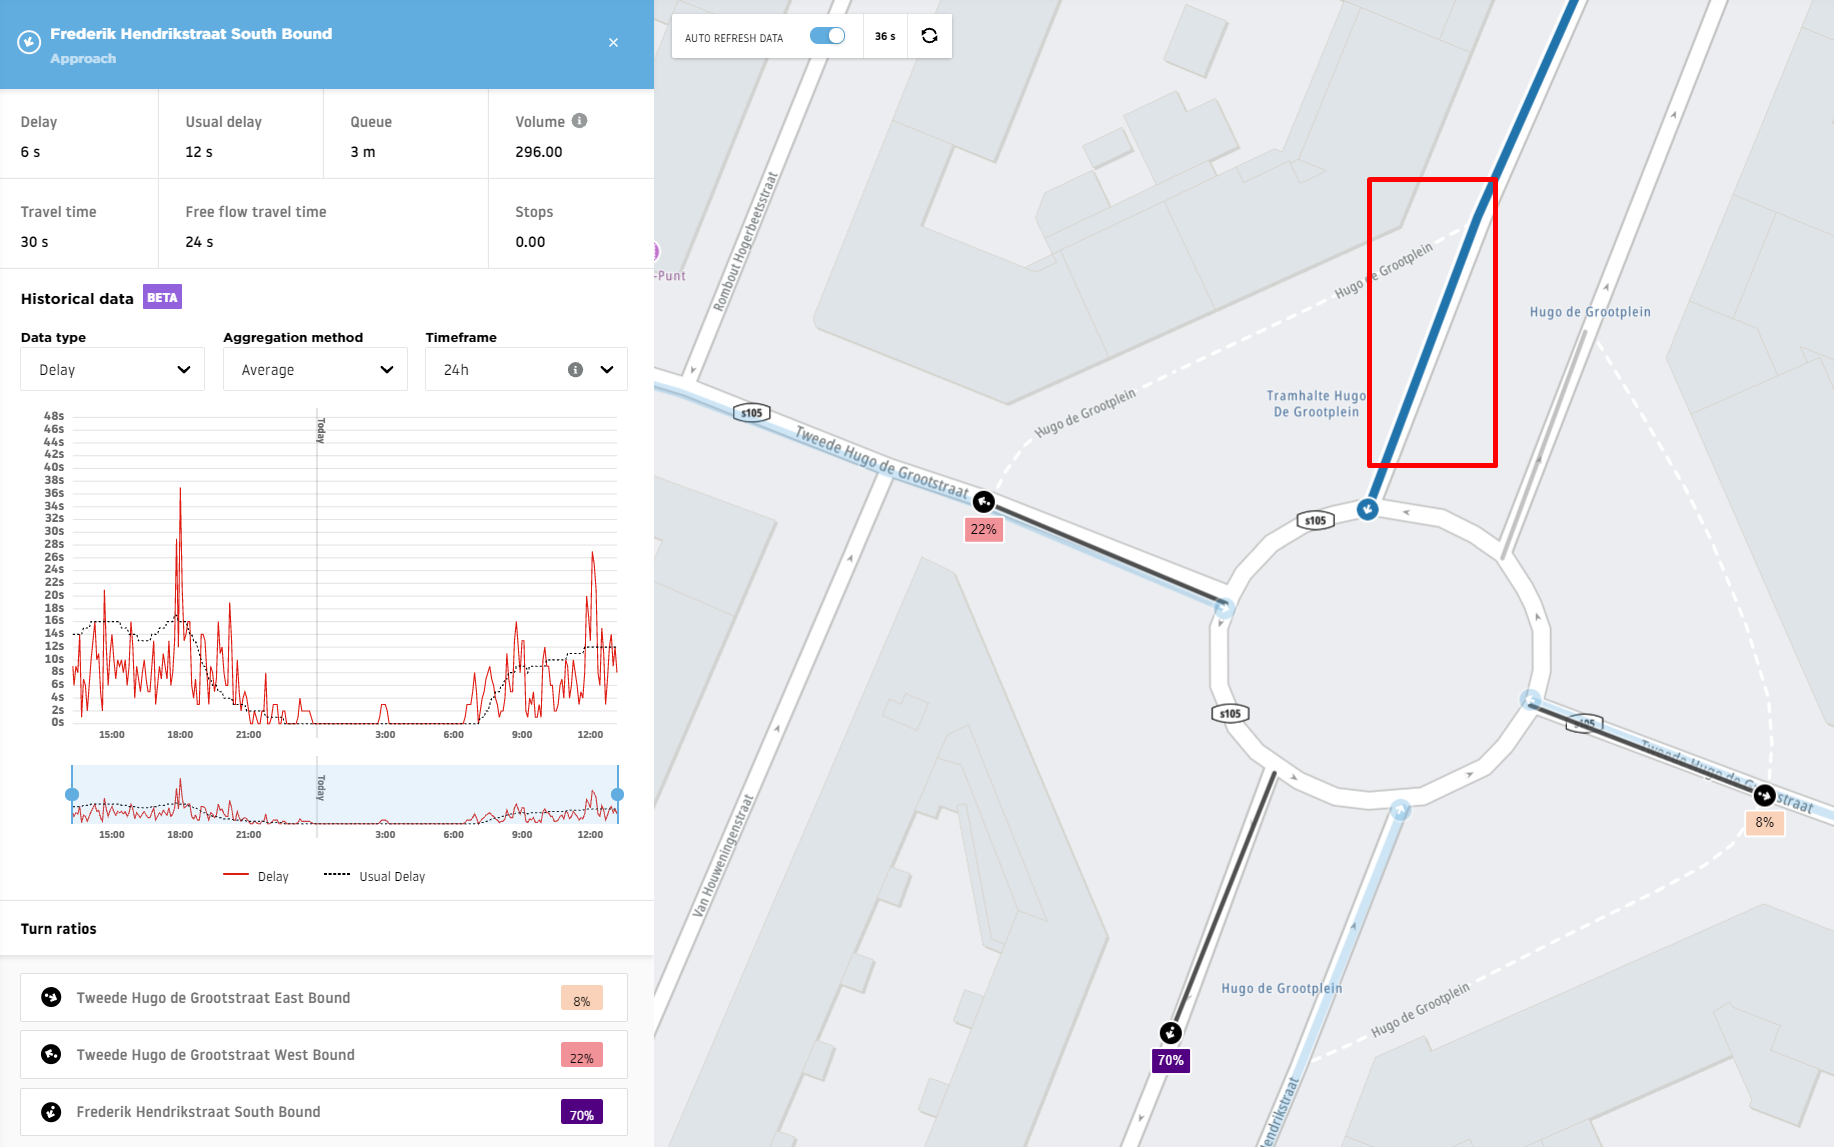
You will then be taken to the junction results screen. Here, you can see the junction approaches on the map as lines and arrows.
There are two ways to view the results for each approach.
The first way is to click each approach directly from the Approaches panel on the left. Selecting an approach loads all of its details.
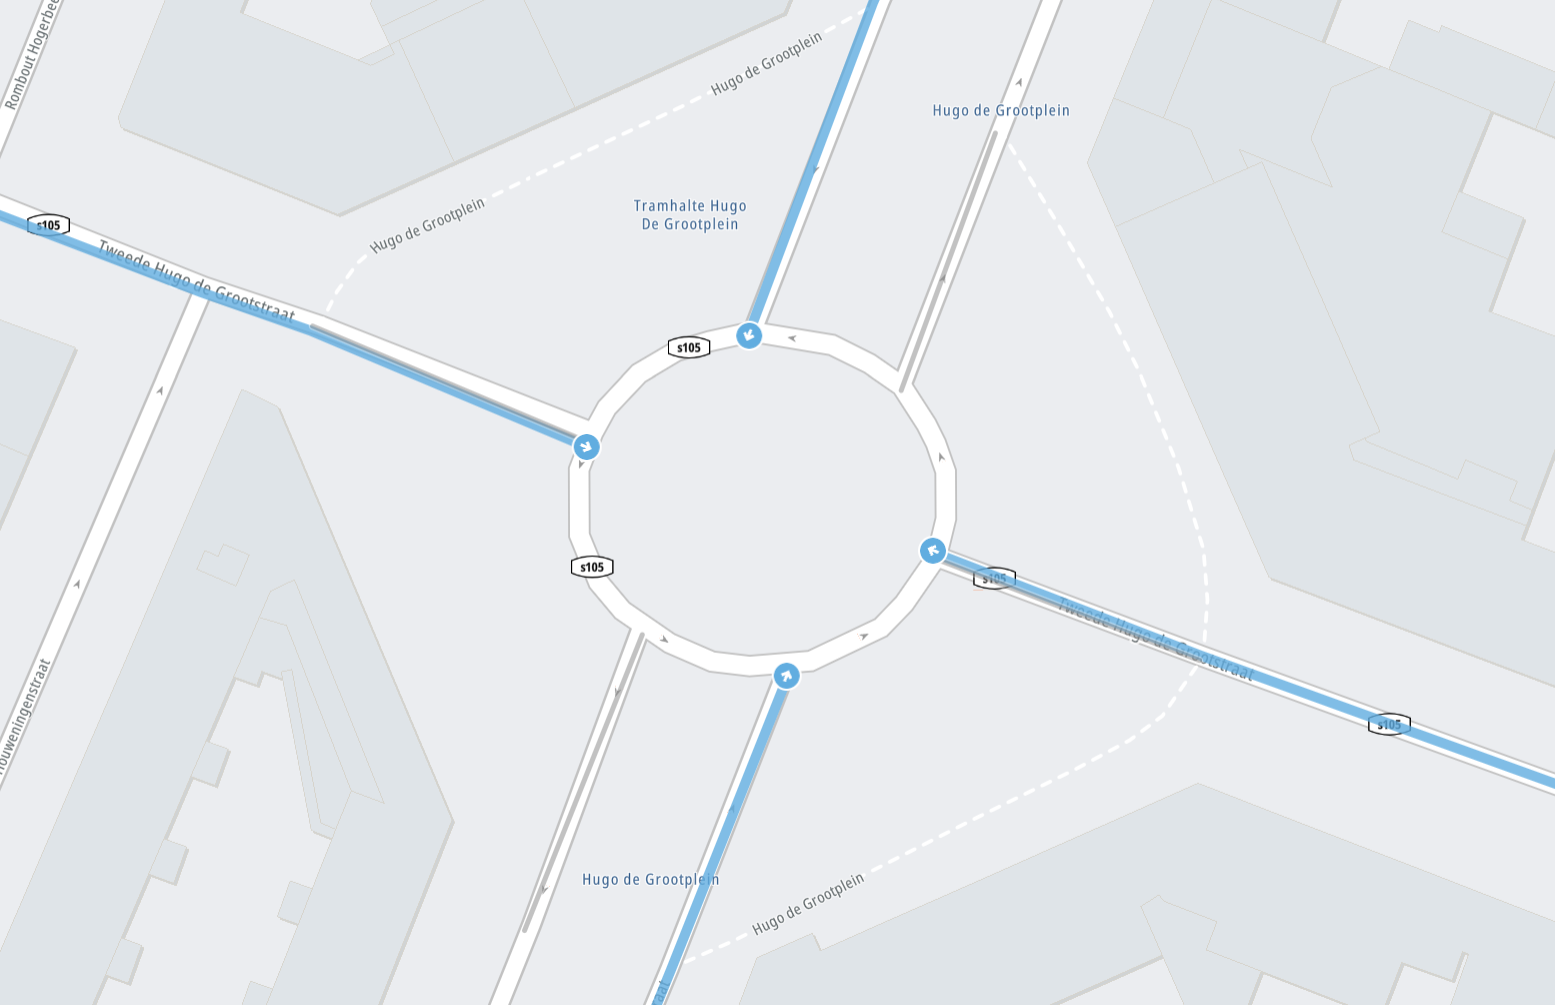
The second way is to choose an approach directly from the map. When you zoom in, you can differentiate each approach on the road network. You can click any approach line to load all its details, just as with the first method.
Junction results data
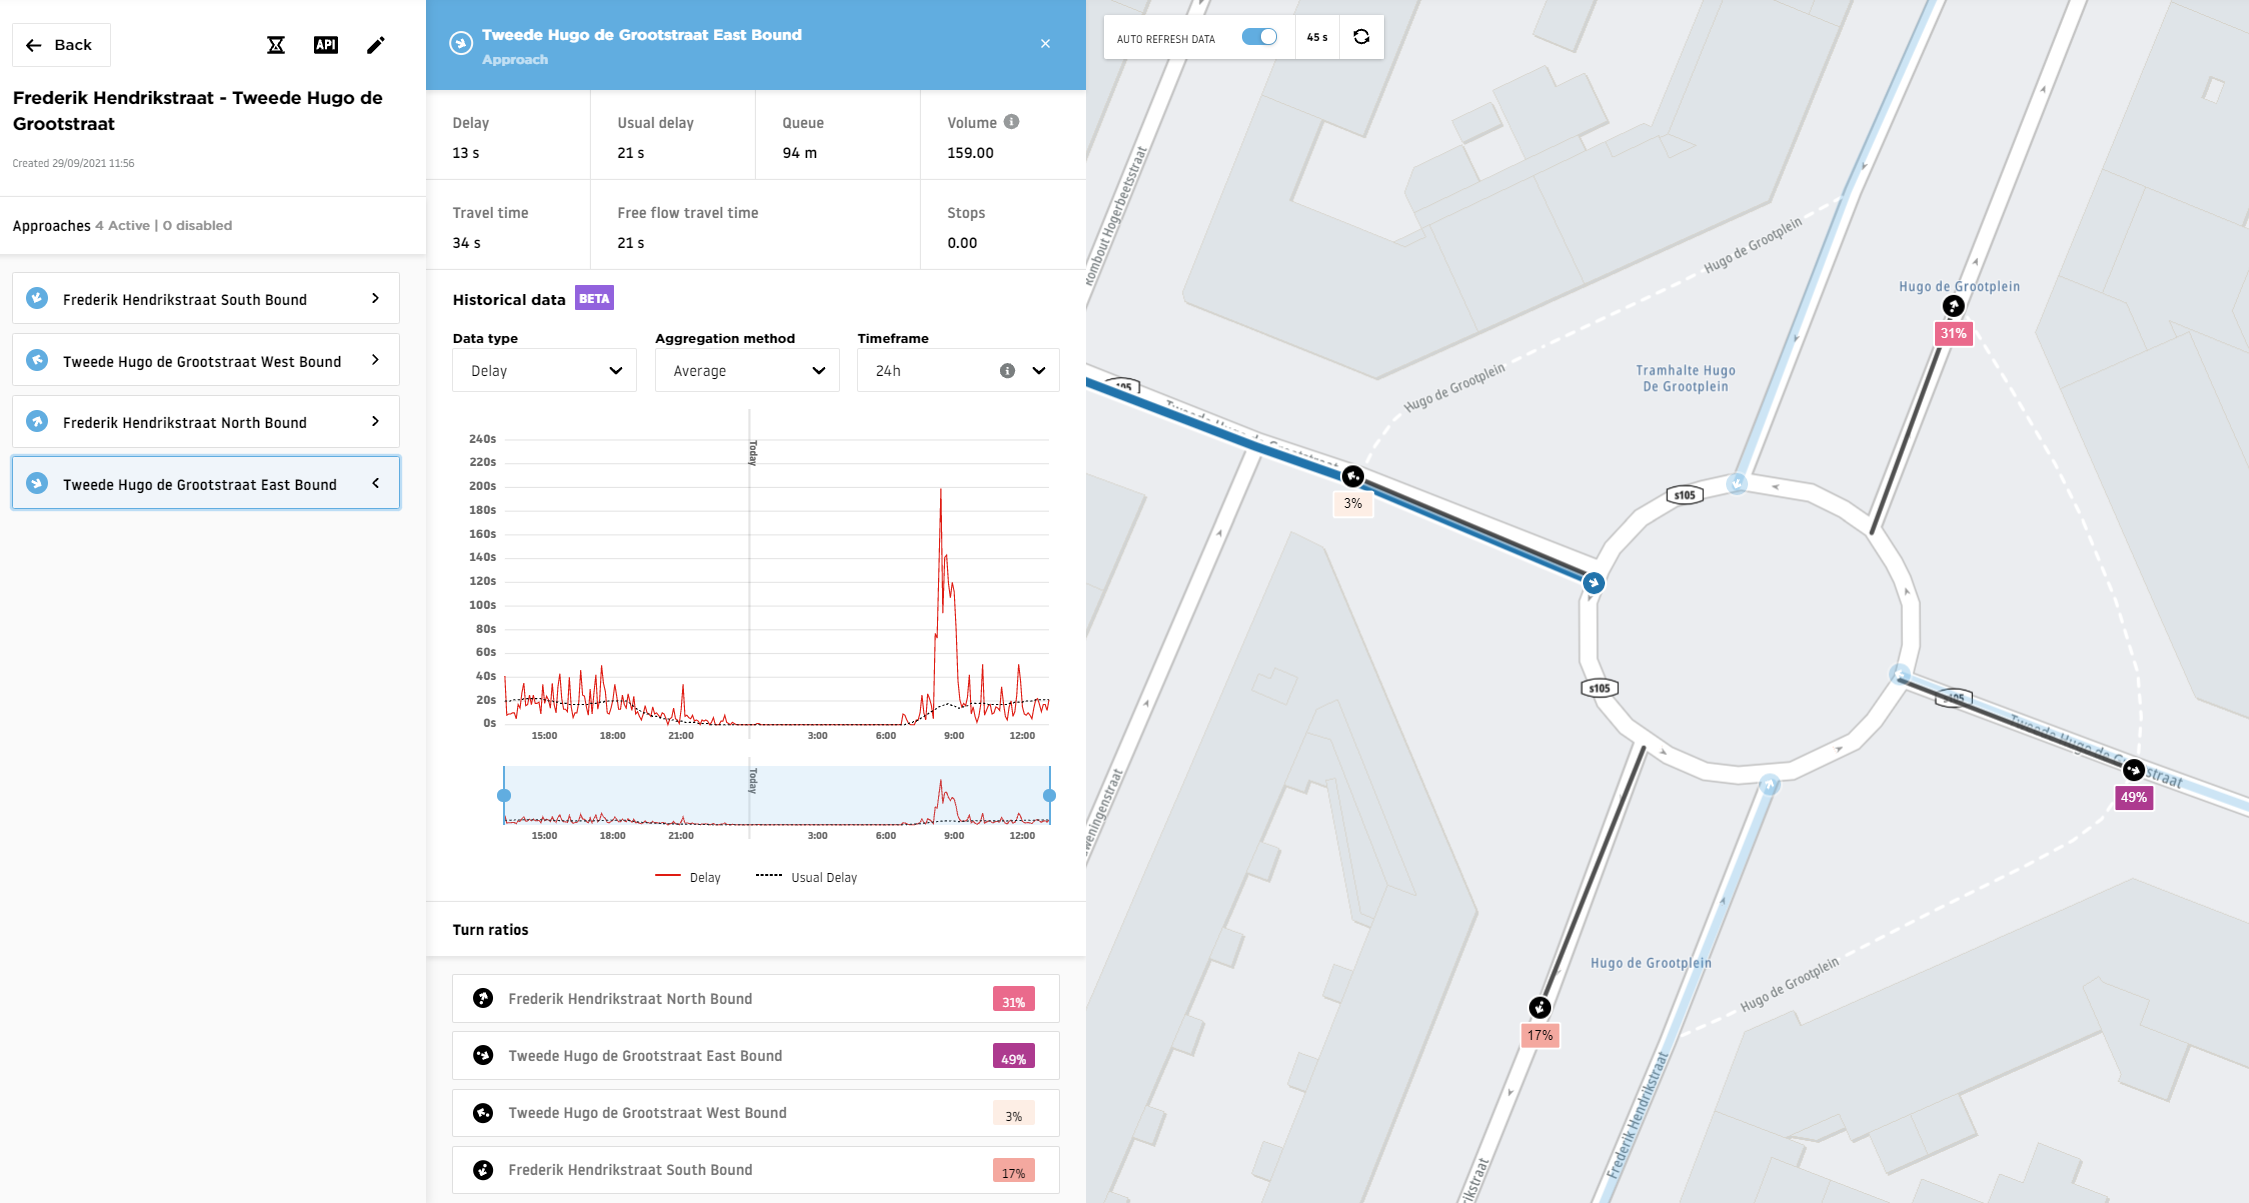
Each approach contains the following information:
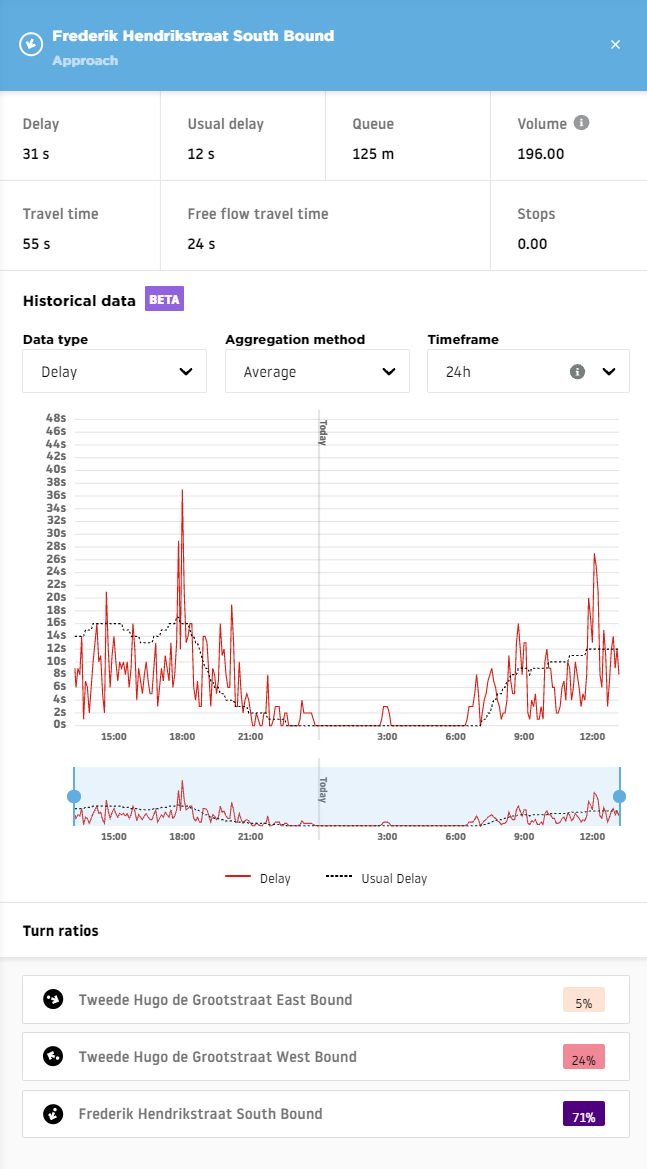
- Delay: The current delay (in seconds) for the entire approach.
- Usual delay: How long (in seconds) it usually takes for drivers to leave the junction after stopping.
- Queue: How long (in meters) the current line of waiting vehicles is on the junction approach.
- Volume per hour: An estimated value of how many vehicles travel through the approach per hour. This is an experimental feature that might have a large error margin. Please use it at your own risk.
- Travel time: How long (in seconds) it currently takes for vehicles to travel through the approach.
- Free-flow travel time: How long (in seconds) it takes for vehicles to travel through the approach during free-flow conditions (e.g., when there is no traffic at night).
- Stops: The average number of stops per vehicle on the approach (calculated from all probes in the last 15 minutes).
- Historical data: A chart containing all the stored historical information for this approach, gathered from the moment the junction was created or edited in the tool. Historical charts offer three different timeframes: 24 hours, three days and eight days.
- Turn ratios: Information about the percentage of vehicles taking a turn in a specific direction while leaving the approach. Calculated based on observed turns in the last 30 minutes, normalized by the sum of all probes passing this approach.
- Accumulated probes: Information about the number of vehicles observed on each approach in the last 30 minutes. This value is located on the graphs and it is possible to view it in 5-minute / 15-minute / 1-hour parts. Keep in mind that the data is measured for the last 30 minutes before the time selected on the graph, so for example, when 14:05 is selected, the number of probes displayed is showing a value for the 13:35 - 14:05 period.
Important Note! The historical data chart is affected by any geometry change in your junctions. Once you update the junction geometry, the charts will reset and the data will be saved from the point of the update.
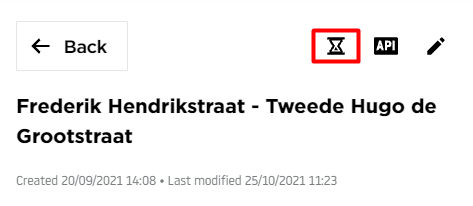
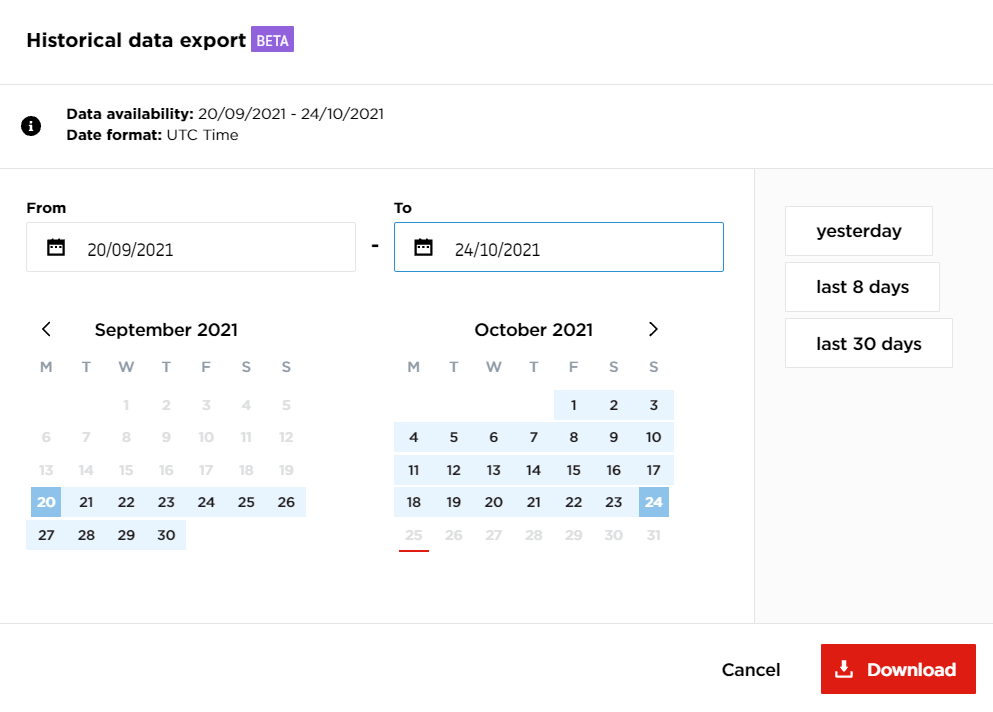
The Historical data export option allows you to download a .zip archive with all the data stored for your junction for the last six months.
The files from the historical data export are based on the UTC timezone.
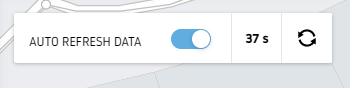
Data for each junction is refreshed automatically every 60 seconds, but it is possible to disable the automatic refresh and update it manually by using the Auto refresh data switch.
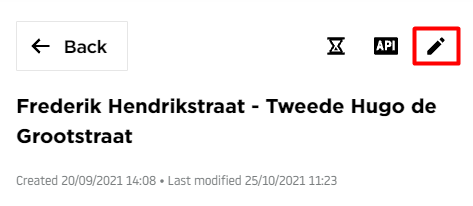
To edit your junction geometry, you need to click on the Edit pen button which is located above the junction name.
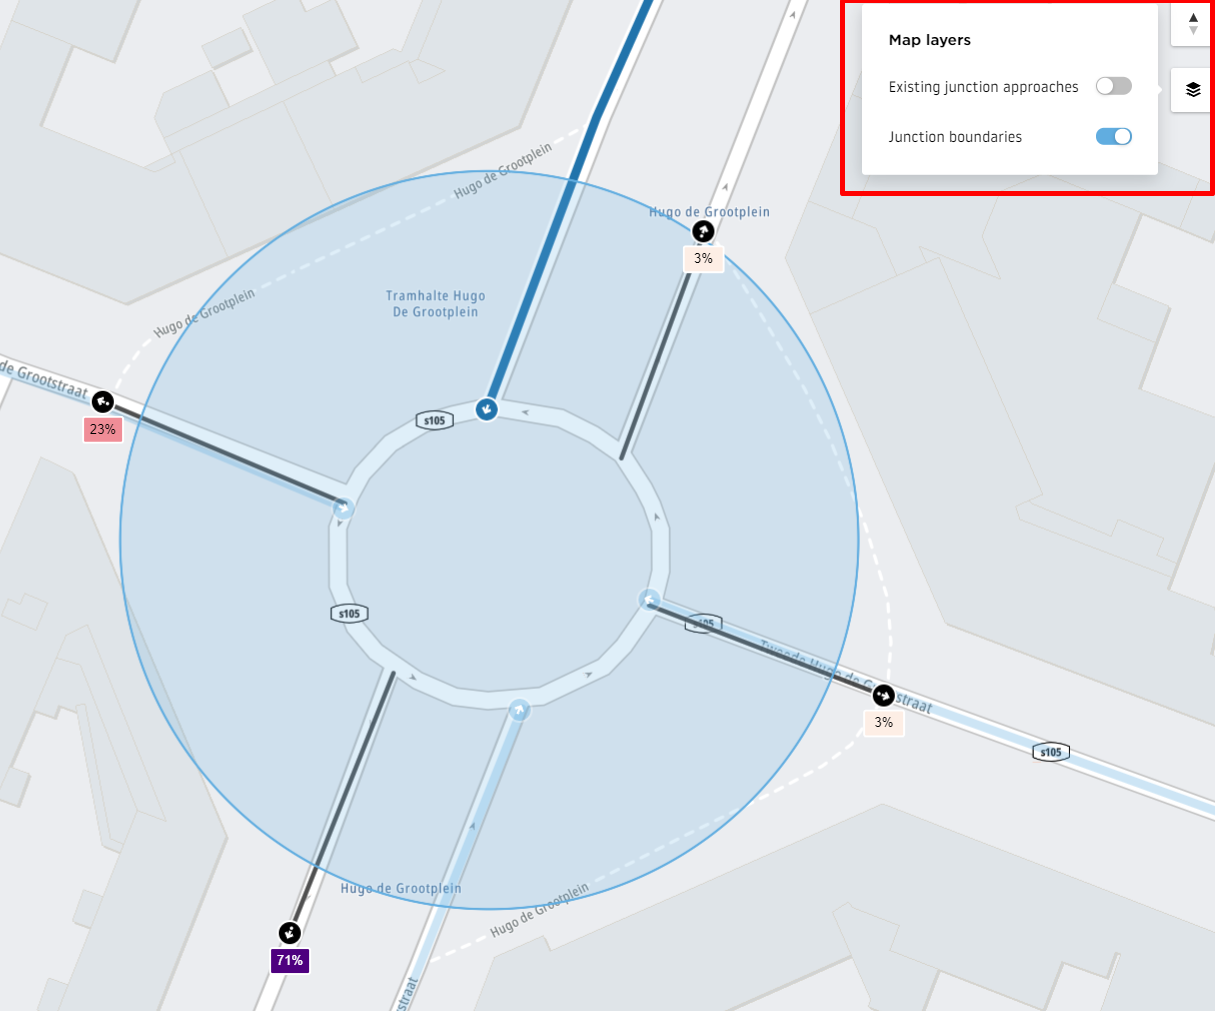
It is also possible to display the boundaries you defined while creating your junction and show the existing approaches of your other junctions on the map by using the map layers in the upper right corner of the map.