Creating a report
Creating a report is a simple three-step process: define the area, select the date range and specify optional parameters like the report name and the data to analyze.
Step 1: Defining the Area
As in other TomTom Move applications, you can add geometry to the map in two ways.
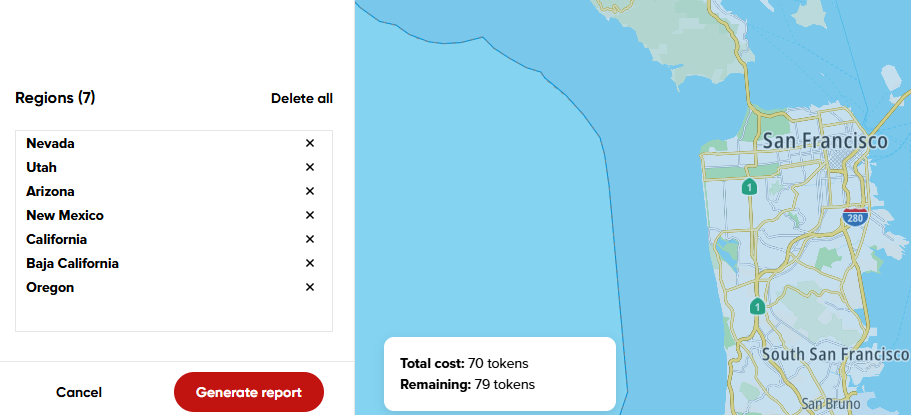
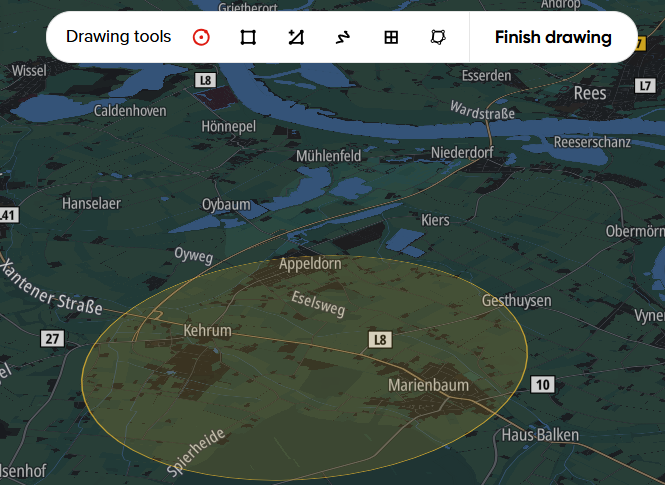
First, you can draw the area manually. Find the location you want to analyze (for example, Amsterdam) and use the drawing tools to outline the area. Each geometry you draw is a region. You can rename regions for easier identification in the results, which is especially helpful when you have multiple areas. You can only define region names before requesting the report.
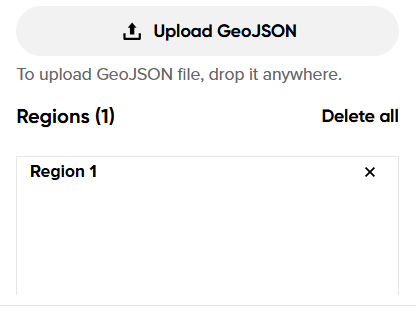
Second, you can upload a GeoJSON file. Use the Upload GeoJSON option to import the file from your device. The area is automatically added to the map based on your file's configuration. Region names are automatically adjusted if the file provides the name property for each geometry feature.
Step 2: Selecting the Date Range
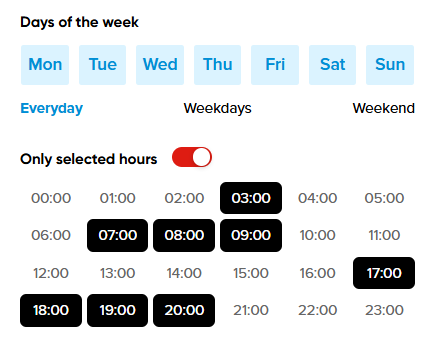
Select the timeframe for the data you want to retrieve. Use the date range selector to define the start and end dates.
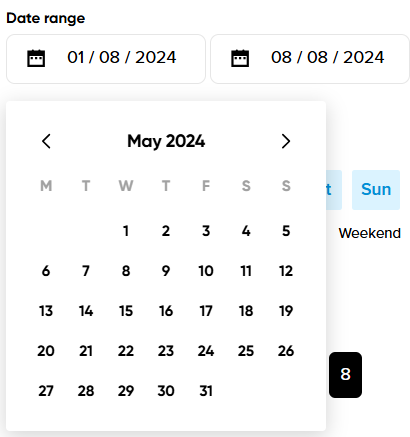
The default configuration includes whole days in your analysis, but you can also focus on specific hours by enabling the Only selected hours toggle. This is the optimal option for a more detailed, hour-oriented analysis. It uses a multi-choice mechanism, meaning you can select different hours of the day simultaneously to aggregate your results. Limiting the hours in your report does not lower token consumption, as one token represents 24 hours within one day. To optimize token consumption, we recommend choosing the whole day of data and performing further analysis through the CSV data export.
Step 3: Additional Report Configuration
Before requesting the report, you can define two optional settings.
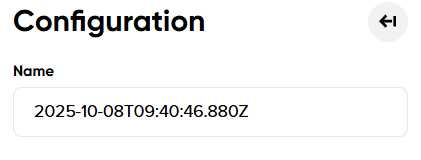
First, you can name your report, which is helpful for identifying it in the report list. By default, the report is automatically named based on its creation date and time in Coordinated Universal Time (UTC).
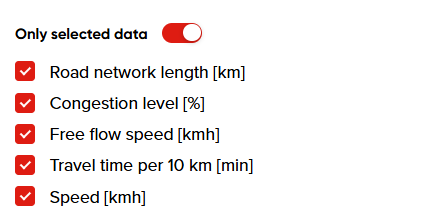
Second, you can filter specific data points. The Only selected data toggle allows you to select which information to include in your report. You can disable any data point that you are not interested in.
Once all parameters are set, you will see the token cost of your report. If you have sufficient tokens, you can select Generate Report. The backend systems will process the analysis and it will be ready for review. The processing time depends on the report's size and complexity, but it usually takes only a few seconds to a few minutes.