Selected link analysis
This type of analysis calculates the trip distribution, both inbound and outbound, of all the trips on the consecutive road segments within 5 to 50 kilometers from the link selected by the user.
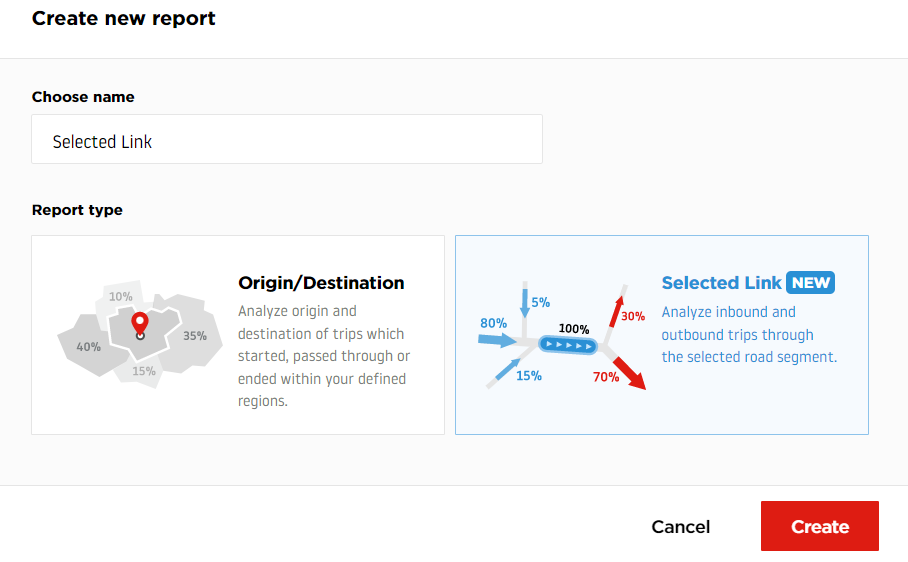
You choose it in the new report dialog, where version 2 presents the two report types as cards rather than as radio buttons. Selecting the Selected Link card and confirming the report name opens the creation page.
Date and time ranges
Date and time ranges are defined in their own sections of the left panel, exactly as in a Flow Matrix report. You can learn more about it here:
A trip is assigned to the range in which the link entry, or the region entry or exit, occurs. A report that contains more than one time range additionally offers time series charts in the results.
Choosing the geometry
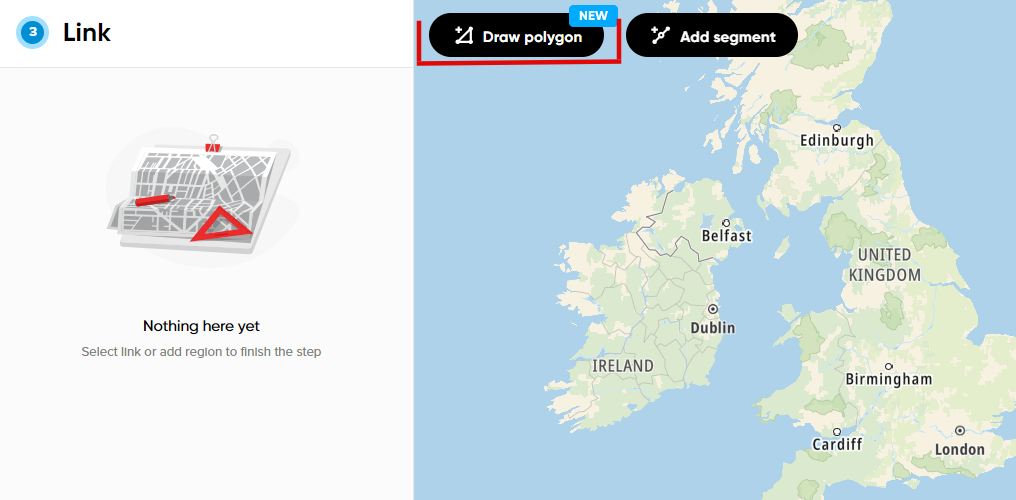
A Selected Link report analyzes either a road segment or a region, never both. While the Selected Link section of the left panel is still empty it offers the two choices directly:
- Add segment switches the map into the road segment selector.
- Draw polygon switches it into the region selector.
The rest of the section then depends on which of the two you picked.
Selecting a link
The map view lets you select the road segment, which we also call a 'link', that is used to calculate all the inbound and outbound trips.
To select the link, it is necessary to go to a specific location and zoom in to see the road network segments:
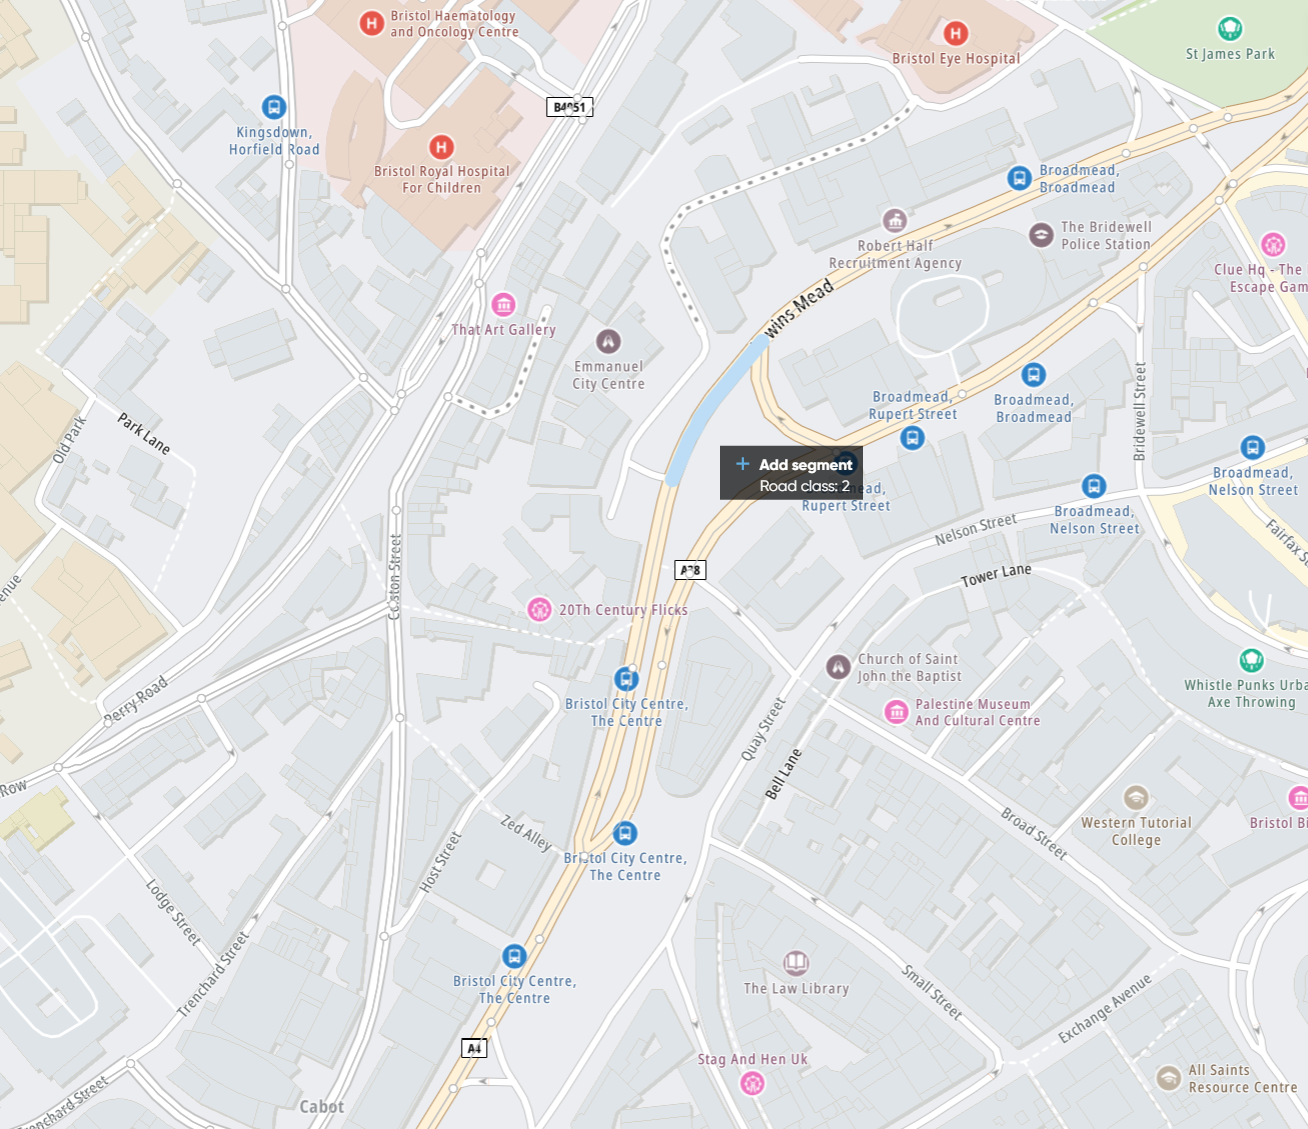
Which segments can be clicked depends on the map: on the Orbis map all functional road classes are selectable, while on the legacy Genesis map local roads of minor importance (FRC 7) cannot be selected for privacy reasons. Orbis is the default map for new reports.
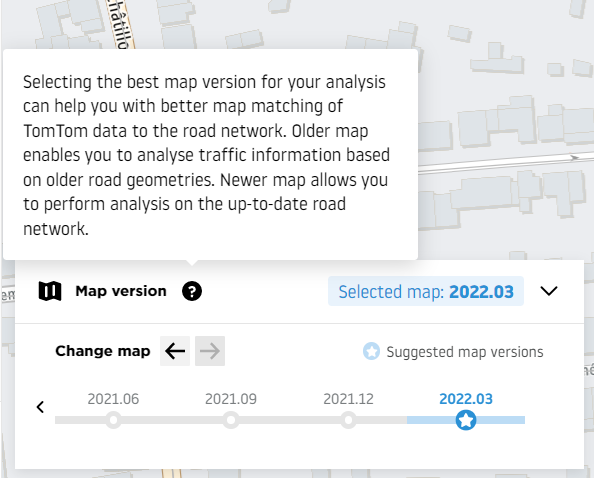
Before choosing a road segment to analyze, it is possible to adjust the Map version of the visible segment network. By default, the tool always selects the version related to the analyzed date range used in the analysis, but it is always possible to change it if needed.
Changing the map version might be useful when comparing different analysis results in case there were some map geometry changes caused by local roadworks.
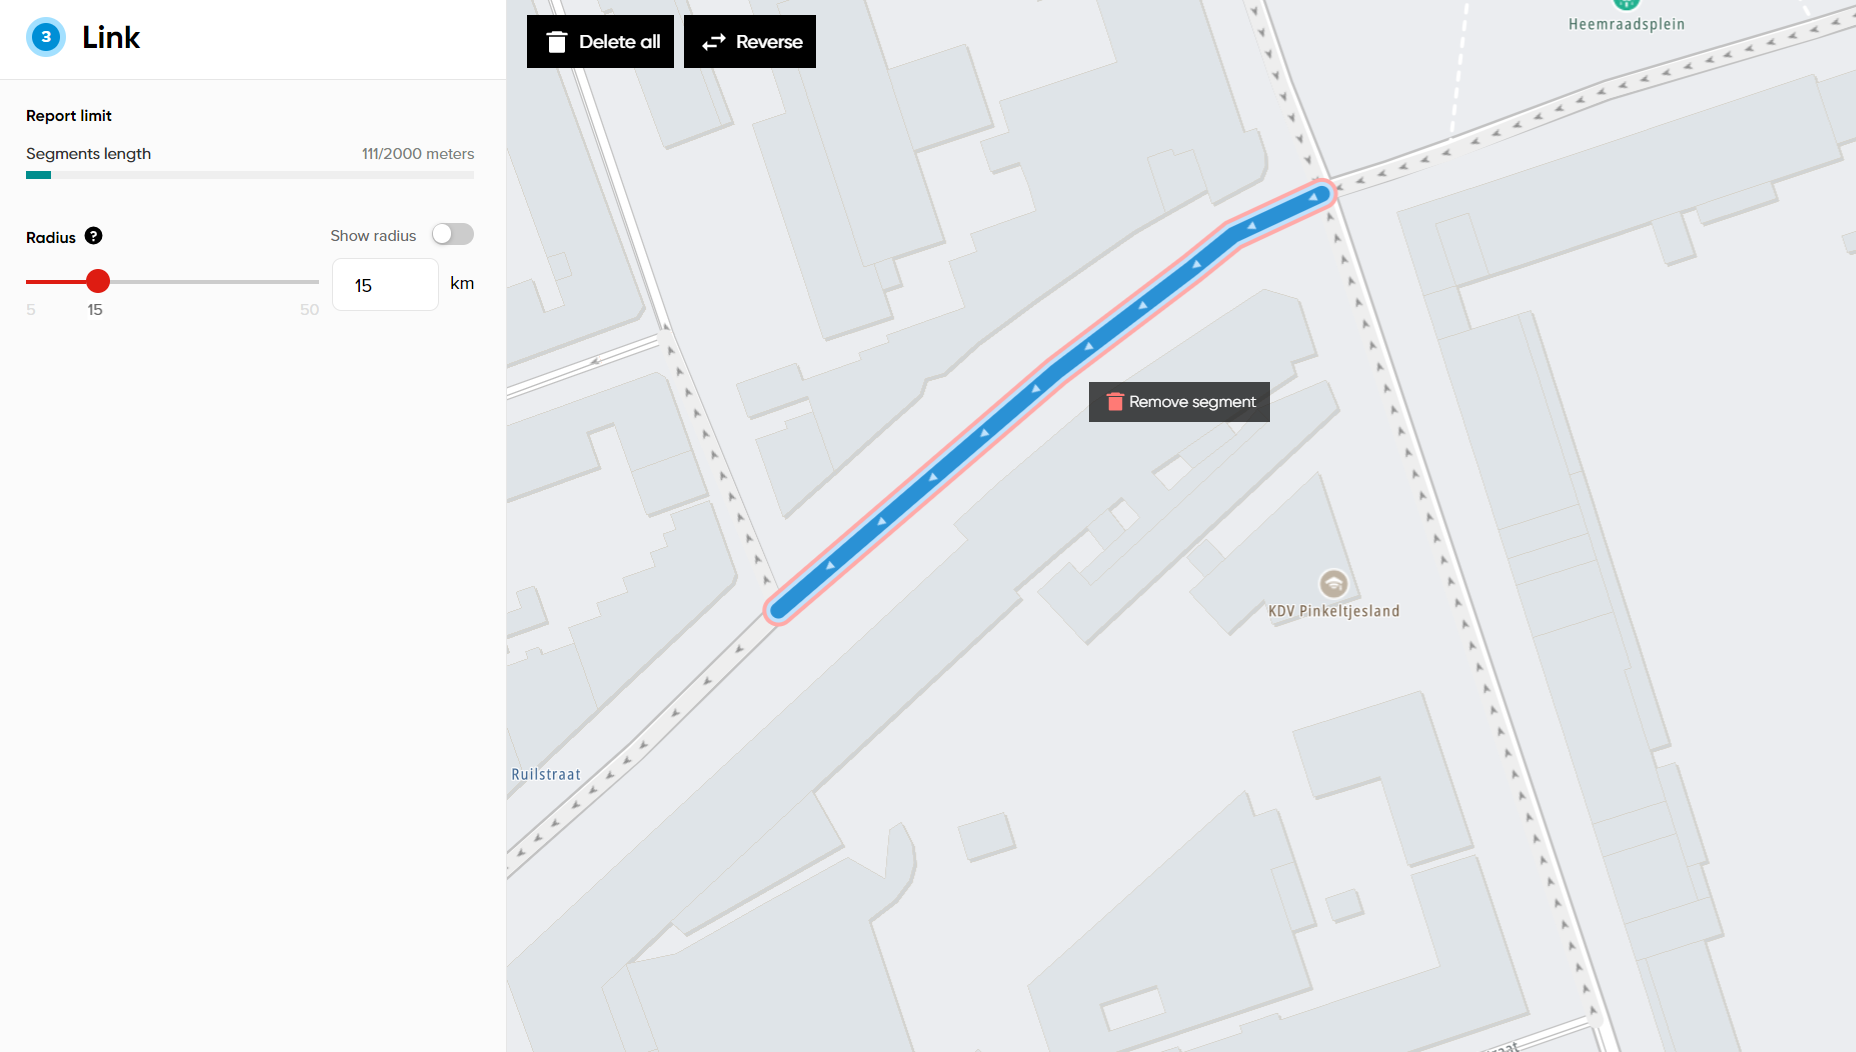
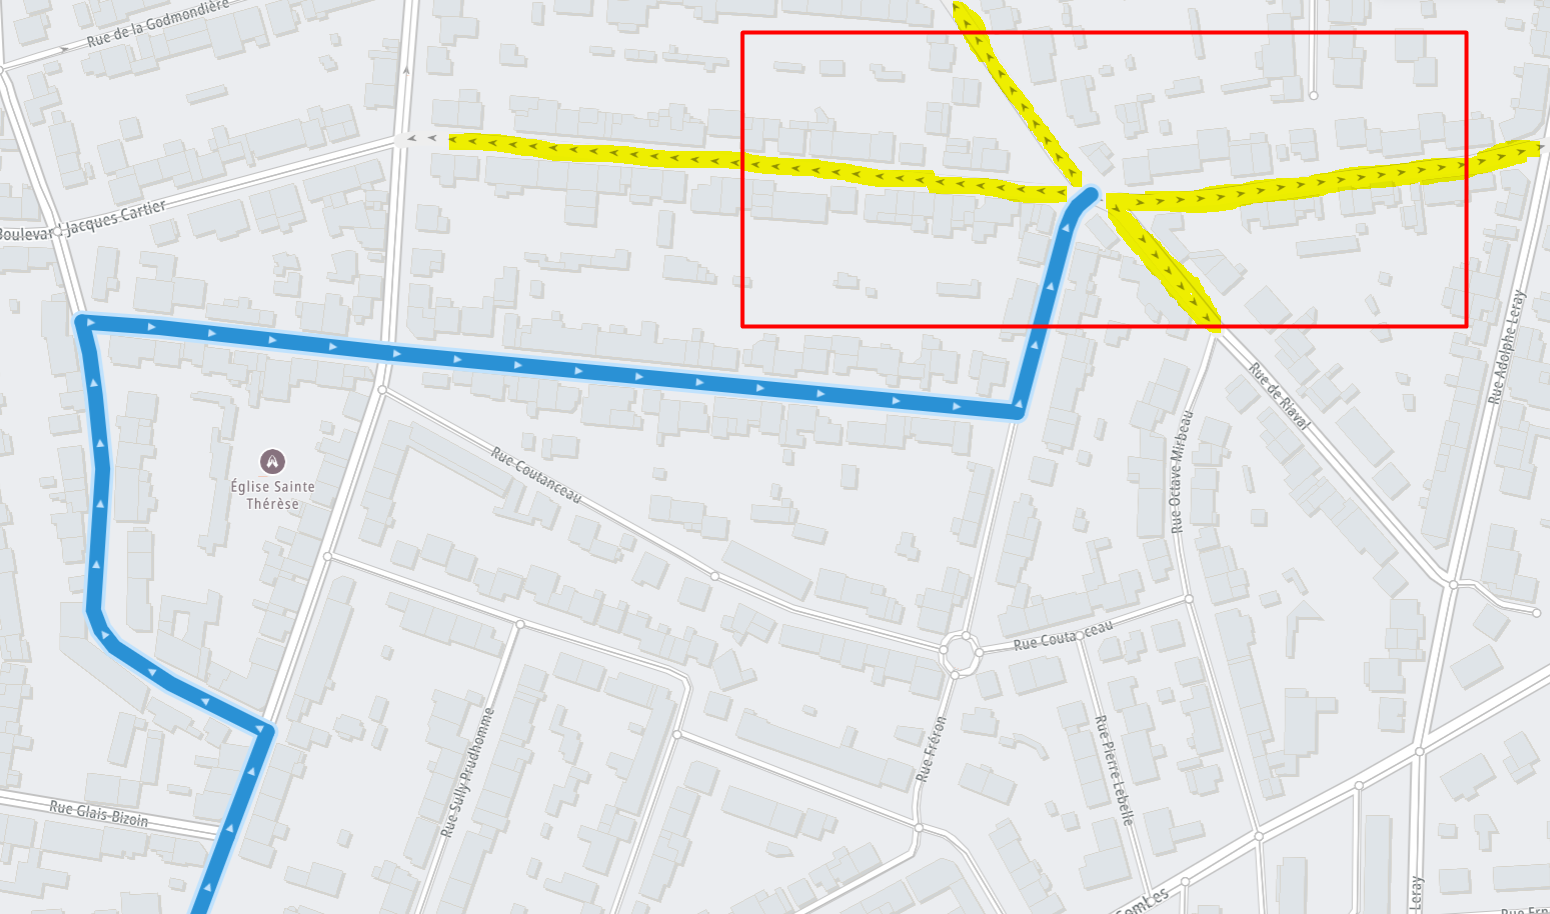
Once the road segment is selected, it will be highlighted and arrows should appear on the adjacent roads. The arrows show the direction of the trips and roads that are going to be analyzed.
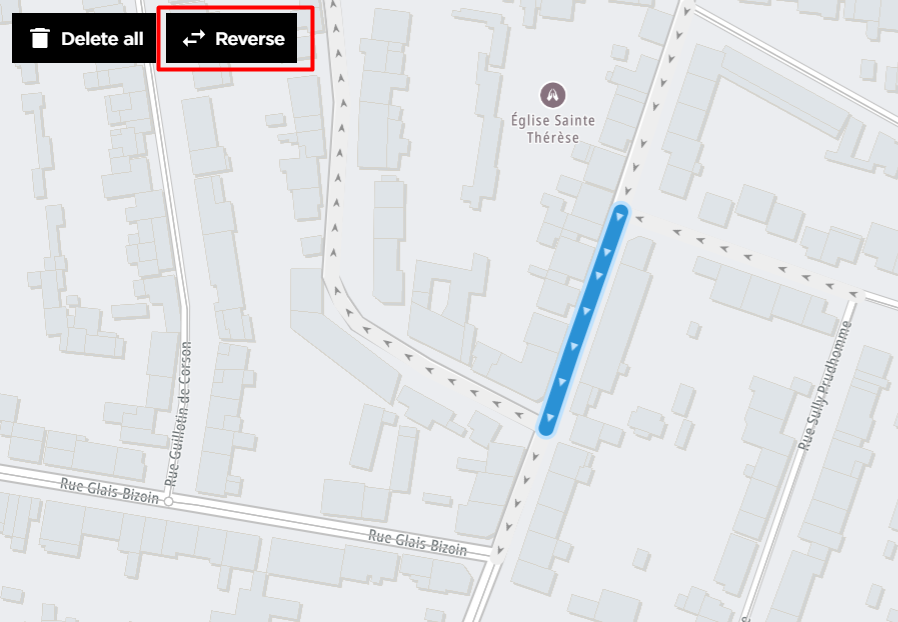
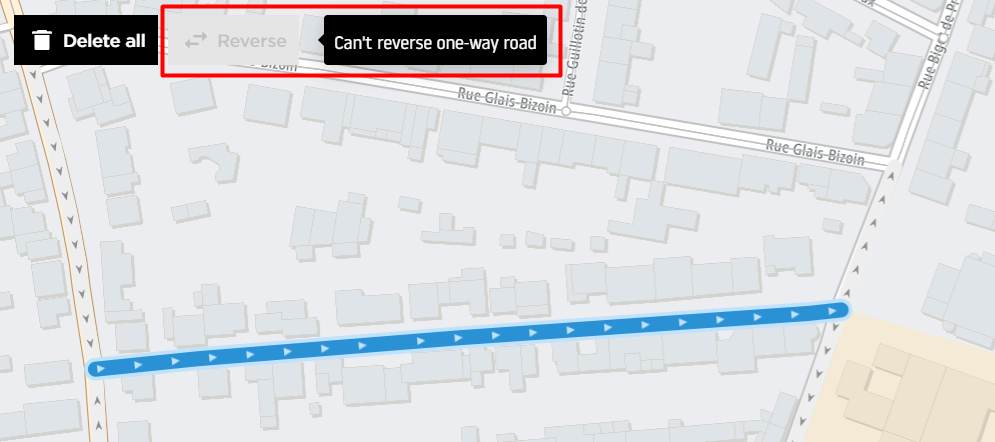
In the case where the analyzed road is bi-directional and the user wants to analyze the opposite direction, it is possible to use the Reverse button to change it. If the road is one-directional, the button will be grayed out.
To help with more complicated use cases or when the user wants to analyze the trip distribution for a specific route, it is possible to select more road segments by just clicking them on the map.
The limit of all the selected road segments' length in a single report is 2,000 meters.
Important Note! If the link is longer than a single segment (multiple segments are selected consecutively), it's very important to remember that vehicles need to traverse the whole route to be included in the results.
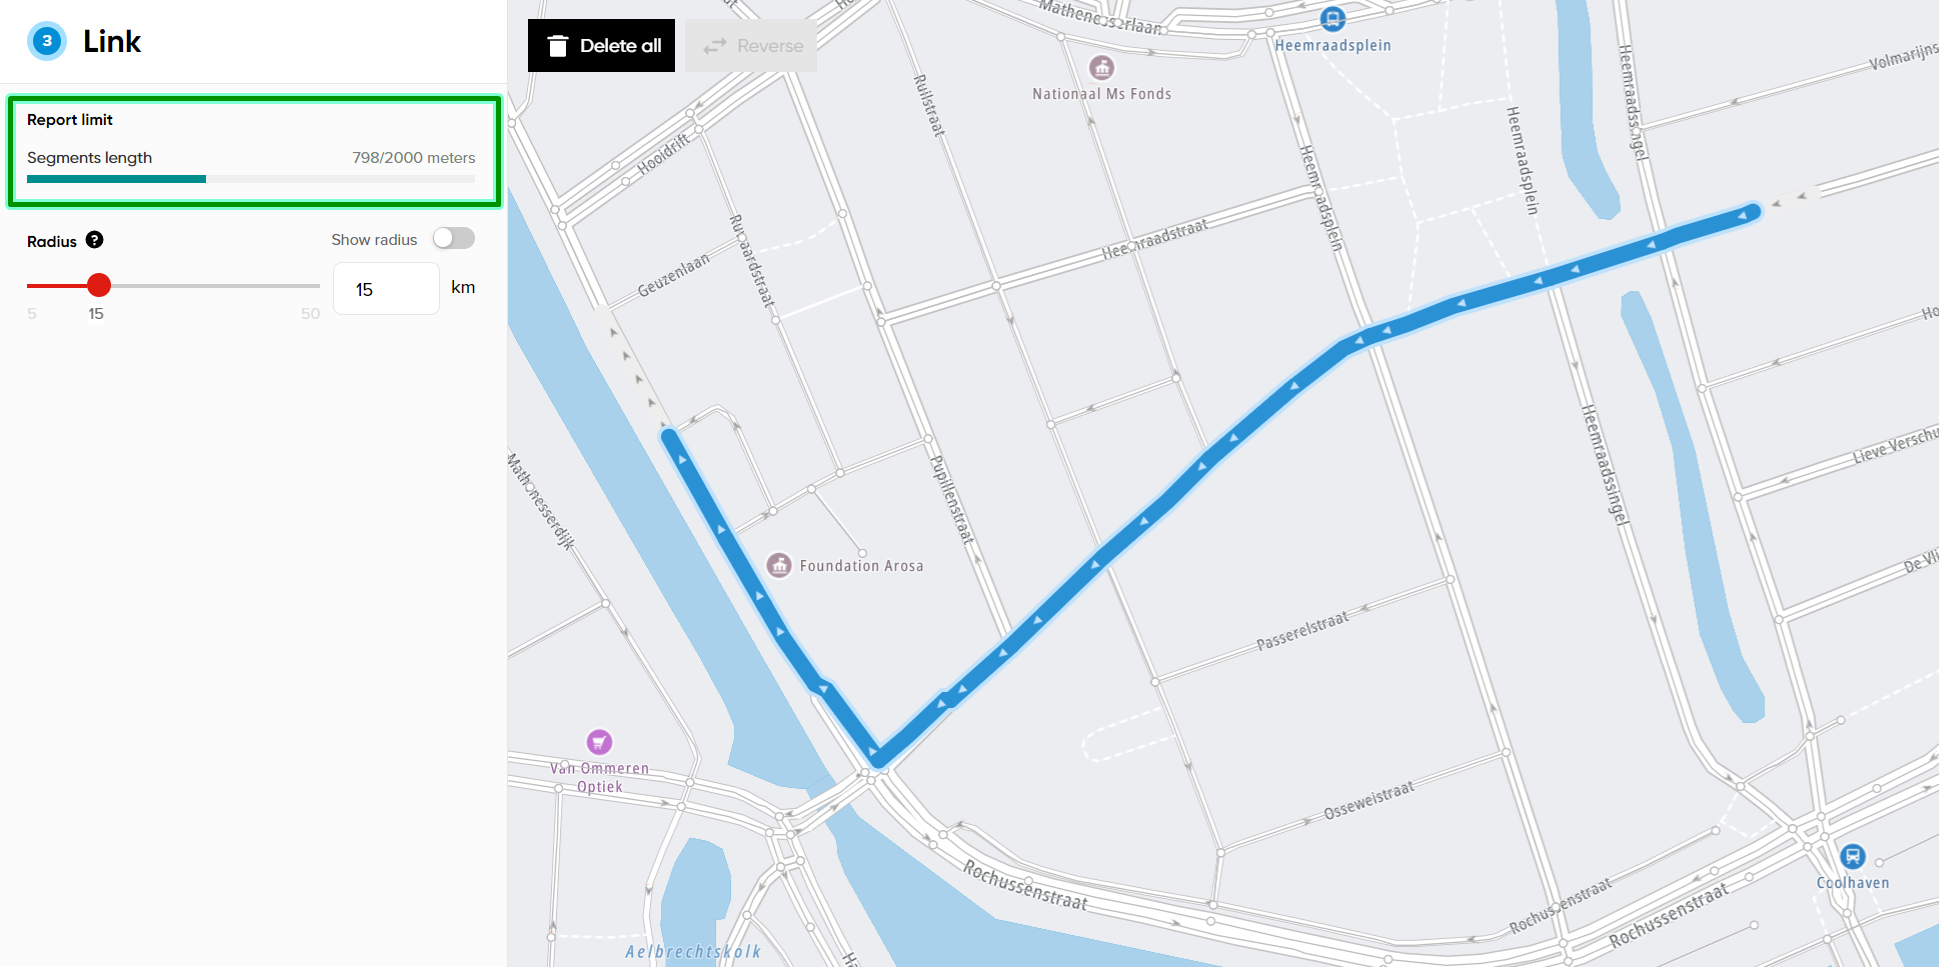
Keep in mind that it is only possible to select the segments that are located consecutively to the end of the selected route. The available ones are distinguishable by a line of arrows located on them. It is not possible to select routes that are going in multiple directions at the same time.
When defining a link, you are also able to adjust the radius of trips that will be analyzed in the report. The radius ranges from 5 kilometers to 50 kilometers and defaults to 10 kilometers. Any path extending beyond the radius is trimmed to fit within it, so increasing the radius allows analysis of longer paths while decreasing it limits the analysis to a smaller area.
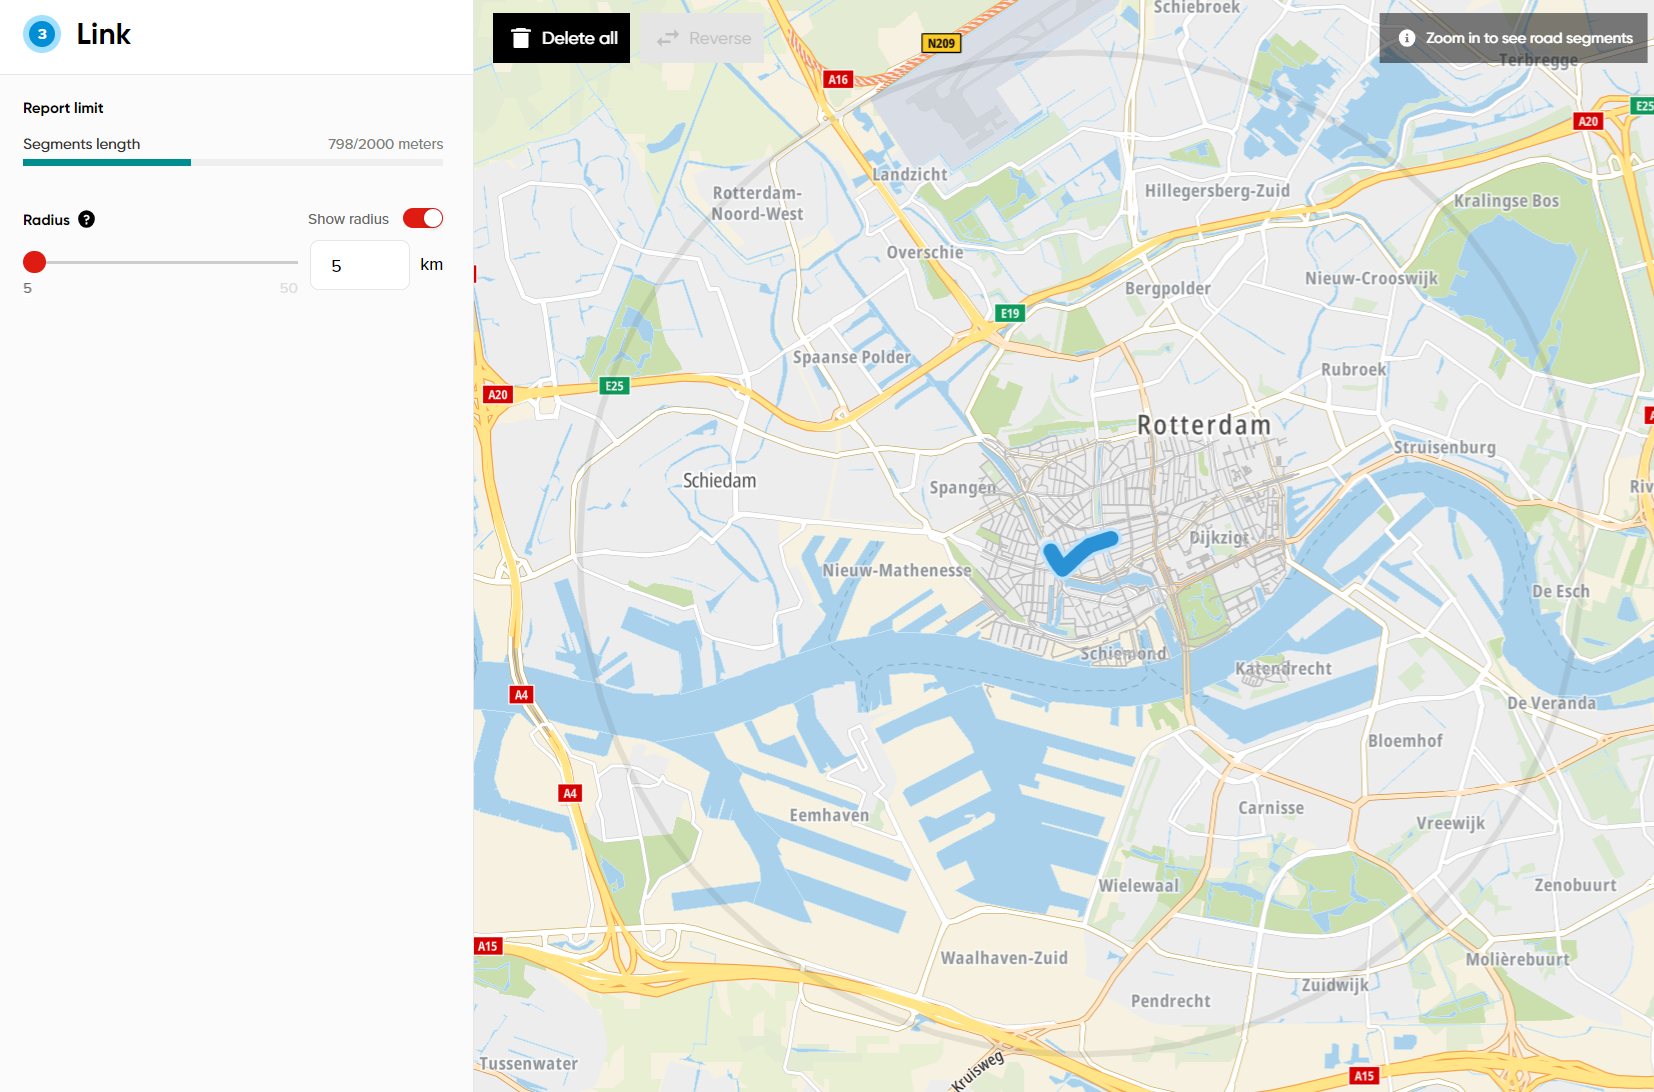
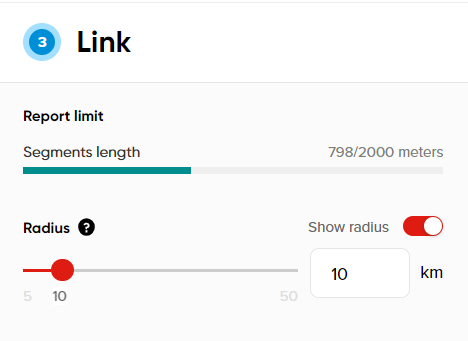
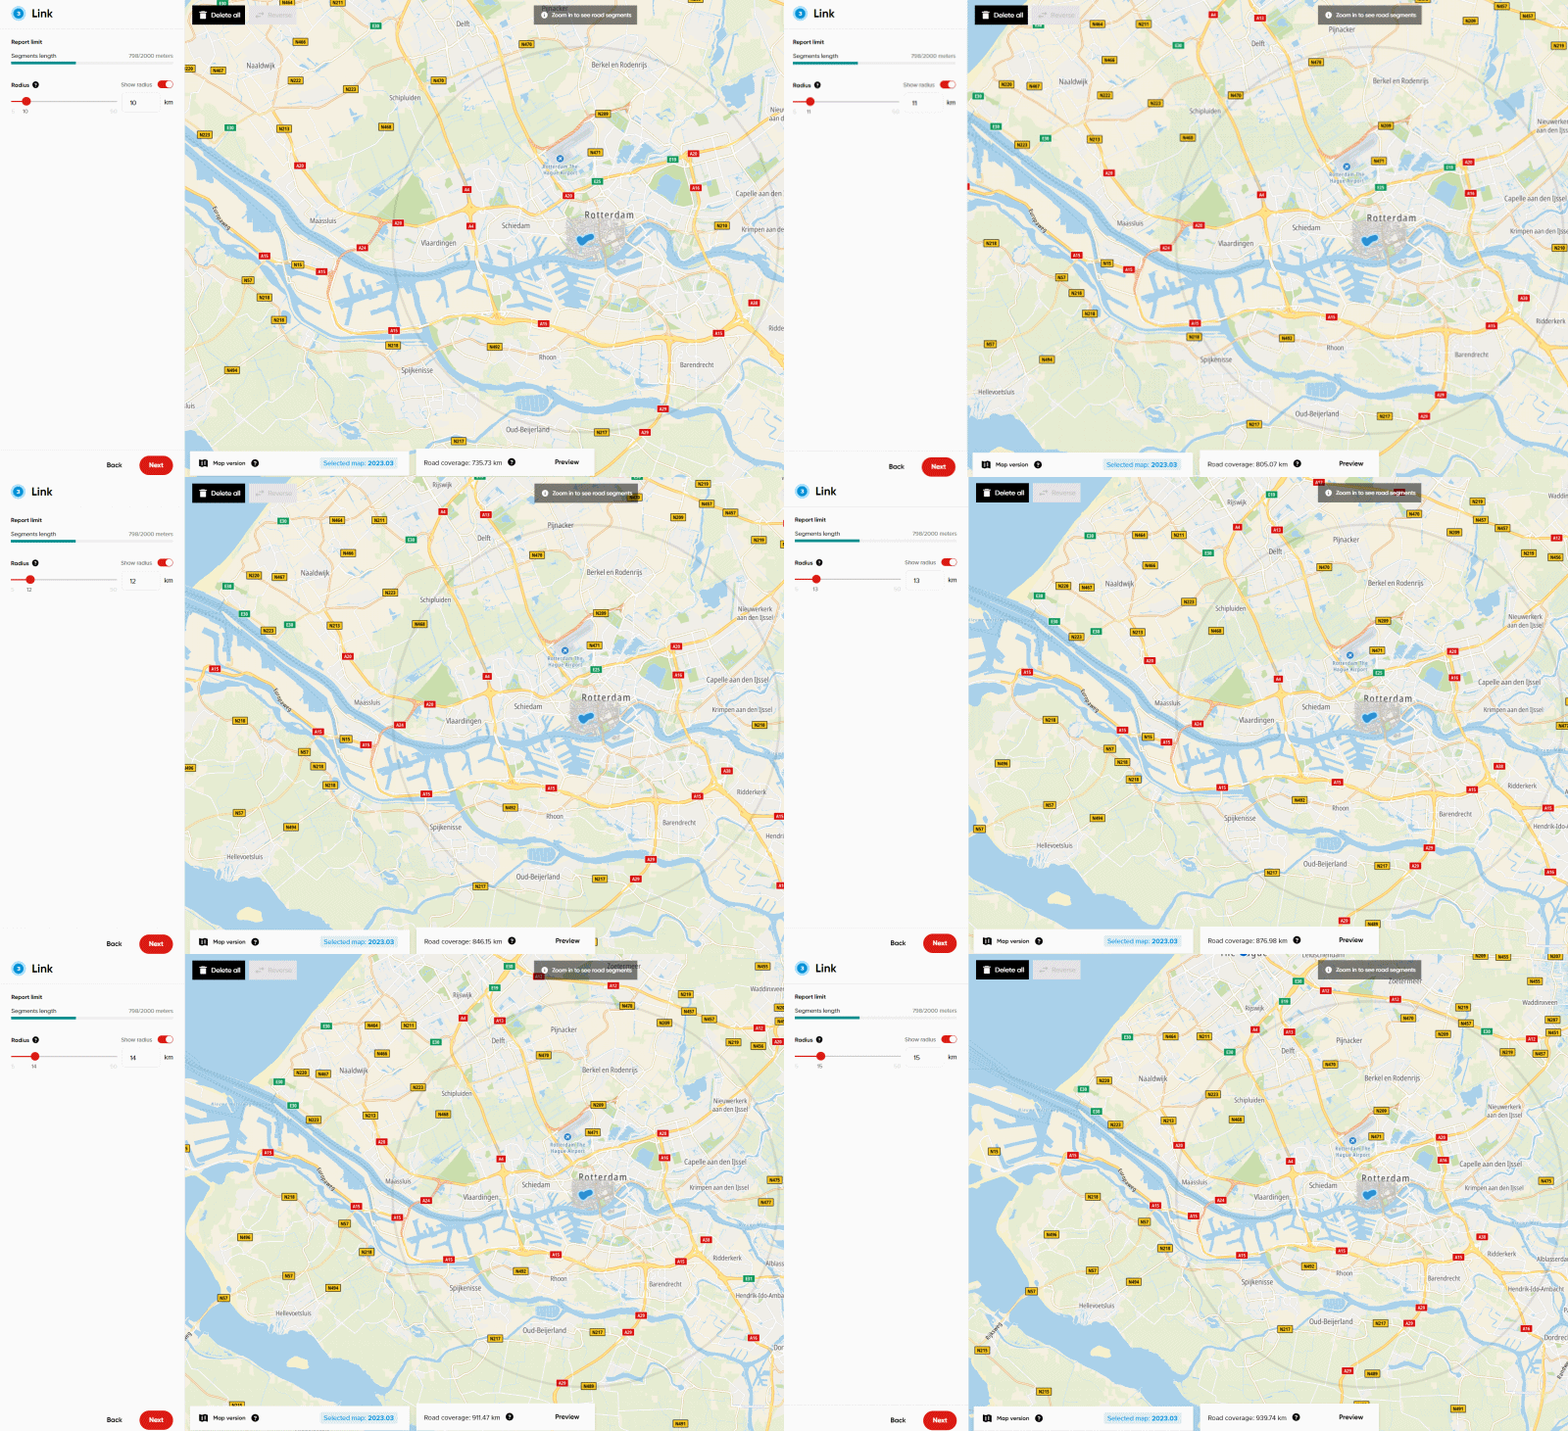
Changing the radius value will set the analysis specifications to calculate only the trips within the boundaries of that area. To better understand the size of our radius, please enable the Show radius option, which will visualize it on the map.
Analyzing a region
Instead of analyzing the incoming and outgoing trip patterns related to a segment of a road, it is also possible to analyze them based on a region of our choosing.
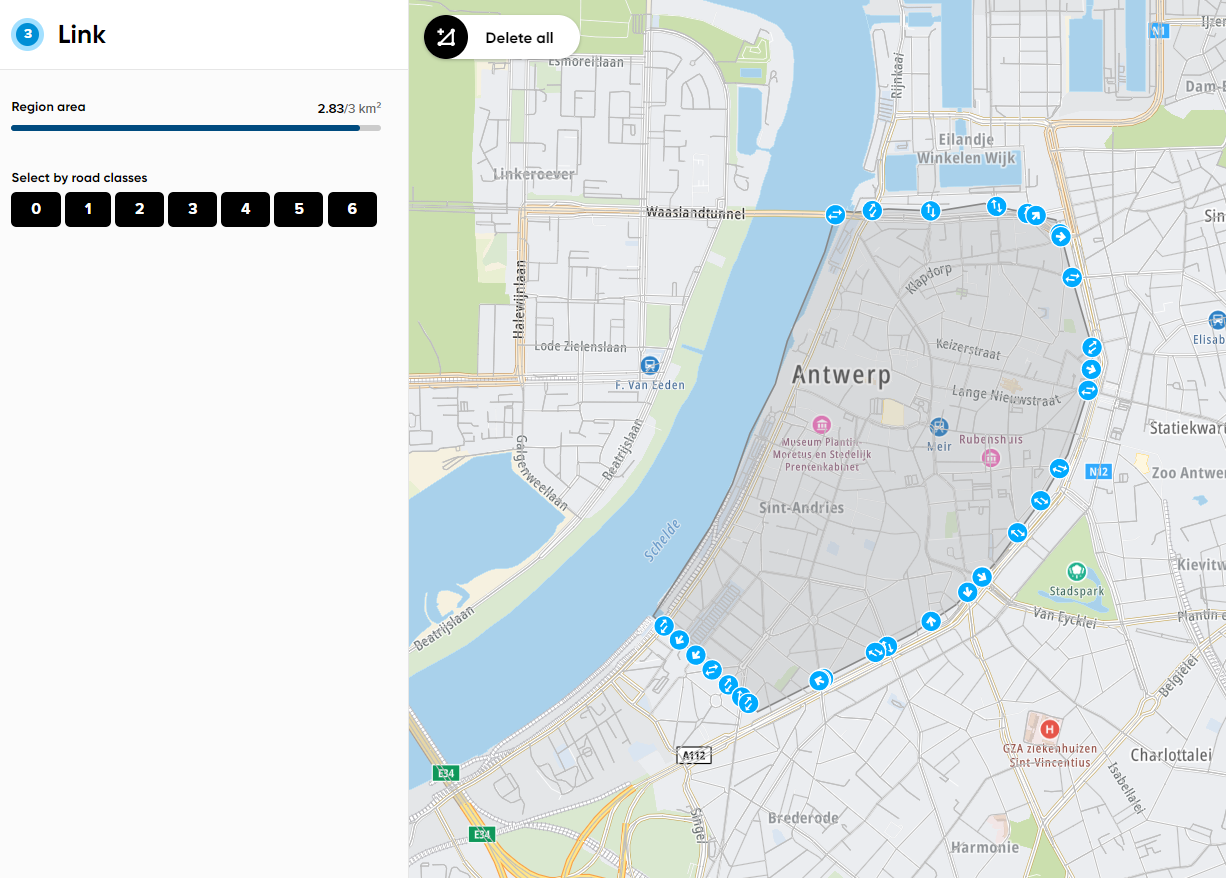
Defining this type of geometry is similar to defining a link, but instead of selecting segments on the road network, users have to click on the map to define points that will ultimately form a closed polygon.
The size of this polygon is limited to 3 km² by default; accounts can be granted a different allowance, and the section always measures the drawn polygon against the one that applies to you. The O/D Analysis product is currently optimized to handle this limit without affecting the performance of report calculations. Calculating all the trip paths entering or leaving our zone is more challenging and resource-demanding than calculating a regular Selected Link report. We will consider increasing this value in the future.
The radius used to calculate the actual trip paths is adjustable for a region as well, but its range is narrower than for a link: from 5 km to 10 km. The Show radius option visualizes it on the map, just as it does for a link.
Once the analysis polygon is defined, it's also possible to choose which road classes to include in the results under Select exits/entrances by road classes. Please note that this selection applies only to the entry and exit points of the polygon, not to calculating roads further away from our area on the road network.
Functional Road Class defines the road hierarchy: lower values are higher-importance roads such as motorways, higher values are local and residential streets. The available classes depend on the map, FRC 0 to 7 on Orbis and FRC 0 to 6 on the legacy Genesis map, and FRC 0 to 6 are preselected. At least one road class has to stay selected.
Enhanced metrics
Version 2 adds an Enhanced metrics section at the top of the left panel with two switches that extend the contents of the results.
- Travel time & distance adds the average travel time and the average distance driven from the selected link or region to each analyzed output segment. Together they also make it possible to analyze the average speed. This switch is on by default.
- Traffic volume adds an estimate of the actual number of vehicles passing through the selected link or the region entry and exit points. It is off by default. Traffic volume is based on statistical models and may differ from raw trip counts, and the striped areas on the map mark regions without traffic volume coverage. Turning it on requires the segment selection to be made on the volume road segment network, so any segments already selected have to be deleted and reselected first.
Pricing coverage
There is another important value that is shown next to the map version (on the right of it) which is called Pricing coverage.
The most important thing to know is that the Pricing coverage is not related to counting trips at all.
The only purpose of Pricing coverage is a reference to calculate the pricing. Pricing coverage in O/D Analysis is a buffer of roads that we take into consideration depending on the location of your analysis.
For the first 10 km of radius, this value is based on functional road classes from 0 to 5 (major roads).
For Selected Link reports with a radius bigger than 10 km from the link, Pricing coverage value is calculated based on road classes from 0 to 5 (for the first 10 km) and then additionally based on road classes from 0 to 2 (for the area above 10 km).
Example for selected radius of 25 km: We sum up two values of Pricing coverage:
- For the first 10 km based on FRCs 0-5
- The remaining 15 km based on FRCs 0-2 only
While calculating the Pricing coverage, we expand the area from the selected link in each direction, so it's just an informative display based on the link you specified, about the price of your analysis, not related to the data of traveling cars.
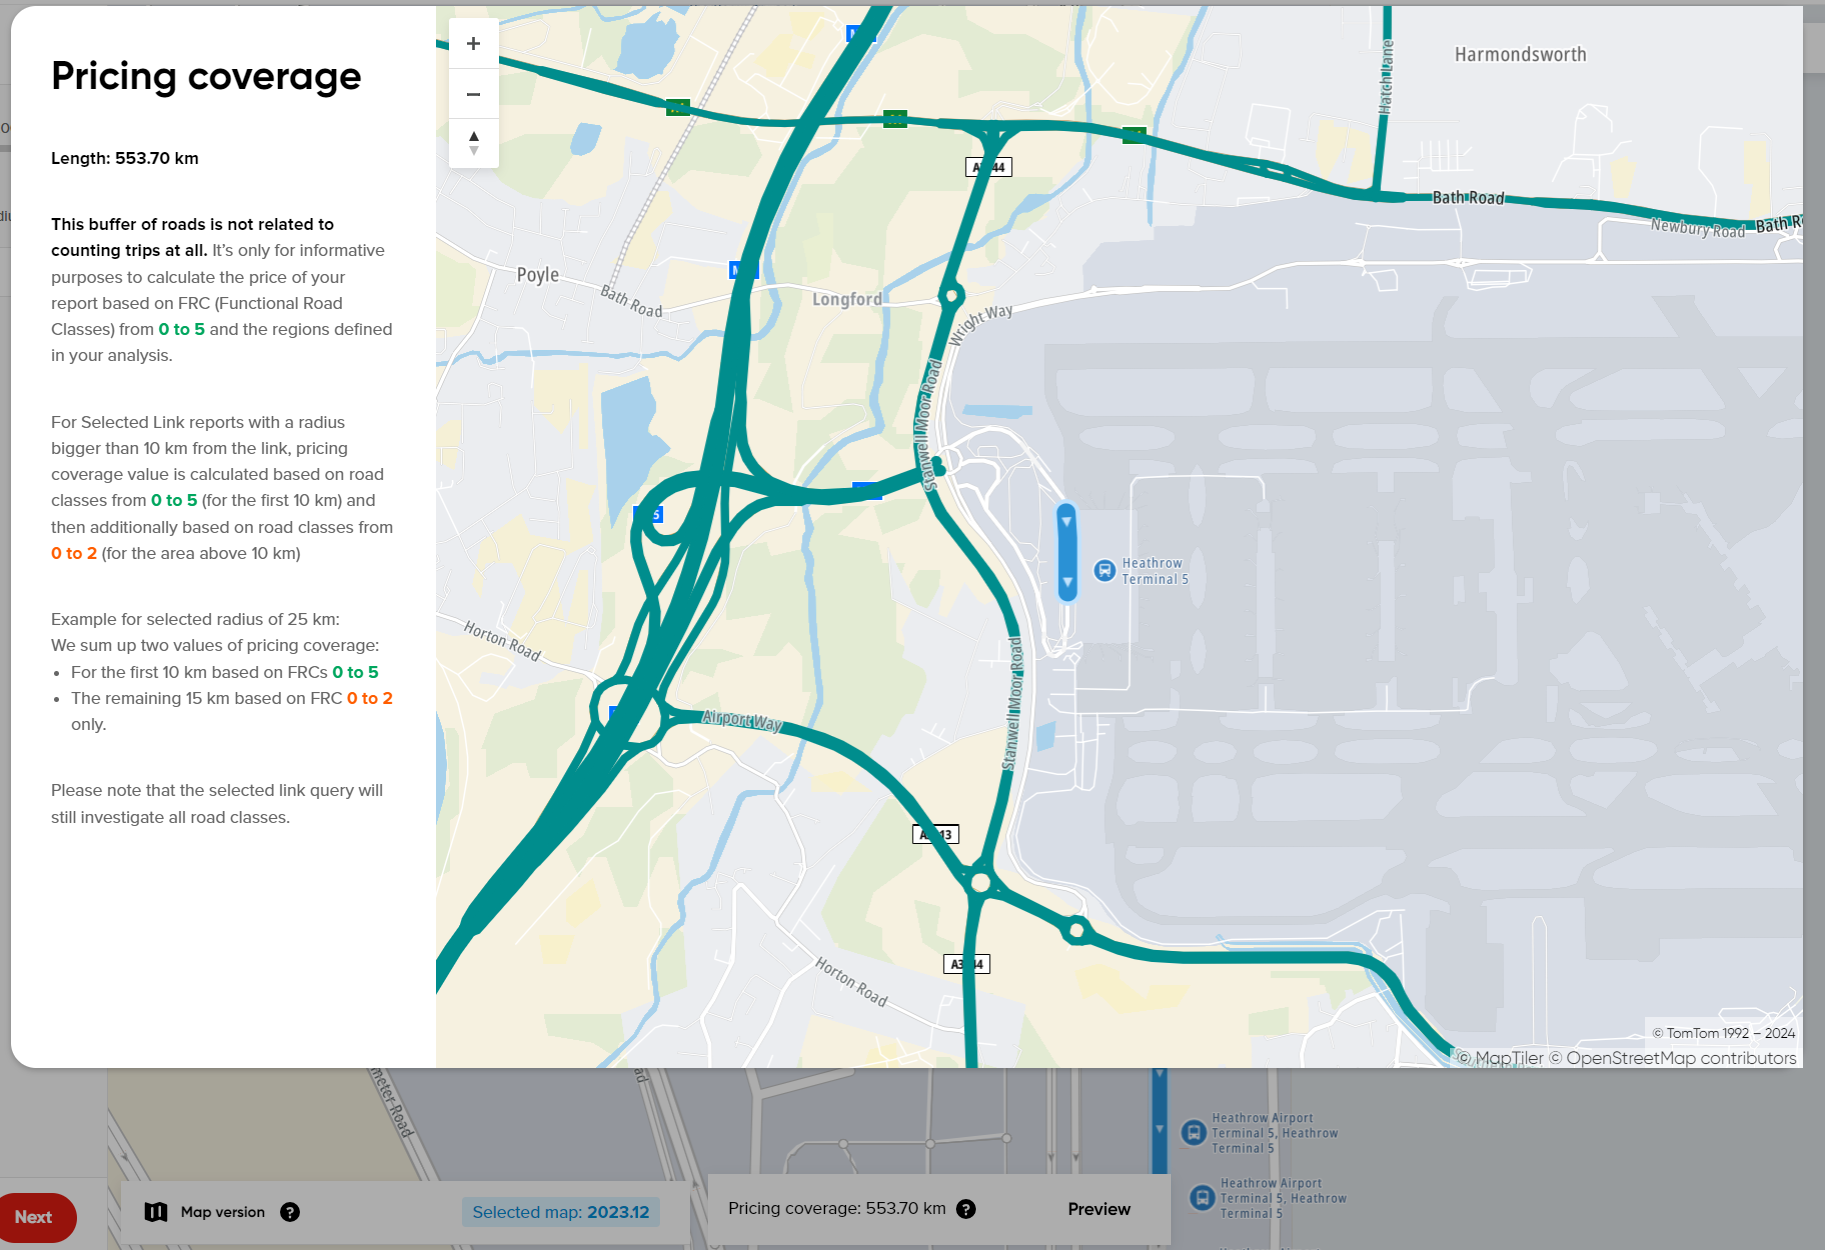
The maximum radius for the polygon geometry in the Selected Link report is 10 km. As a result, the Pricing coverage value is calculated based on this limit.
Generating the report
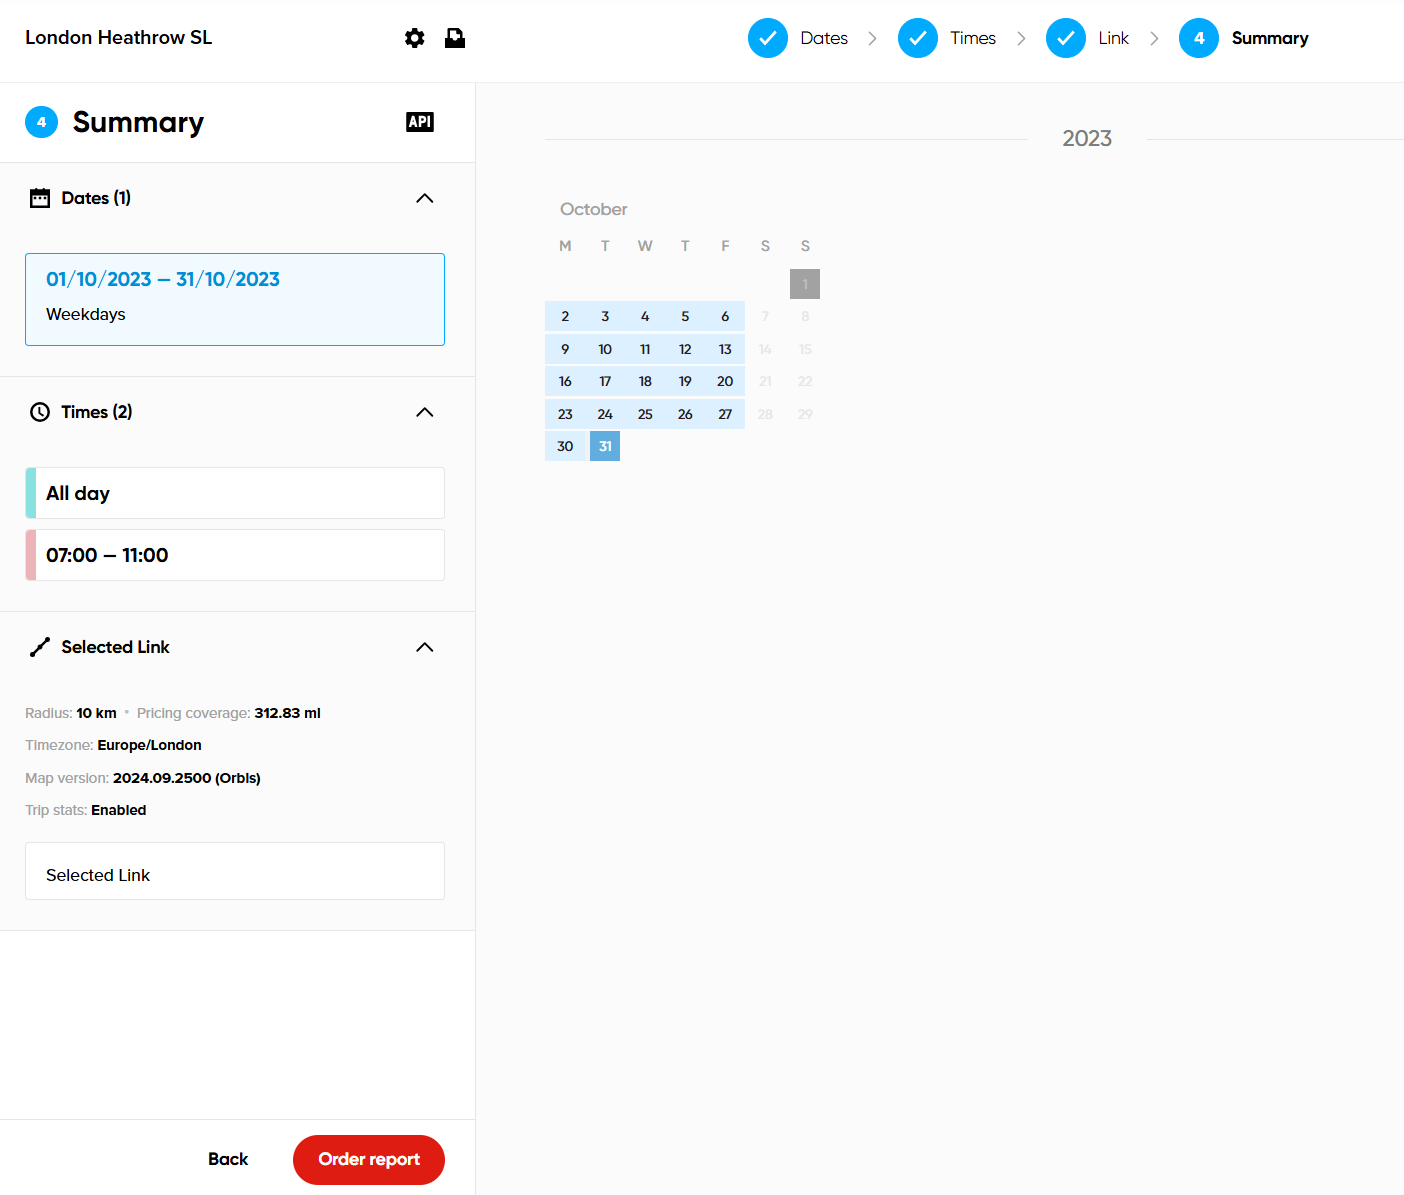
Version 1 finished with a separate Summary step and an Order report button. Version 2 has no summary step: the bar at the bottom of the creation page states what is still missing and, once nothing is, reads Ready to generate report. The bar also offers Cancel and Save as draft next to Generate report.
Calculations time needed to complete the analysis varies due to different factors such as the date ranges used (how long the analyzed period is), how many time sets were selected and how big the selected link route is.
Usually, it should not take longer than 30-60 minutes to calculate a report but please keep in mind, that in some cases it can take up to a few hours. If your analysis is calculating for more than 24 hours, feel free to reach out to us via e-mail to MoveSupport@tomtom.com and we will be able to see if everything is working properly.