Analysis introduction
In version 2, an analysis is no longer created in a sequence of wizard steps. After you name the report, everything is defined on a single page: a map on the right and a panel of collapsible sections on the left. You can fill in the sections in any order and generate the report as soon as all of them are valid.
Naming the report and choosing its type
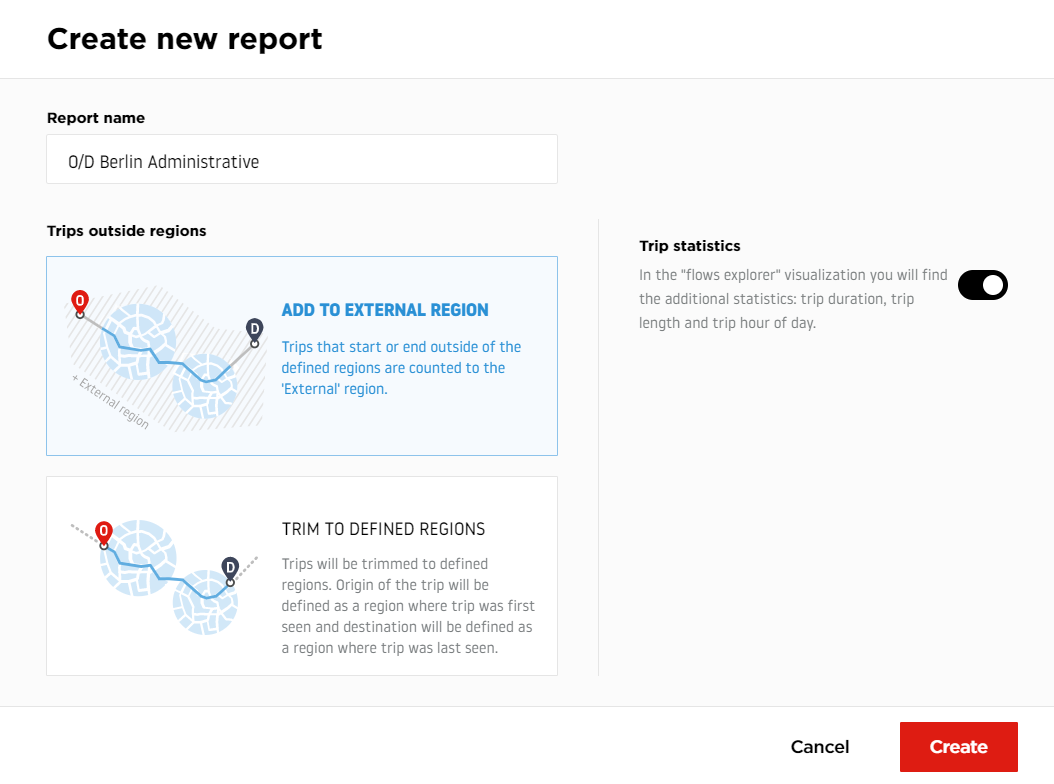
Click New report in the My reports section to open the new report dialog.
The dialog has two tabs at the top, one for each version of the product. Selecting the V2 tab, which is marked with a NEW badge, creates a version 2 report. The V1 tab is still available and creates a version 1 report.
Below the tabs you choose the report type by clicking one of two cards:
- Flow Matrix analyzes the origin and destination of trips which started, passed through or ended within your defined regions.
- Selected Link analyzes trips through a region or a selected road segment.
Each card carries a New features list that summarizes what version 2 adds for that report type. Finally, type the report name and confirm to open the creation page.
The creation page
The left panel of the creation page contains the following sections, from top to bottom. Every section can be collapsed individually, and a single control in the panel header collapses or expands all of them at once.
For a Flow Matrix report:
- Report limits - a live counter of the region count and the region area used by the report, against the limits granted to your account.
- Regions settings - the Origin - Destination only switch. Enabling it raises the region count limit but removes the Via role from the report.
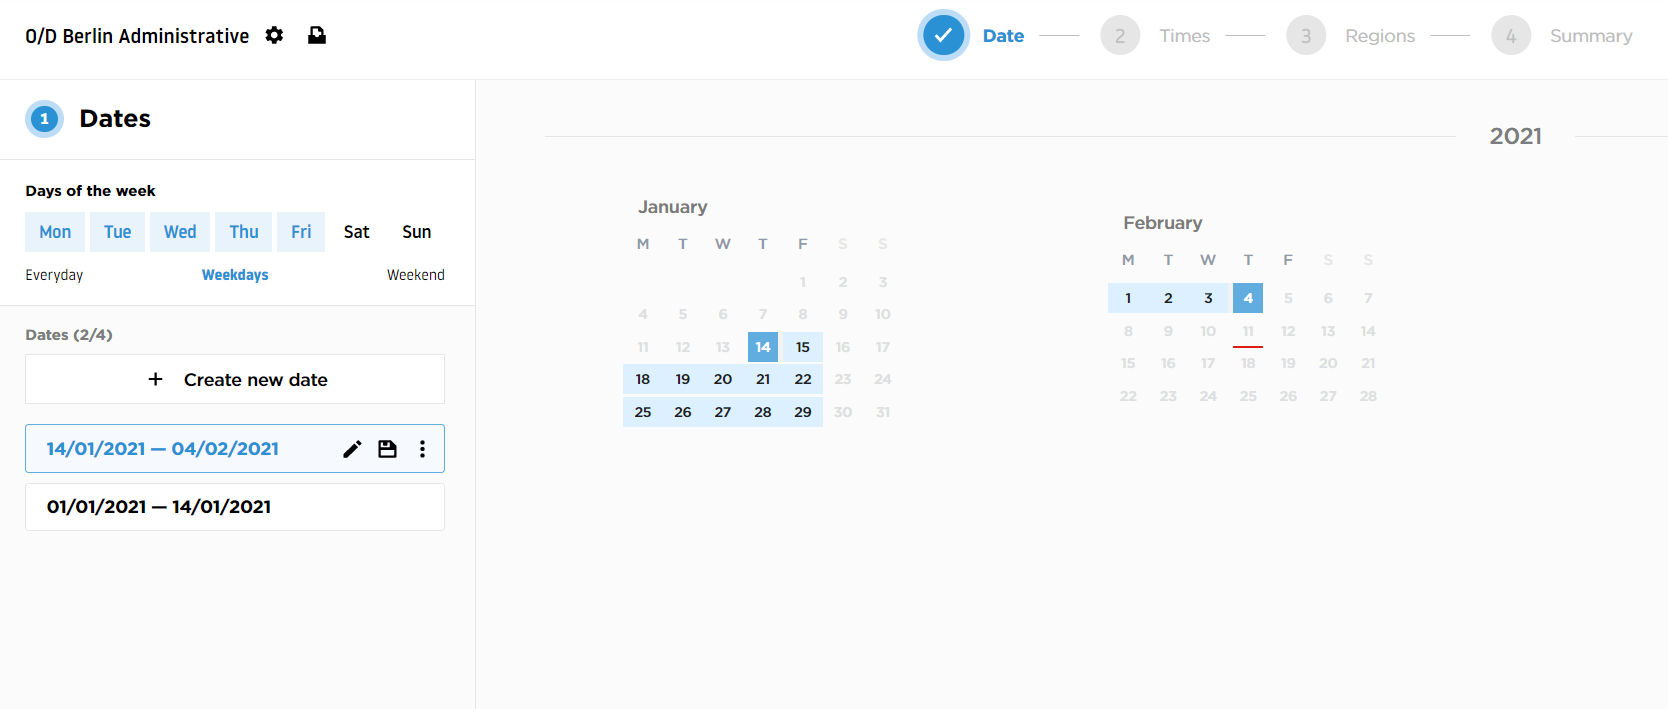
- Dates - the date ranges of the report, with a counter showing how many of the allowed ranges are already in use.
- Times - the time ranges of the report, with the same kind of counter.
- Timezone - the time zone the date and time ranges are interpreted in.
- Regions - file upload, the list of defined regions, and the option to download them.
- Filters - the vehicle types included in the analysis.
- Settings - the Trip statistics switch and, where your account allows it, the data source selection.
For a Selected Link report the panel starts with an Enhanced metrics section instead of Report limits and Regions settings, and the Regions section is replaced by Selected Link.
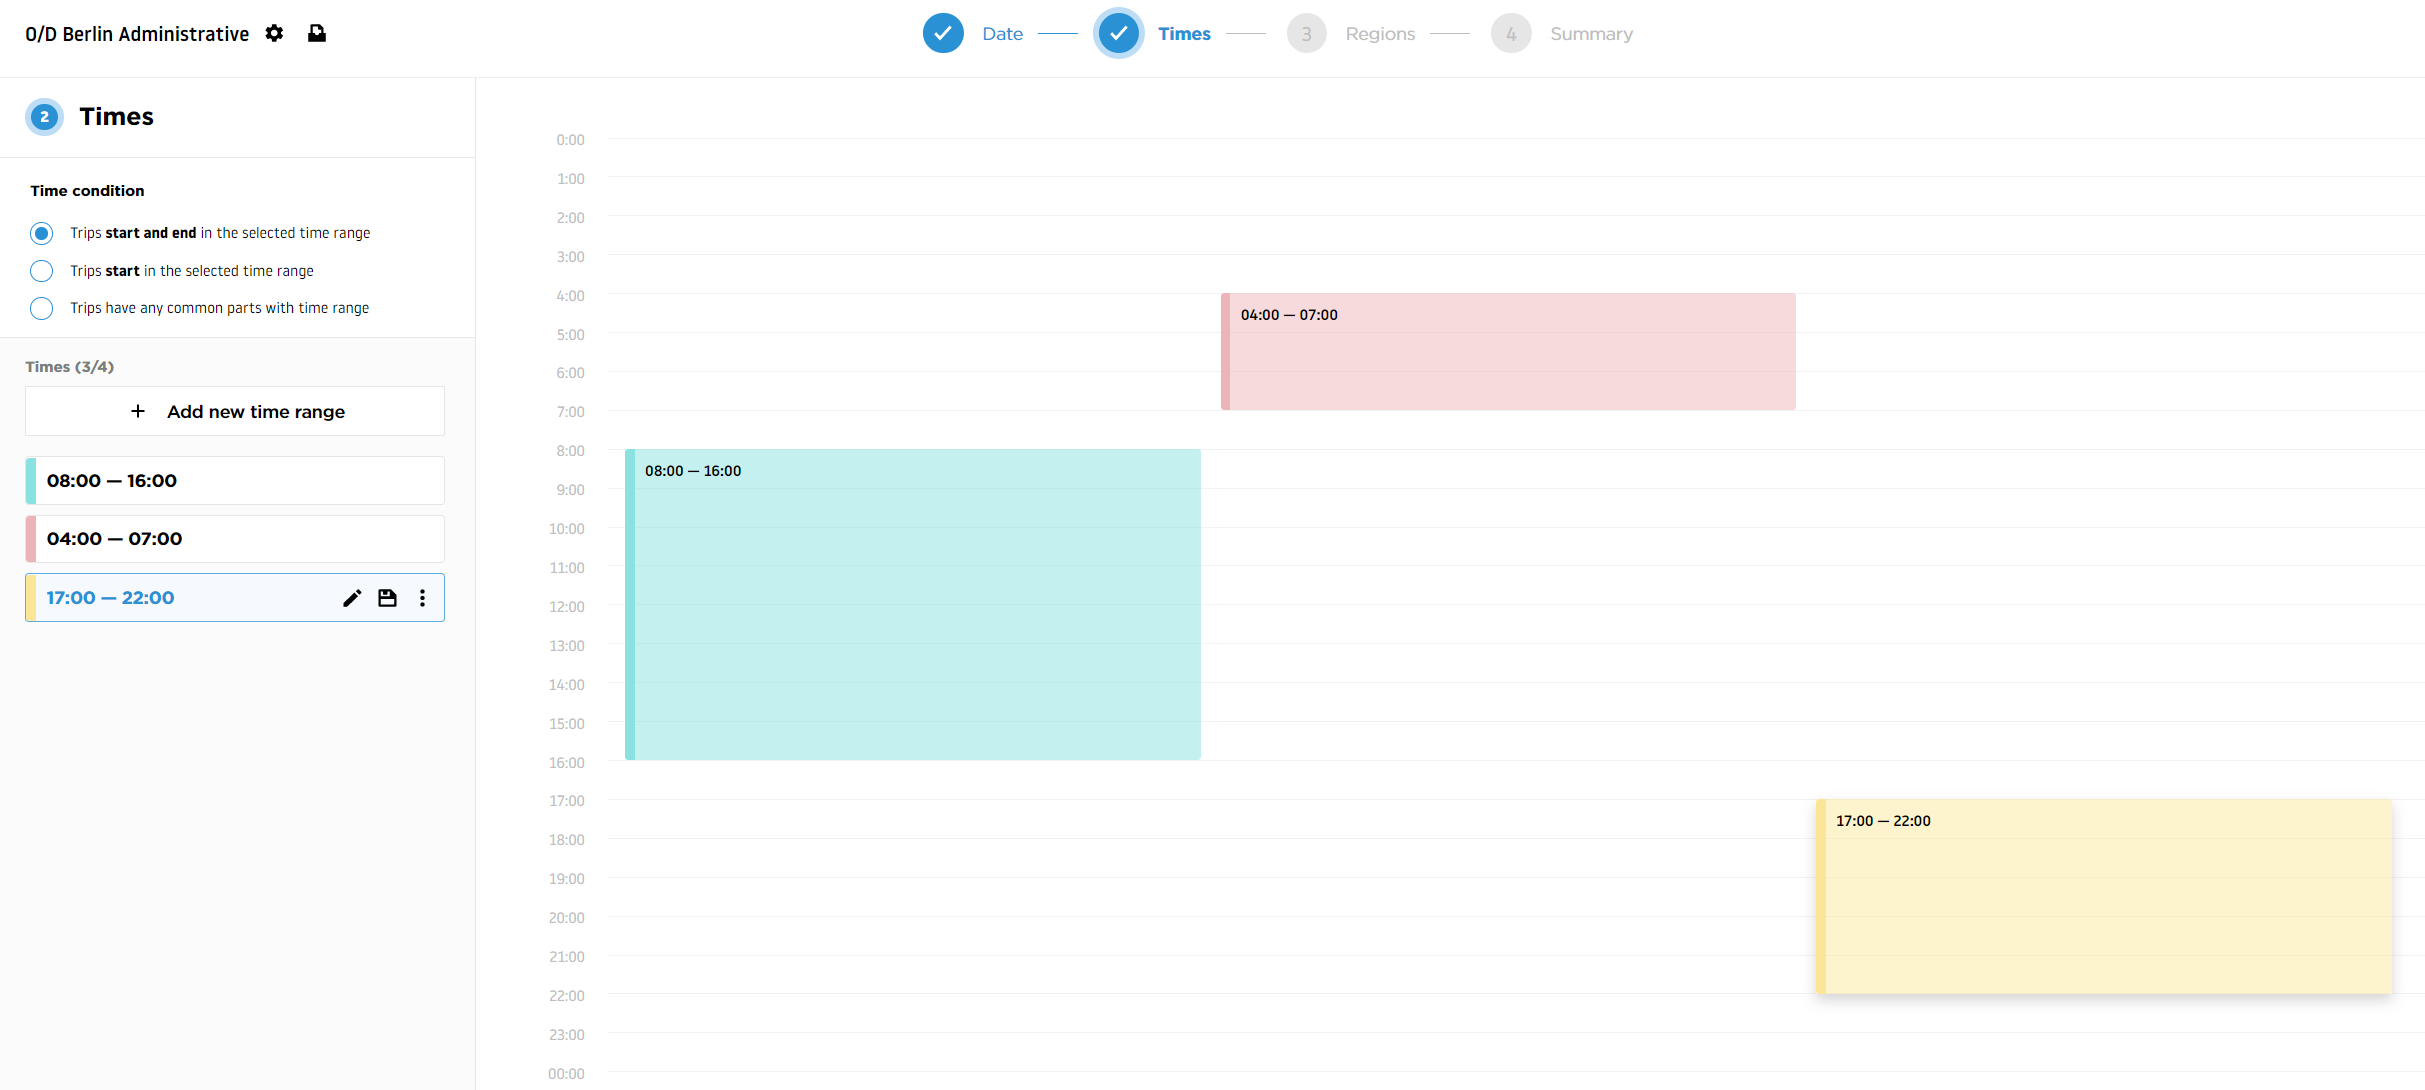
Version 2 removes the time condition selector that version 1 offered next to the time ranges. All version 2 reports use a single, universal time condition, so there is nothing to choose. The Times section instead gained a generator that creates a whole series of ranges covering the day in one click.
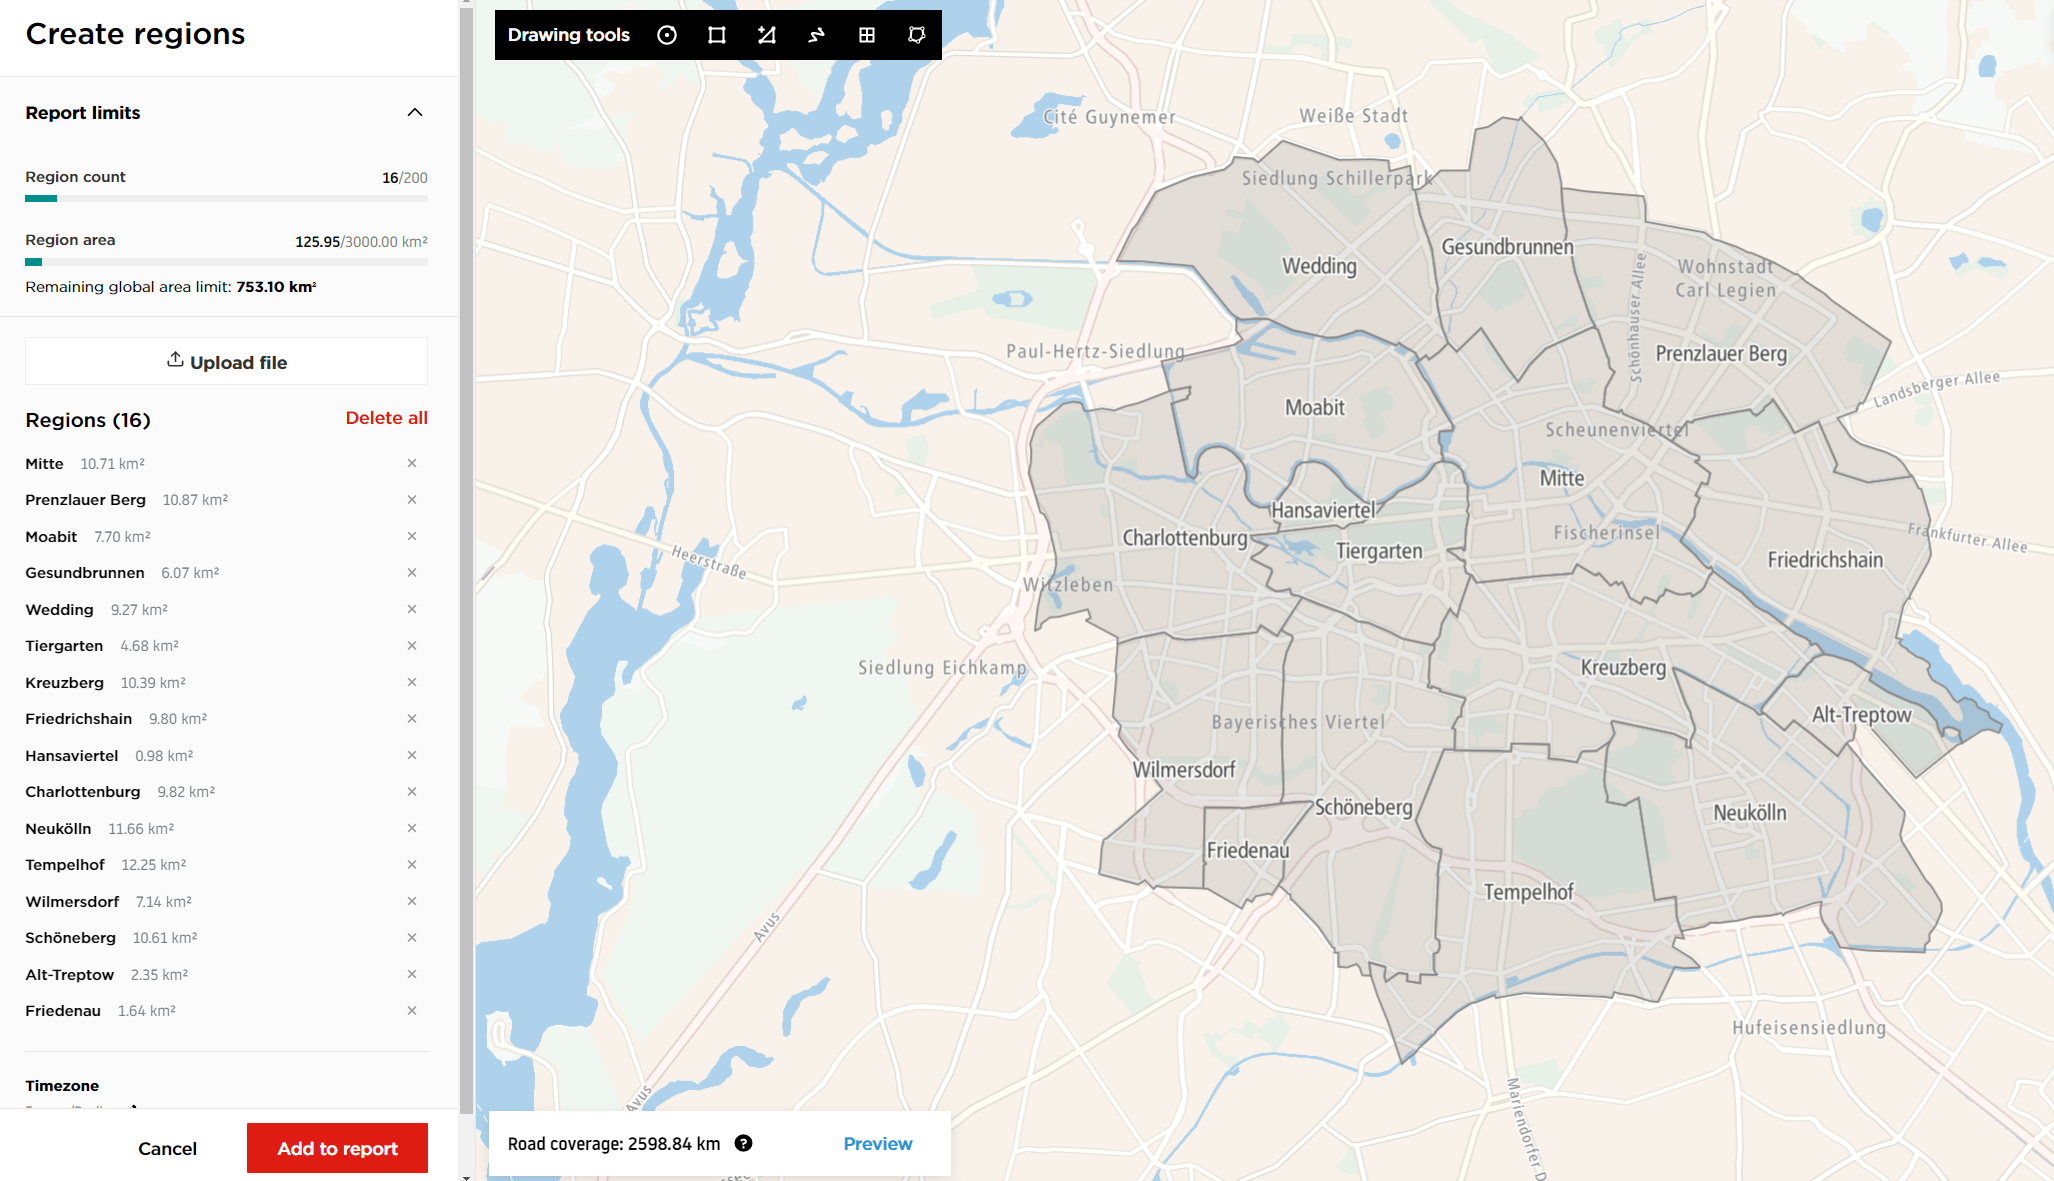
Regions are drawn on the map with the drawing toolbar in its upper left corner, or imported from a file in the Regions section. The map keeps the map version selector in its lower left corner and the search and zoom controls in its upper right corner.
Generating the report
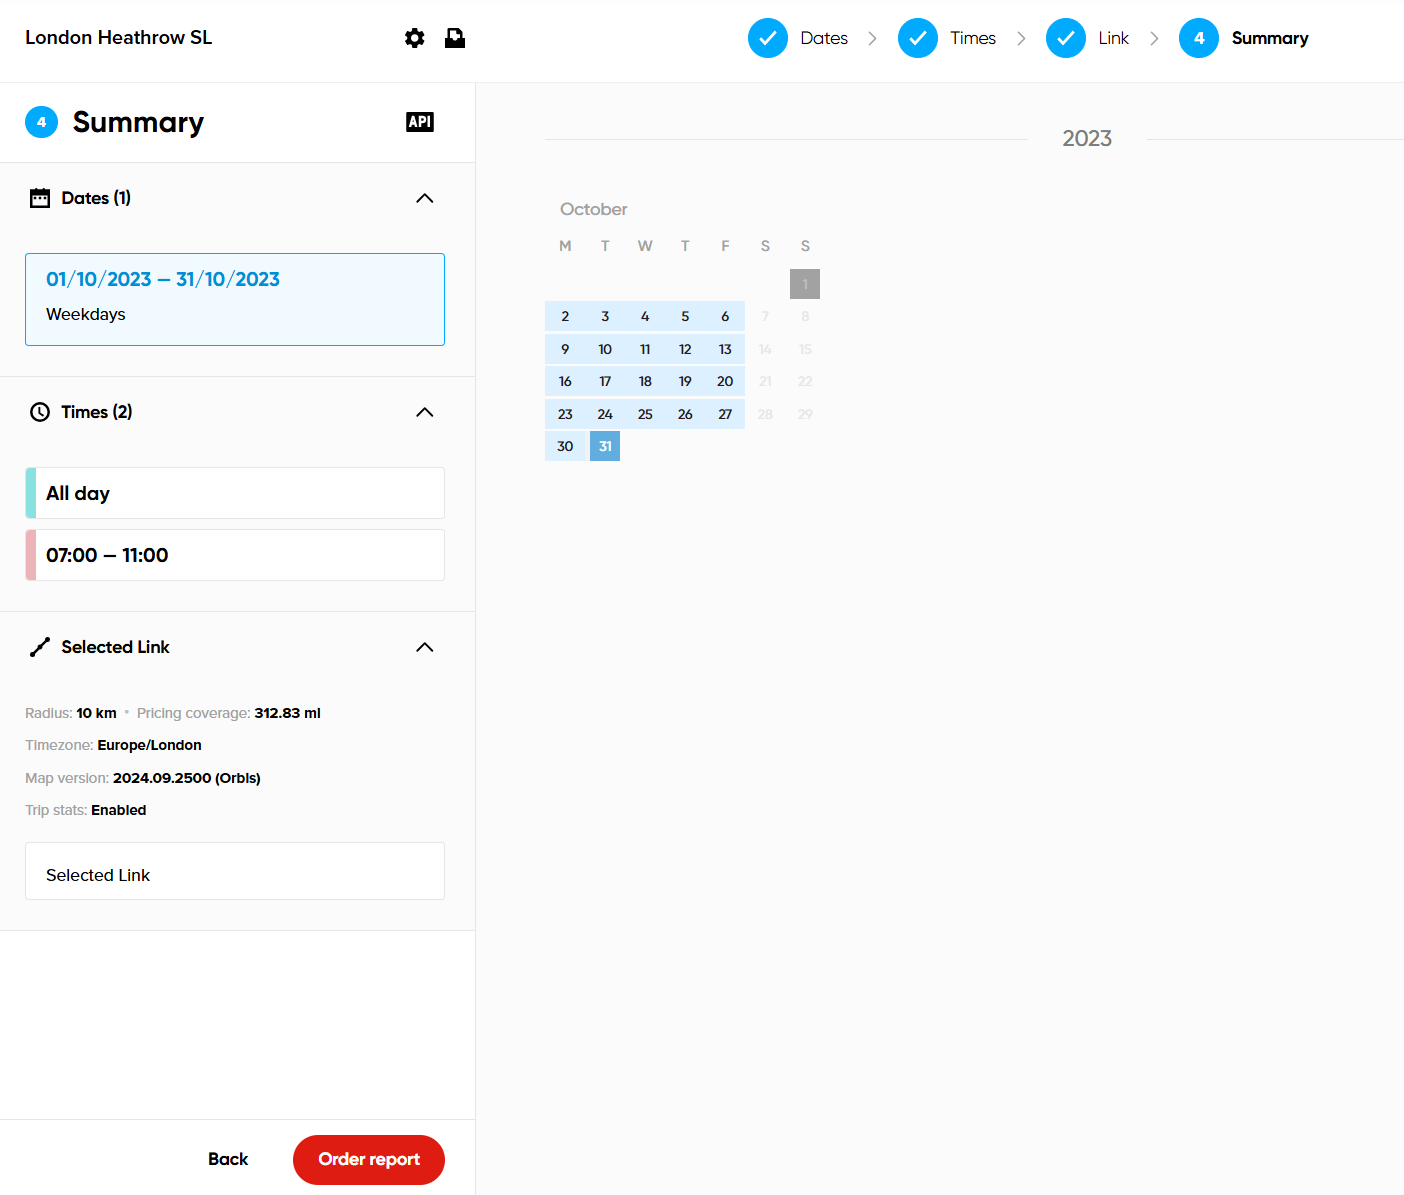
Version 1 ended with a separate Summary step and an Order report button. Version 2 has no summary step. Instead, a bar at the bottom of the creation page is always visible and always tells you what is still missing, for example Add geometry and dates to generate report or Fix times to generate report. Once nothing is missing it reads Ready to generate report.
The bar holds three actions:
- Cancel returns to the dashboard.
- Save as draft stores the current configuration under a name so you can come back to it later. Drafts are listed in the Drafts tab of the dashboard.
- Generate report submits the analysis for calculation.