Adding regions
Area definition
There are two main methods for defining regions for your analysis.
Method 1: Use the file selector at the top of the Regions section of the left panel. This feature allows you to import regions using one of the supported file formats:
- .GeoJSON
- .TopoJSON
- .SHP (all files should be provided in a single zip archive)
- .KML
- .KMZ
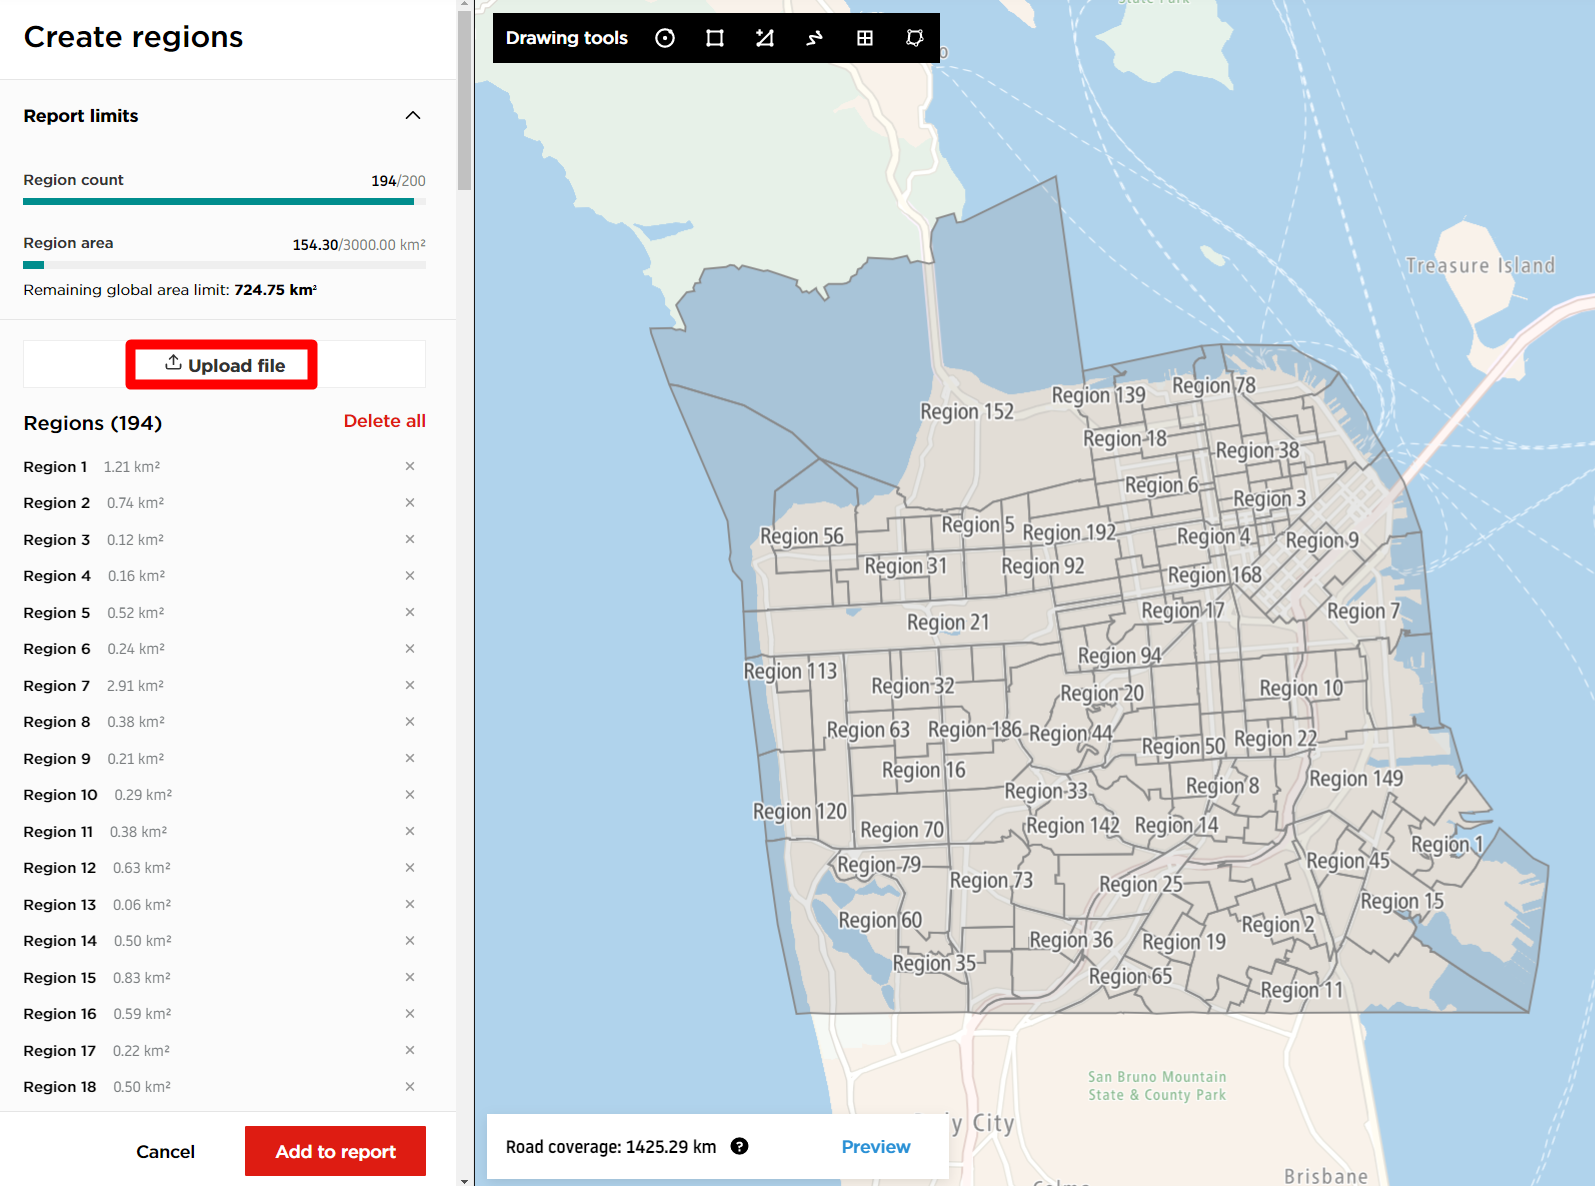
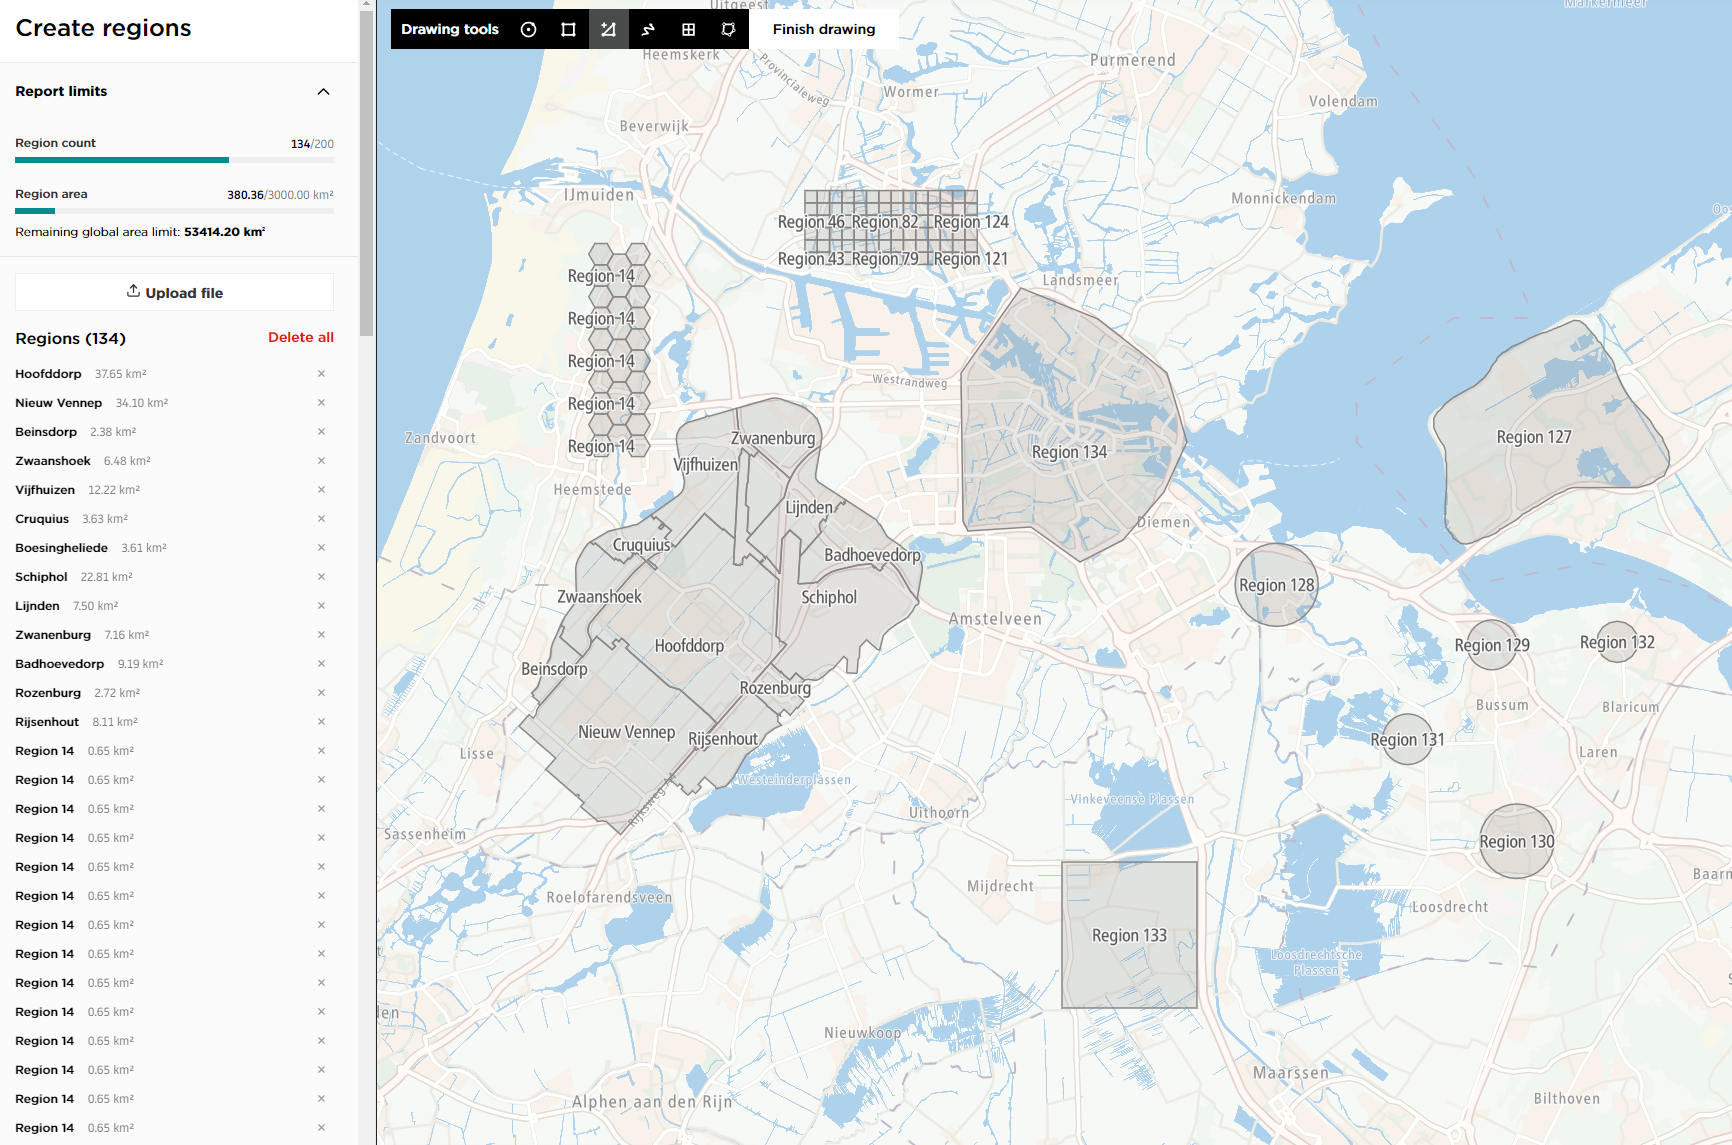
Method 2: Draw the regions with the toolbar in the upper left corner of the map, which offers the following tools:
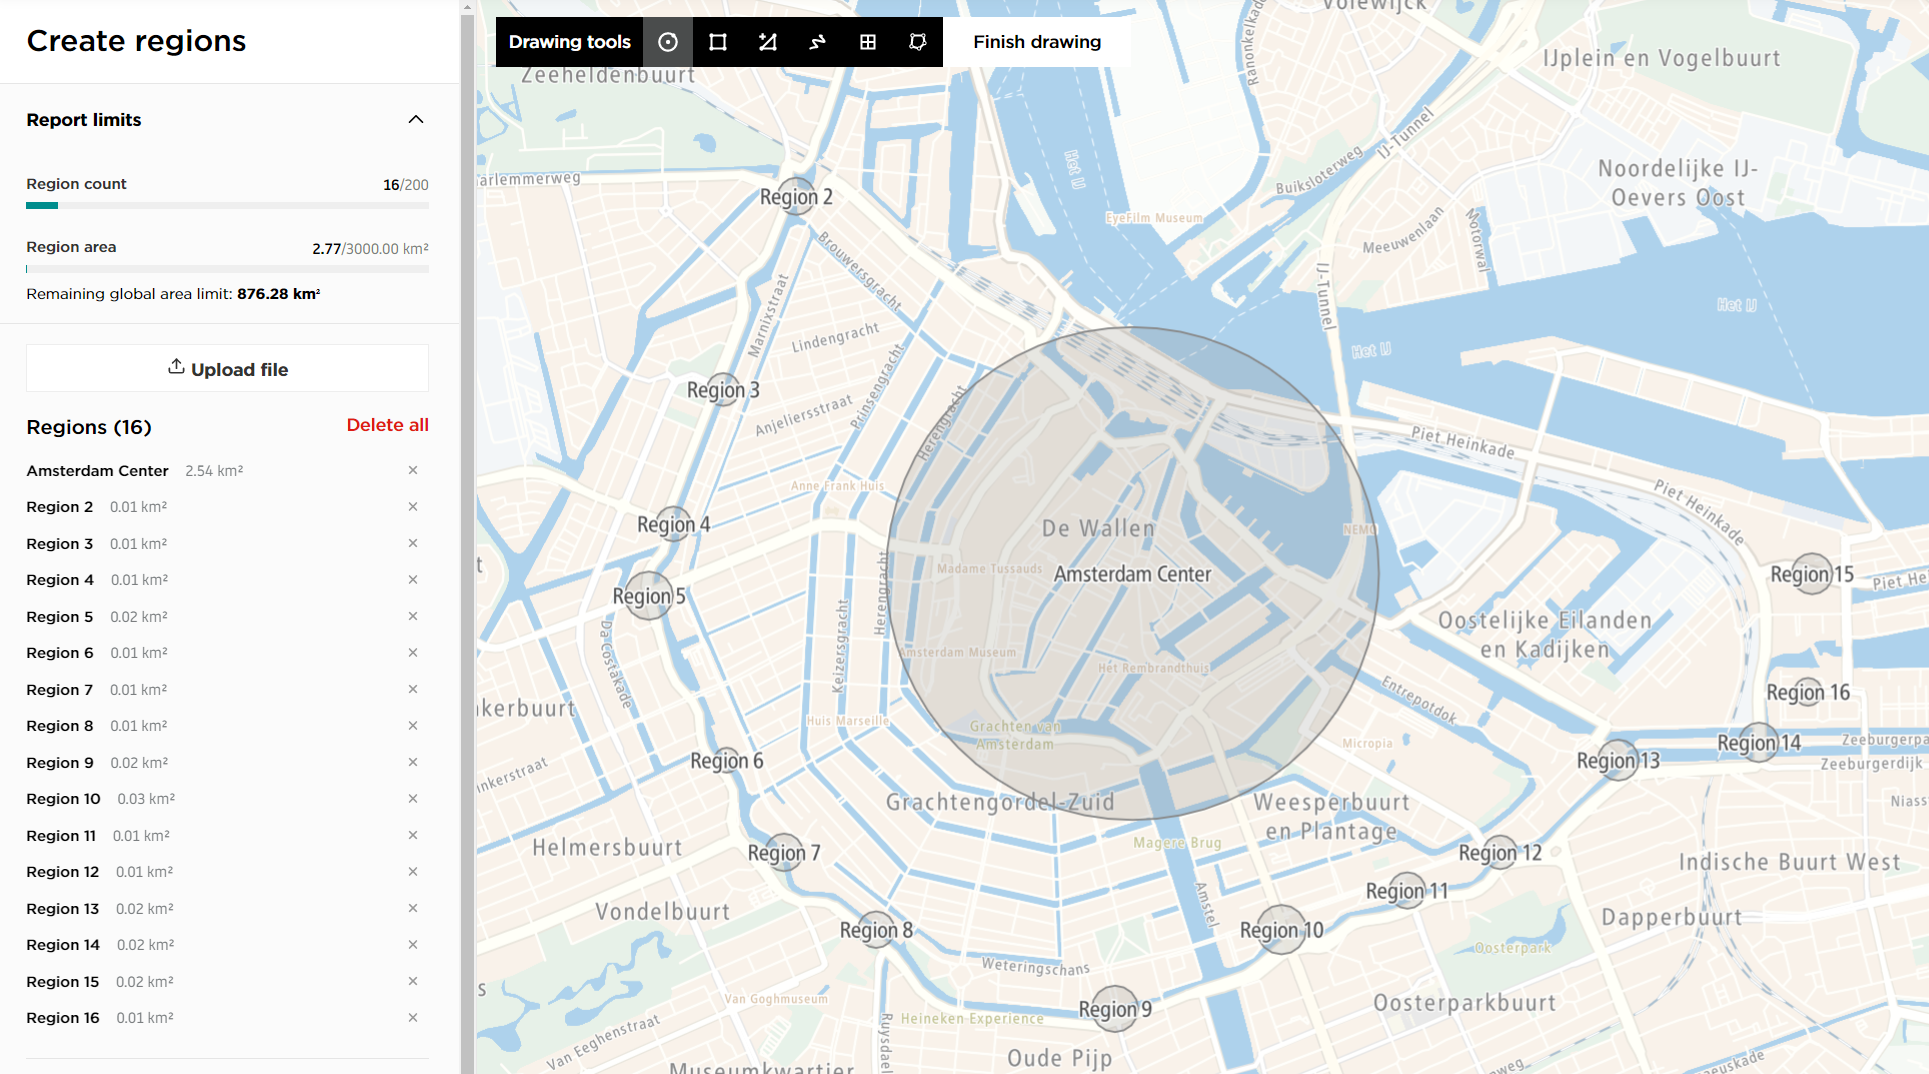
- Circle: This tool allows you to draw circular areas by selecting the center and then increasing the radius.
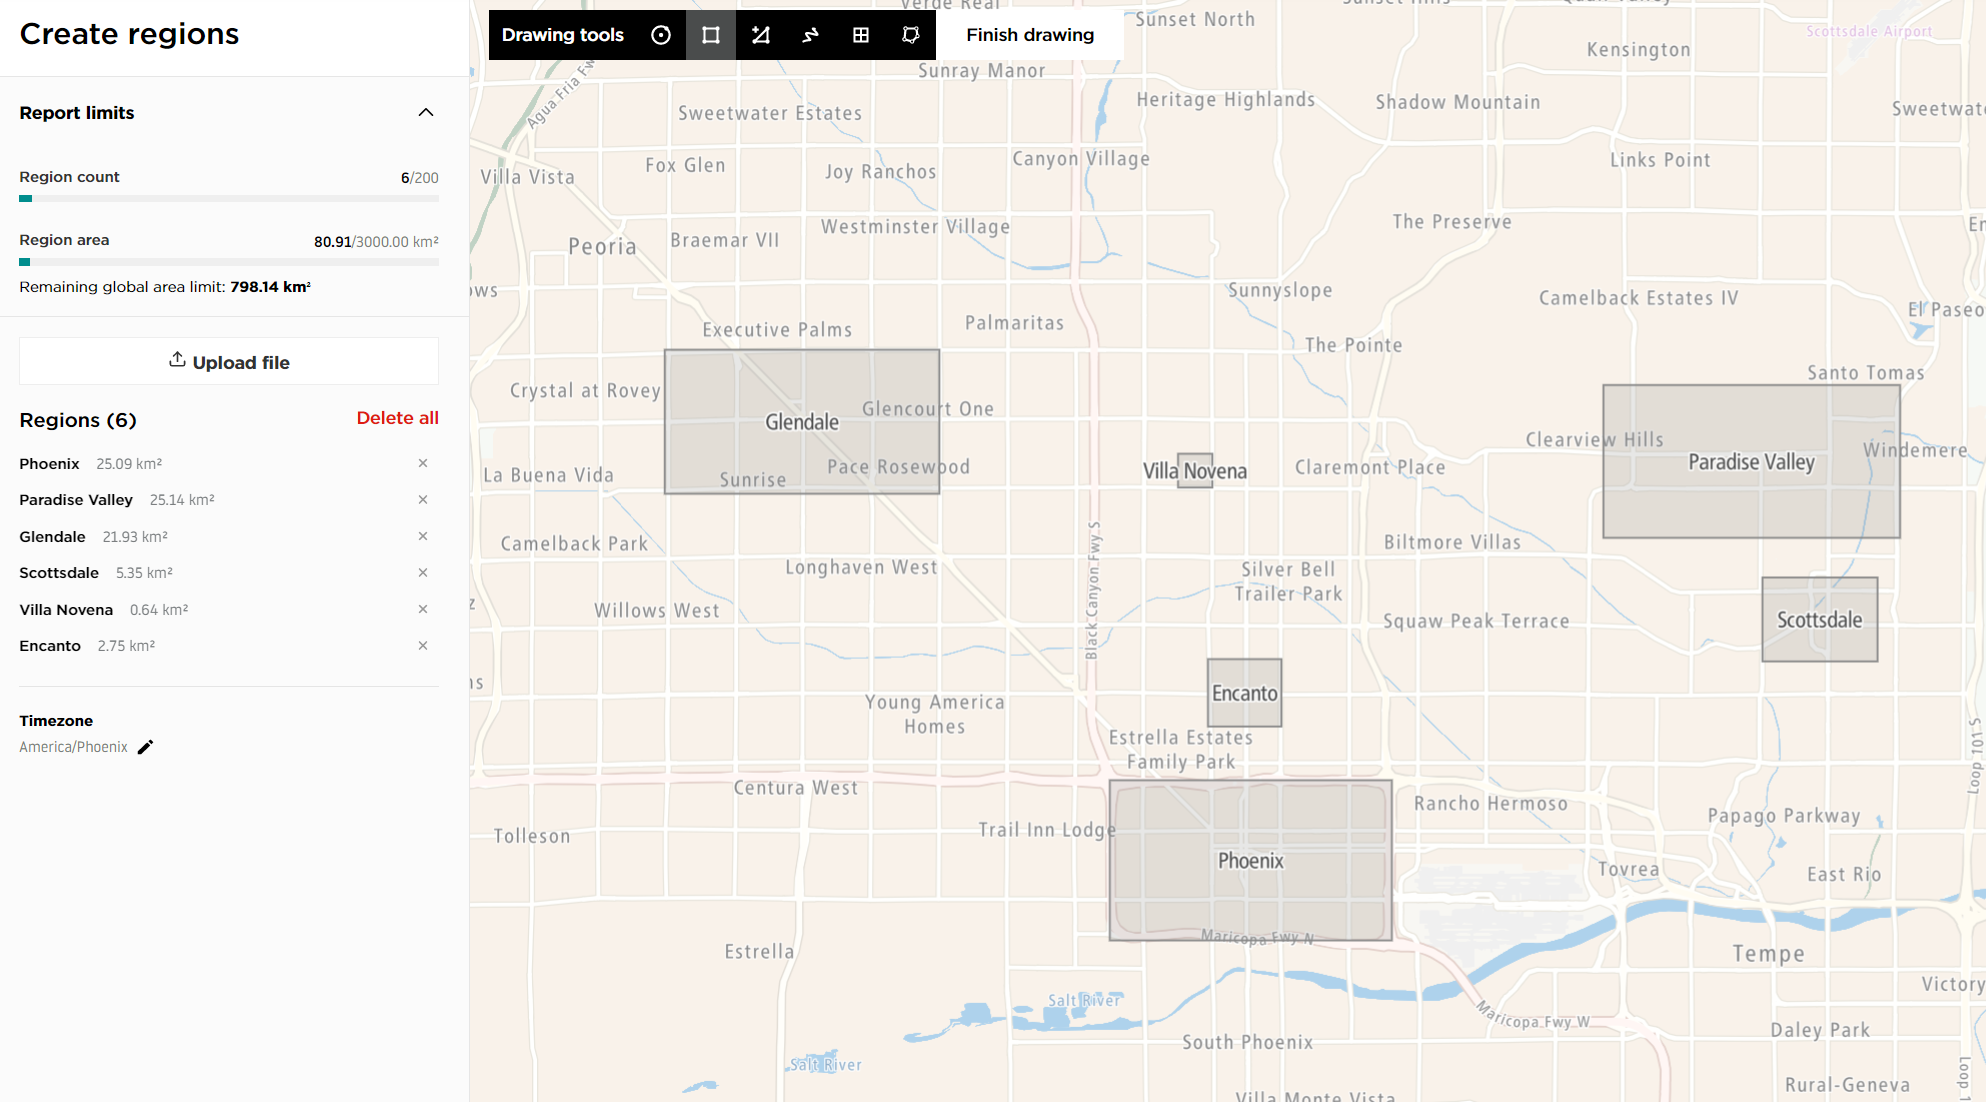
- Rectangle: This tool allows you to draw rectangular areas.
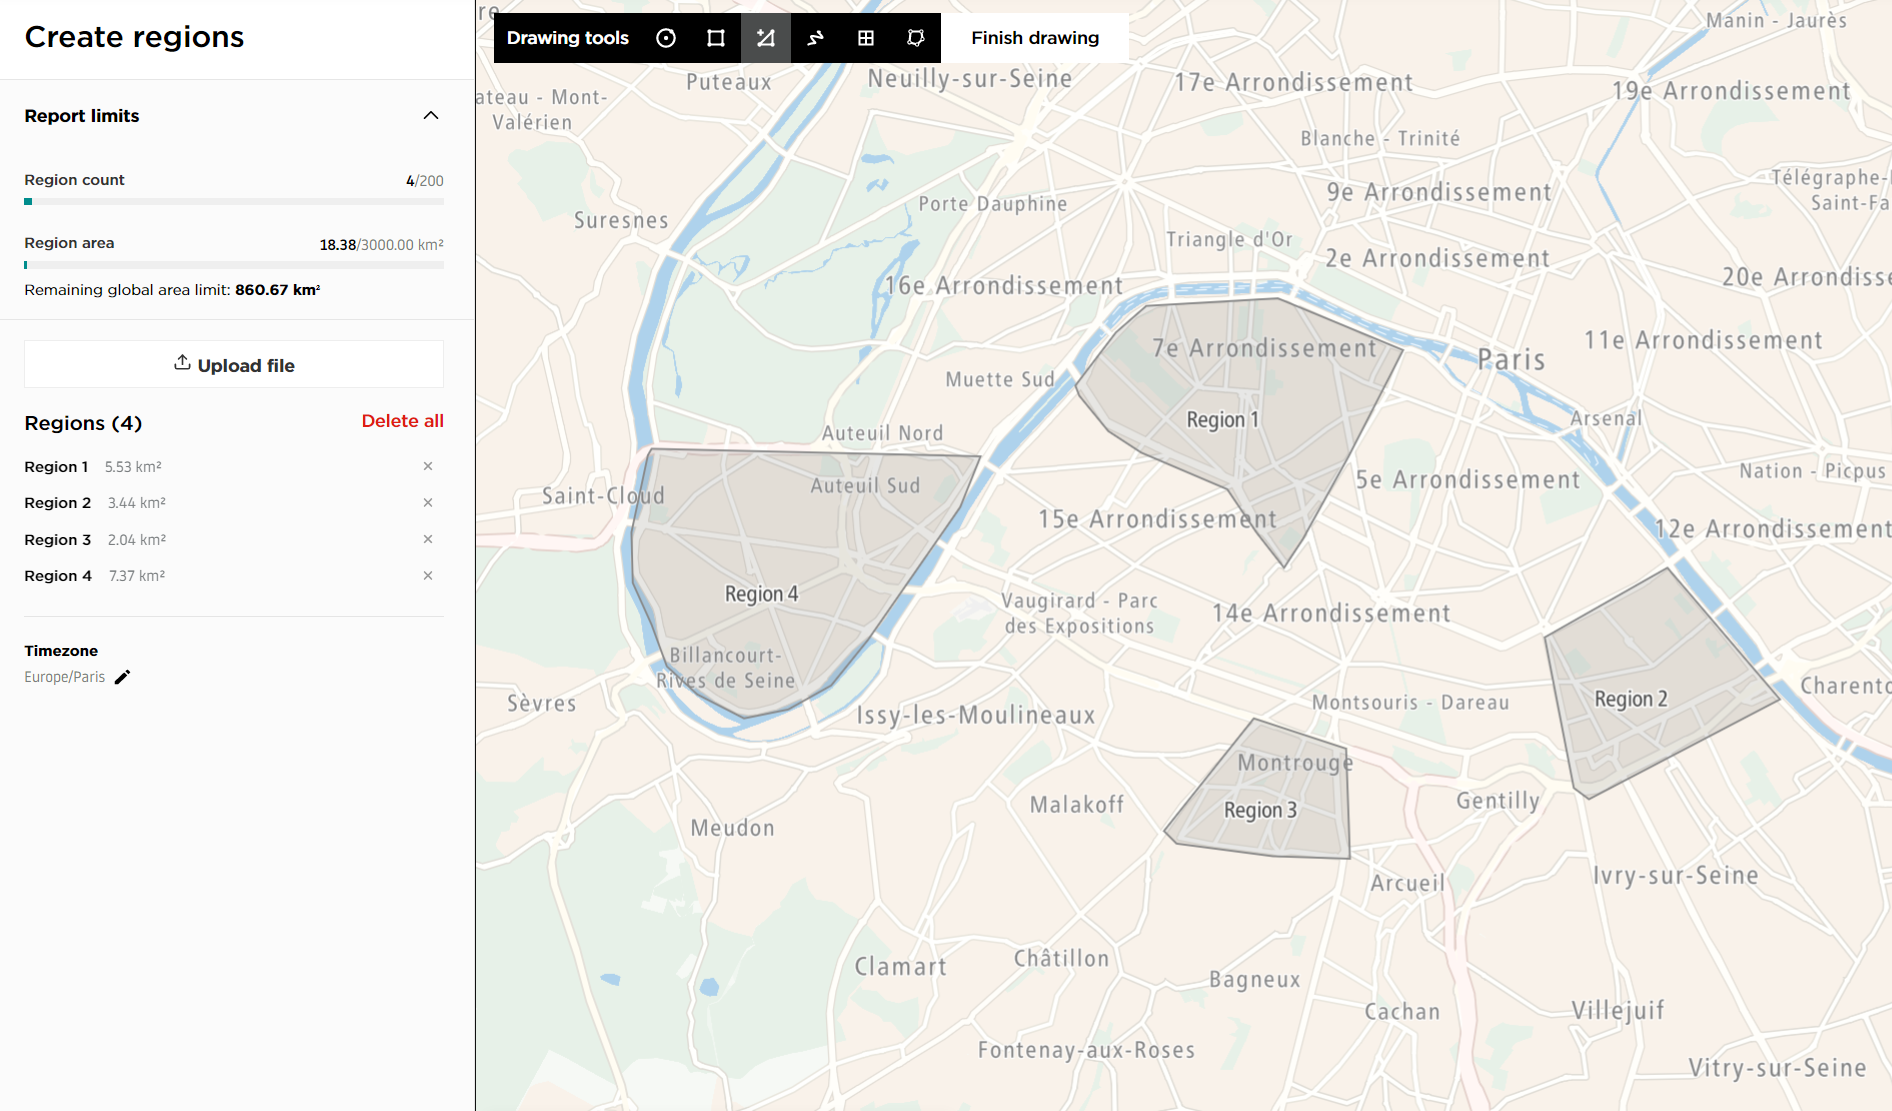
- Polygon: This tool allows you to draw polygonal areas. Click to place each vertex and right-click to finish drawing; the hint next to the toolbar reminds you of this while the tool is active.
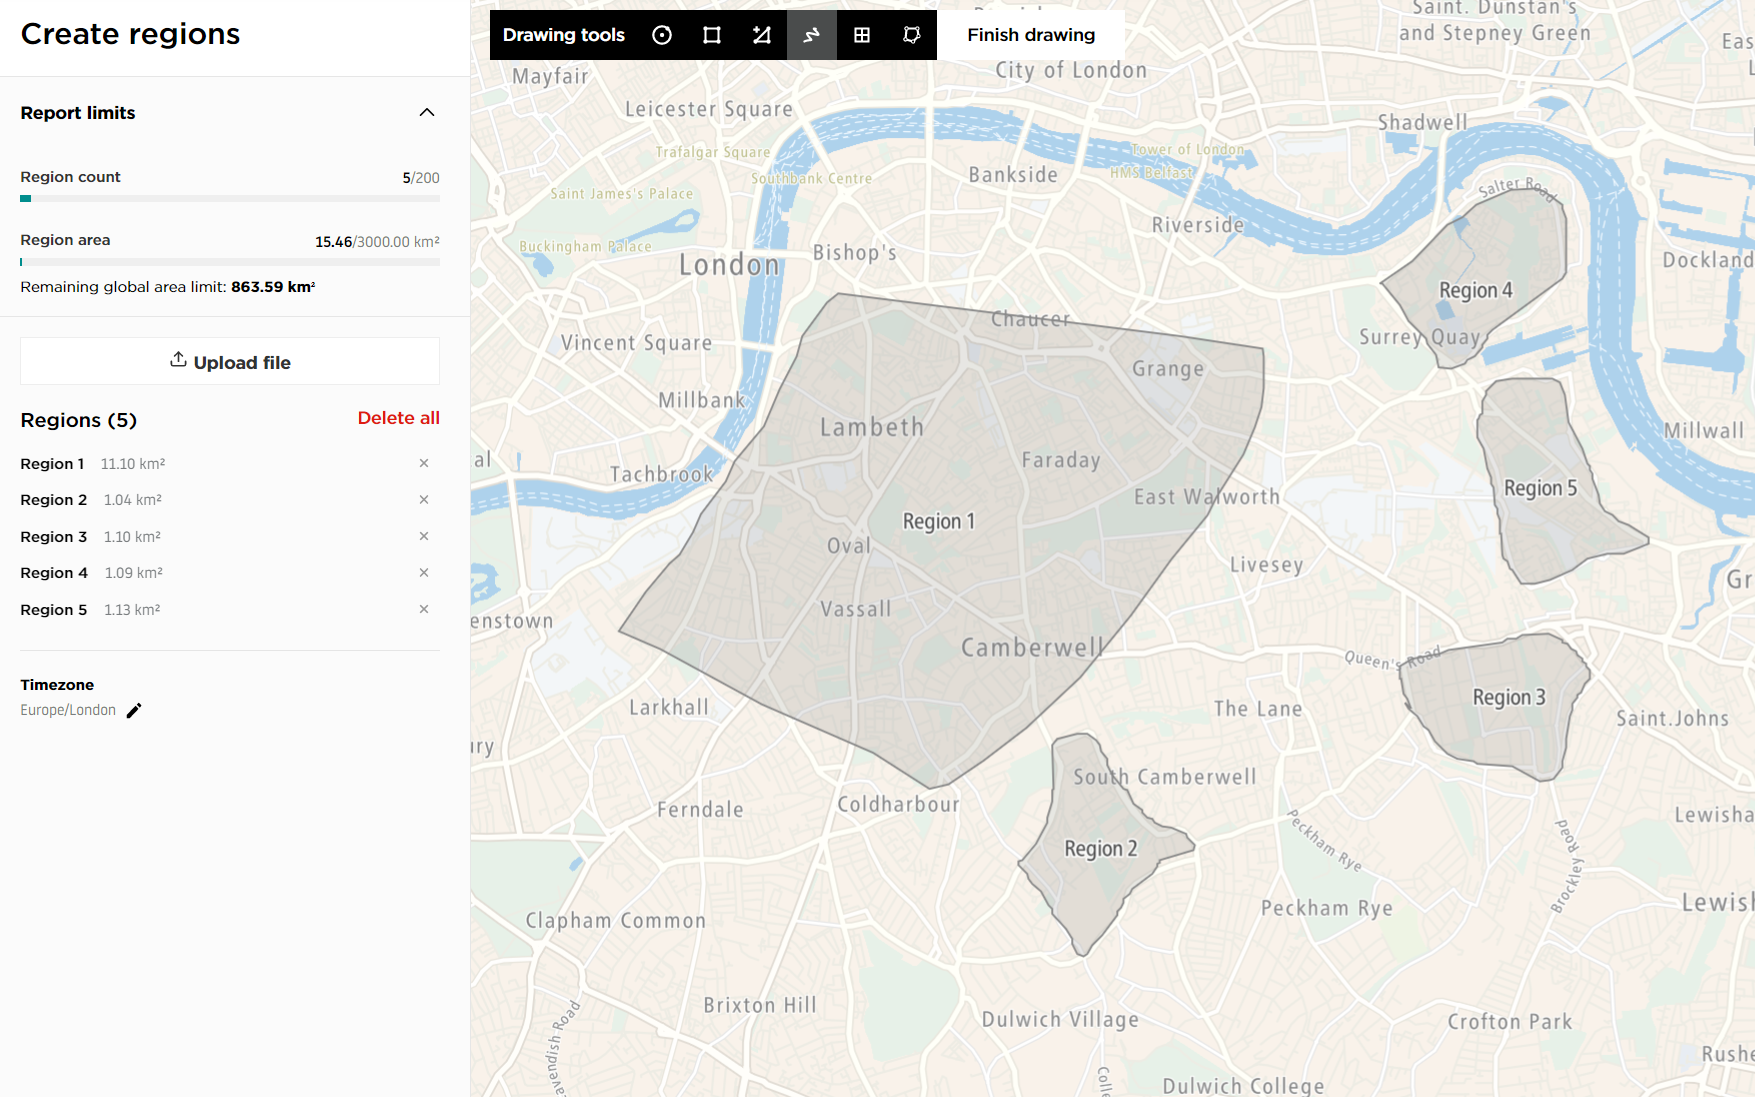
- Shape painter: This tool allows you to draw custom shapes that will be converted into areas.
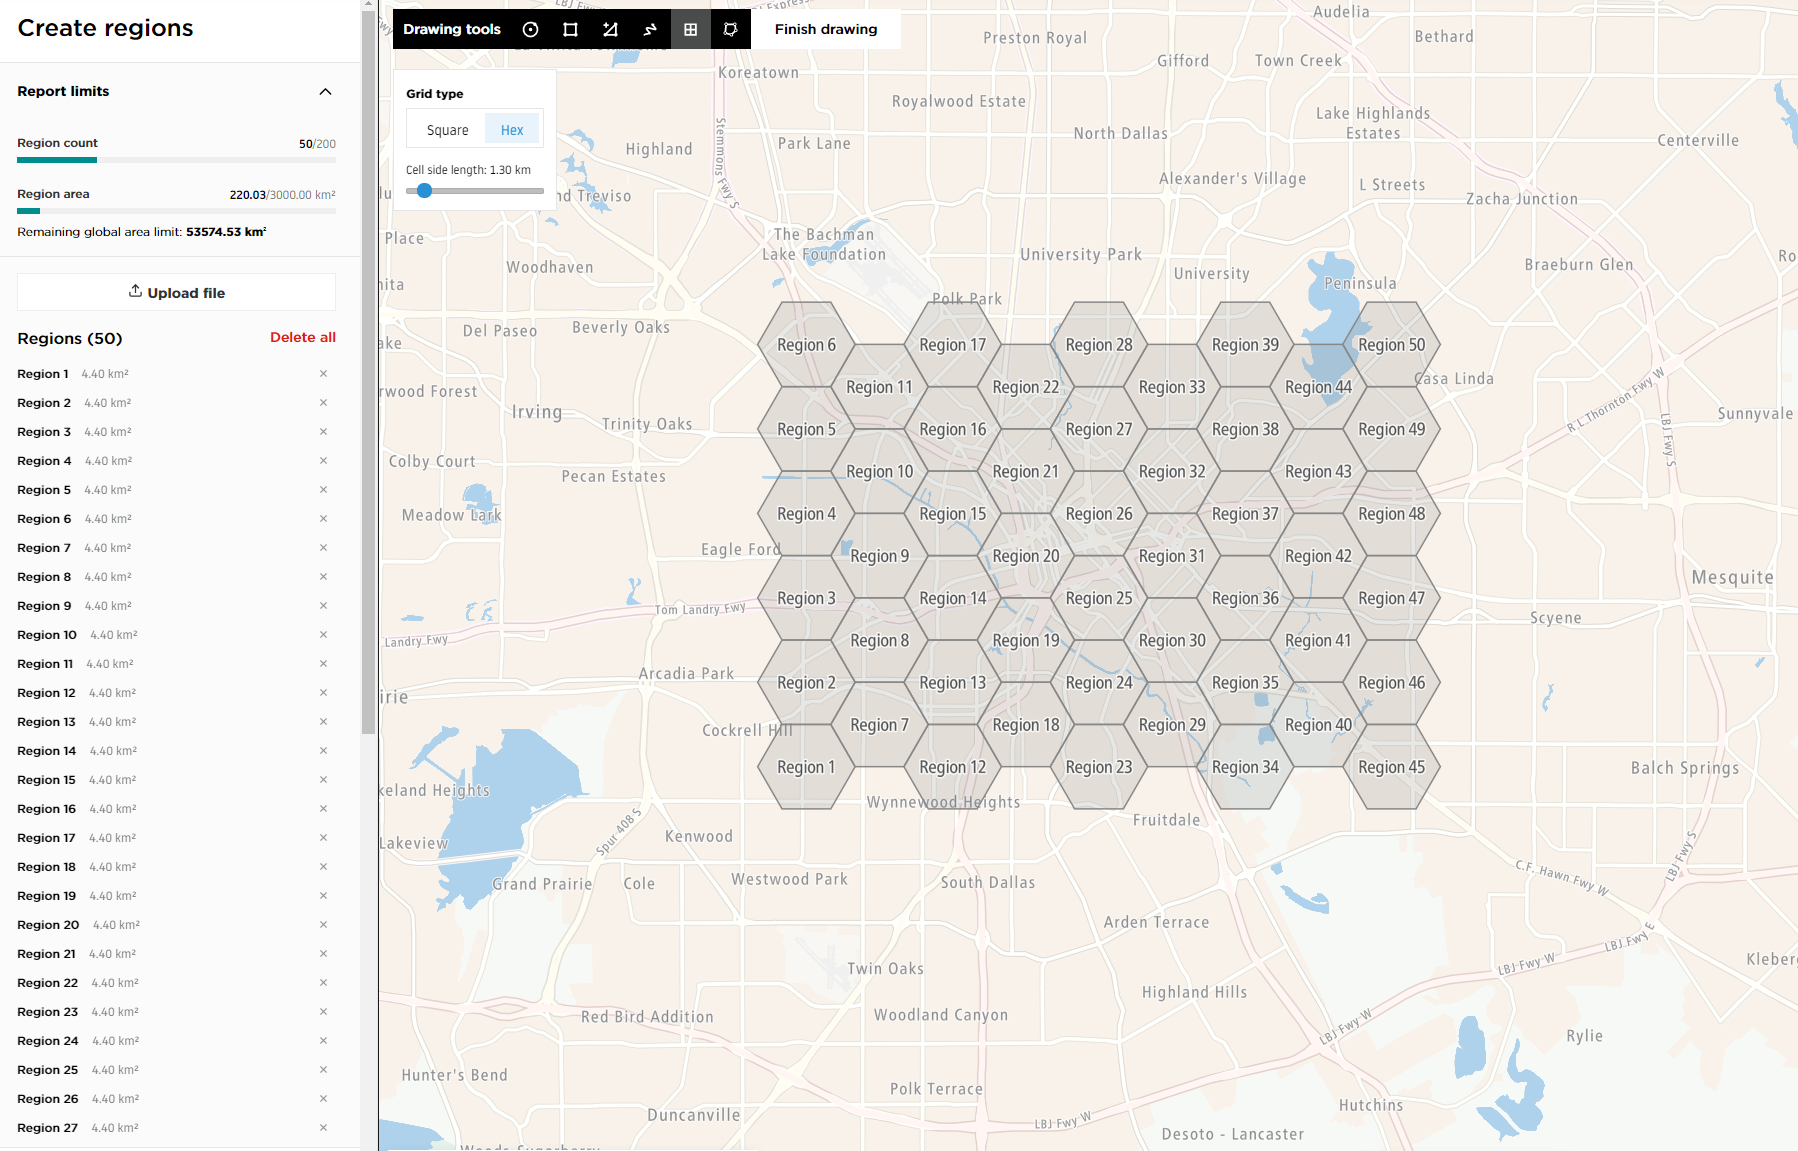
- Grid: This tool allows you to create a grid of connected square or hexagonal areas. When the tool is active, a secondary menu next to the toolbar lets you switch the grid type and the cell size.
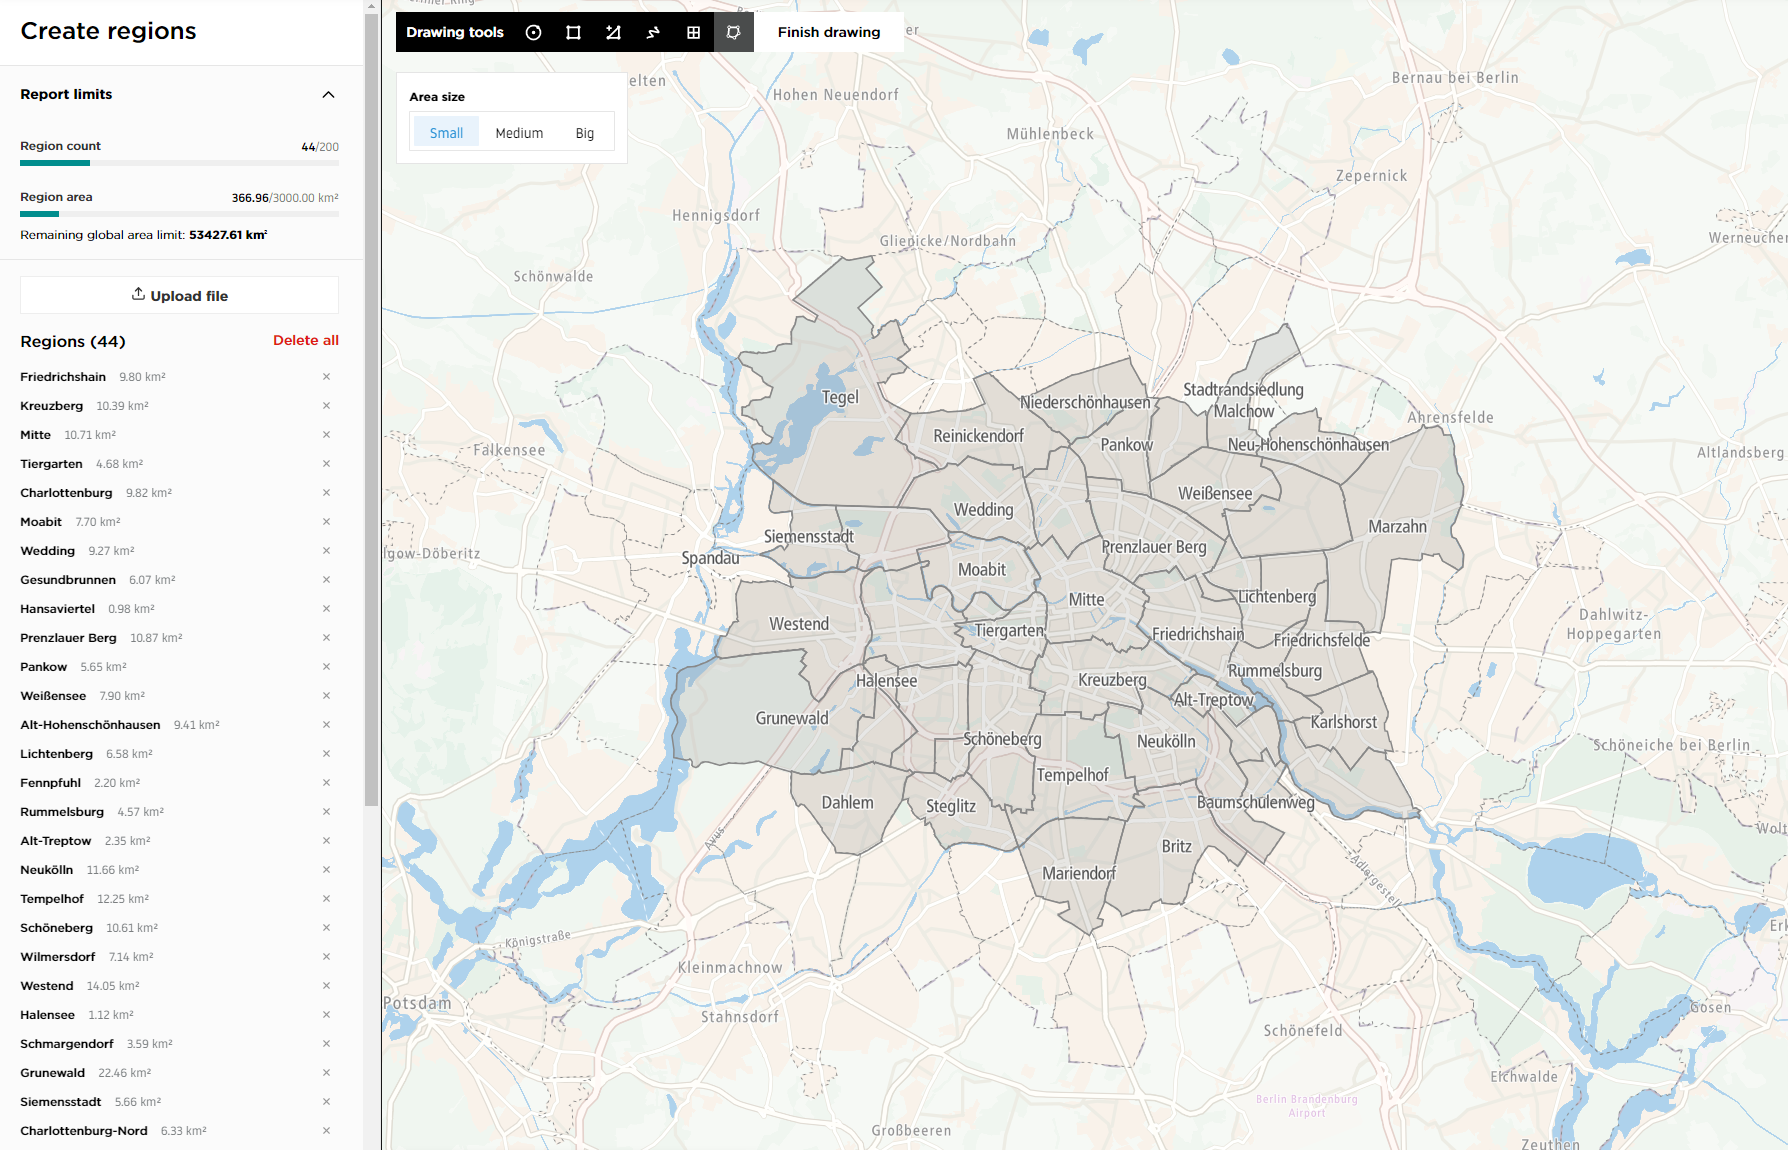
- Administrative area: This tool allows you to select predefined administrative areas by clicking them on the map.
Administrative area sources
In version 1 the administrative areas always came from the TomTom map. Version 2 lets you pick the source of the boundaries first, and only then the level of detail:
- TomTom Map: administrative levels 7, 8 and 9. Level 7 is preselected.
- Overture: county, local admin, locality, macrohood and neighborhood divisions.
- UK OS Data Hub: eleven United Kingdom boundary sets, including ceremonial counties, districts, boroughs and unitary authorities, electoral divisions, Westminster and Greater London constituencies, wards, parishes and polling districts.
The source and level you used last are remembered and preselected the next time you pick the tool.
In addition to the individual methods described previously, you can combine these region types. For example, you can import pre-defined shapefiles or GeoJSON files and draw custom shapes at the same time.
Working with the region list
The Regions section lists every region the report contains and shows their count in its header. From the list you can rename a single region, remove it, or center the map on it. Delete all regions clears the whole list after a confirmation.
Once the report contains at least one region, a download button appears under the list and exports the regions as GeoJSON, so the same set can be reused in another report.
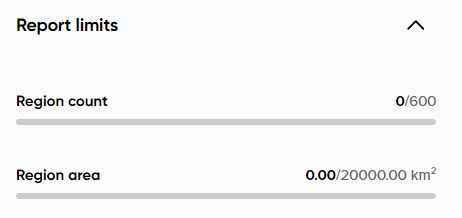
Report limits
The Report limits section at the top of the left panel tracks the report against the limits granted to your account, as two progress bars:
- Region count: how many regions the report contains.
- Region area: the total area they cover.
The default allowance is 600 regions and 3,000 km² per report; your account may be granted different values, and the section always shows the ones that apply to you. If your account also has a global area allowance, the area remaining in it is shown below the bars.
Turning on Origin - Destination only in the Regions settings section raises the region count limit three times, to 1,800 regions with the default allowance. The trade-off is that all regions then carry only the Origin and Destination roles, so the report contains no Via information.