Introduction
Important notes:
- This TomTom Orbis API is in Public Preview.
- This API is powered by the TomTom Orbis Maps.
- See the TomTom Orbis Maps documentation for more information.

What is the TomTom Orbis Maps Traffic API?
The Traffic API is a suite of web services designed for developers to overlay traffic information on maps for web and mobile applications. These web services can be used via RESTful APIs.
Traffic is displayed using tiles that can be overlaid on top of Map Display tiles, or as points on the map. The Traffic API distributes tiles in two formats. Find out more about these formats at Raster Versus Vector: Which Map Style Is Right for You?.
- Vector tiles. This means the the Traffic API returns traffic data to your client instead of traffic images.
- You can style and customize vector tiles using the Assets API.
- Raster tiles. This means the Traffic API returns traffic images instead of traffic data to your client. These images can be displayed without needing a renderer.
The Traffic API web services are based on the real-time traffic data TomTom Traffic™.
Vector Flow Tiles
The Traffic Vector Flow Tiles endpoint provides data on zoom levels ranging from 0 to 22. The service delivers traffic flow data packaged in a vector representation of squared sections called vector tiles.
Raster Flow Tiles
The Traffic Raster Flow Tiles endpoint provides data on zoom levels ranging from 0 to 22. The service delivers traffic flow data as a rendered image.
Incident Details
The Incident Details endpoint provides information on traffic incidents which are inside a given bounding box or whose geometry intersects with it. The freshness of data is based on the provided Traffic Model ID.
Vector Incident Tiles
The Traffic Vector Incidents Tiles API provides data on zoom levels ranging from 0 to 22. The service delivers traffic incidents data packaged in a vector representation of squared sections called vector tiles.
Raster Incident Tiles
The Traffic Raster Incidents Tiles API provides data on zoom levels ranging from 0 to 22. The service delivers traffic incidents data as a rendered image.
Getting started
Check these links to get started with the Traffic APIs:
How to get a TomTom API Key
When you use our location Service APIs, we need a way to identify that it is your application that is making the request to use the service (API).

Platform and tools
Platform and tools optimizes the retrieval of information via articles, blogs, FAQs, tutorials, and videos for your use and reference.
Features
Harness the power of TomTom Traffic™ for your application!
In both the Traffic Flow and Traffic Incident RESTful APIs, different road categories are displayed depending on the zoom level.
TomTom's Traffic Flow services
- Is updated every minute with very latest traffic speed information.
- Returns detailed information about traffic speed.
- Details include: current speed, freeflow speed, and quality indicator.
- The Vector Flow Tile API and Raster Flow Tile API provides traffic speed information for display on your map view.
- An option is provided to use the absolute or relative speed information.
TomTom's Traffic Incident services
- Is updated every minute with the very latest traffic incident and delay information.
- Returns detailed information about traffic jams and traffic related incidents.
- Details include: start-location, end-location, road-name, type of delay, length (in time) of the delay, significance, and distance.
- The Vector Incident Tiles and Raster Incident Tiles service provides traffic incident and delay information for display on your map view.
Endpoints
The Traffic API consists of the the following endpoints:
Traffic Flow Vector Tiles
The Traffic Flow Vector Tiles provides real-time traffic flow data.

Traffic Flow Raster Tiles
The Traffic Flow Raster Tiles provides real-time traffic flow data.
Traffic Incident Vector Tiles
The Traffic Incident Vector Tiles provides real-time traffic incidents data.
Traffic Incident Raster Tiles
The Traffic Incident Raster Tiles provides real-time traffic incidents data.
Traffic Incident Details
The Traffic Incident Details provides detailed information about present and planned traffic incidents.

Styles
Various styles are available for the display of traffic data. They can be customized to suit specific needs. The TomTom Orbis Assets API documentation explains how to do this.
flow-relative_light style overlaid on top of light style map tiles.

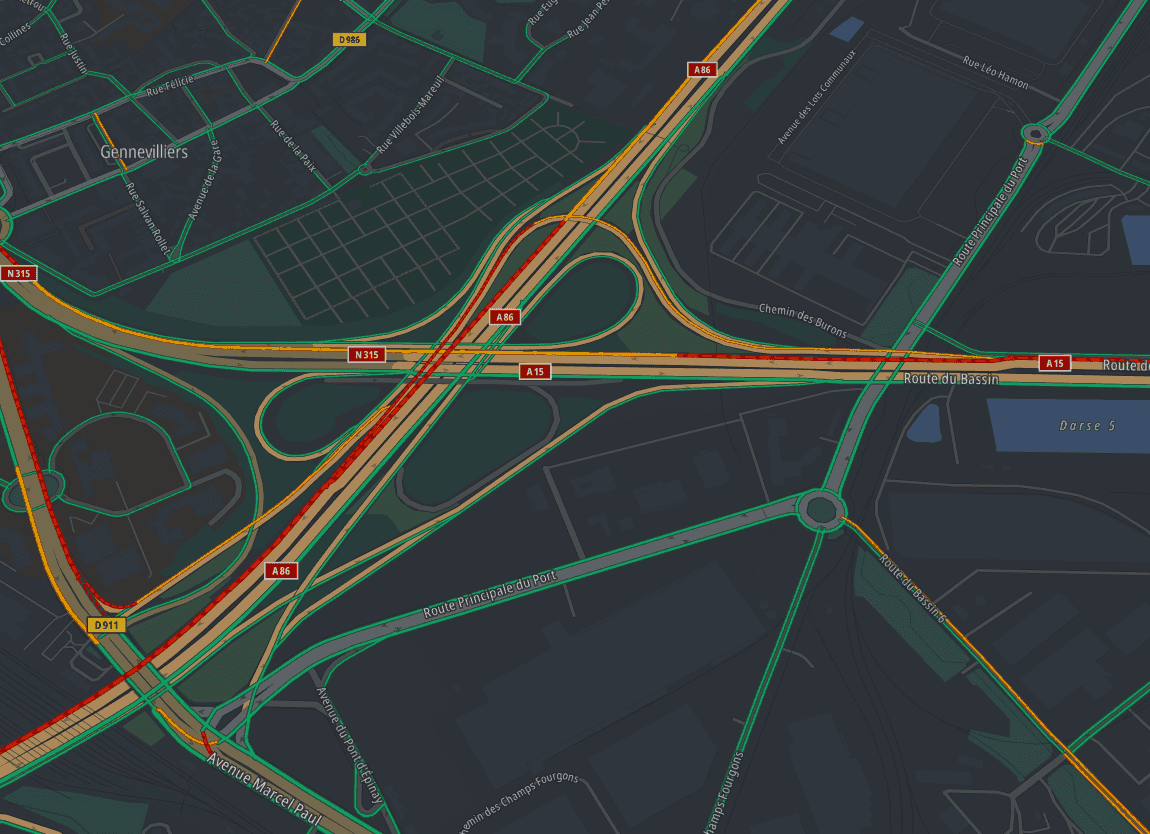
flow-relative_dark style overlaid on top of dark style map tiles.
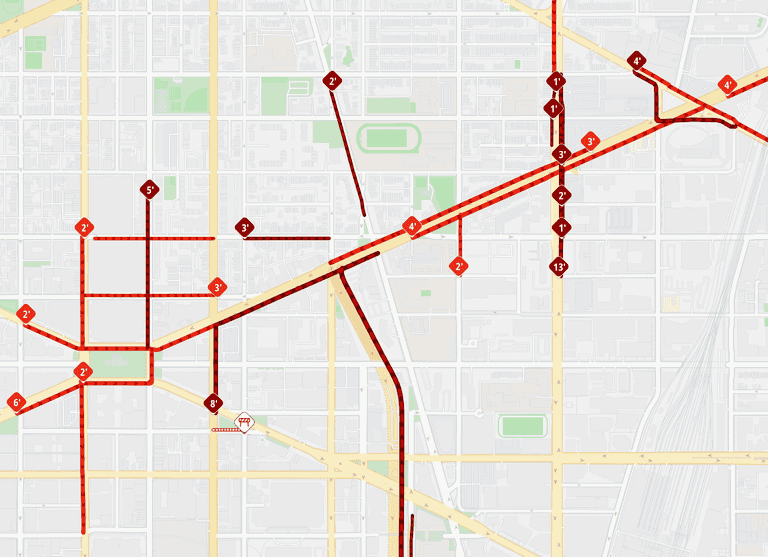
incidents_light style overlaid on top of light style map tiles.

incidents_dark style overlaid on top of dark style map tiles.

Common use cases you can implement
Display
- Real-time traffic incident data on a map.
- Real-time traffic segment speed data on a map.
- Traffic delay data with delay details like location, length, and delay.
- Segment details like free-flow speed, current speed, and confidence values.
- Obtain current traffic speed information with information about the real-time speed per road segment and display them on a TomTom map.
Indicate
- The severity of the current traffic condition with colored tubes indicating the delay severity.
- The accurate location of slowdowns with colored tubes indicating the delay severity.
Combine
The Traffic Flow Speed information with other real-time traffic information for a Traffic Management Monitoring application.