Using Traffic Data with Maps and Routes
) Jose Jose Rojas
Jose Jose Rojas
TomTom Live Traffic continuously monitors traffic flow and traffic incidents, and this information can be combined with TomTom's mapping and routing services to provide better routes and real-time traffic visualizations.
TomTom Live Traffic
With TomTom Live Traffic, traffic is continuously monitored to provide the most up-to-date information about traffic flow and traffic incidents. The traffic incident information includes the location, duration, and severity of traffic jams, accidents, road work, road closures and weather-related issues. The traffic flow information includes average speed and travel times for both current and ideal conditions.
In this article we will:
Take a look at the kinds of traffic information available through TomTom APIs
Review how TomTom provides map information to display routes and traffic
Explore traffic data available through TomTom map and routing APIs
Visualizing Traffic Information
TomTom collects and seamlessly aggregates a wealth of traffic information. This information covers 79 countries and is collected from over 600 million devices, with data sources including anonymized data from GPS devices, mobile phone signals, and sensors.
TomTom offers a suite of tools that allow developers to easily provide users with stunning visualizations to see delays and the location and severity of incidents at a glance. This same information is analyzed to provide intelligent routing decisions to help users avoid delays when traveling from A to B. Traffic data is also used to calculate travel times and ranges.
TomTom provides a robust set of APIs for visualizing traffic flow and traffic incident information. To understand how these services work together, we first need to quickly review how a map tiling system functions.
Working with Tiles and Layers
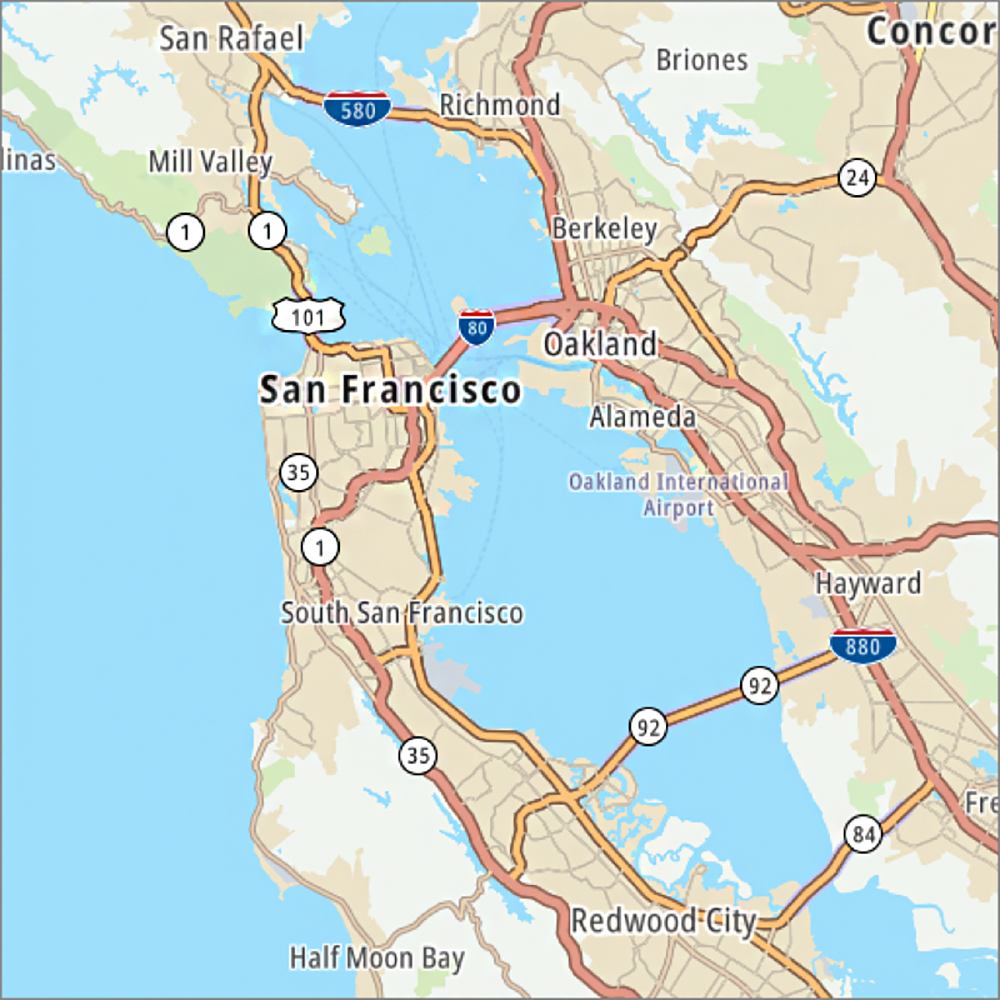
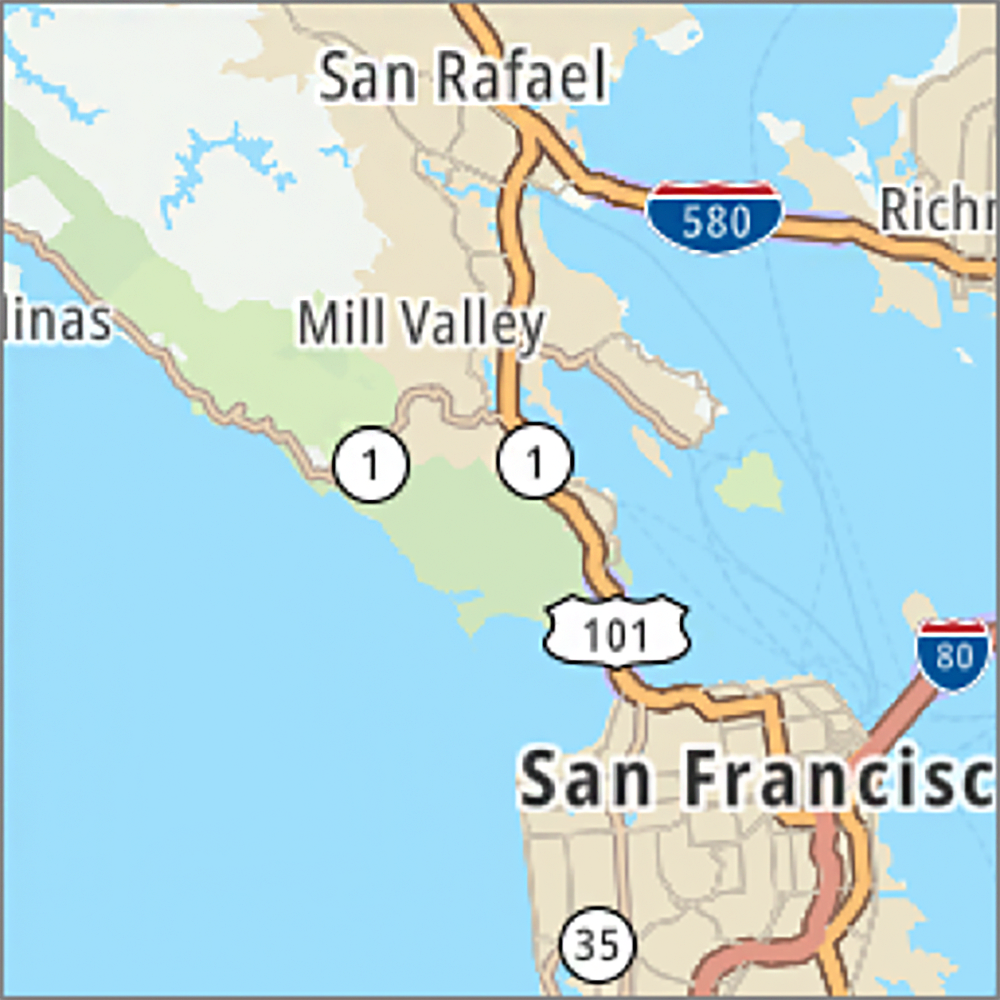
When TomTom displays a map, it retrieves the map in equal-sized “chunks” called tiles. Let’s consider the San Francisco region. If we view a map of this area returned by the TomTom Map Display API, we might see something like the following.
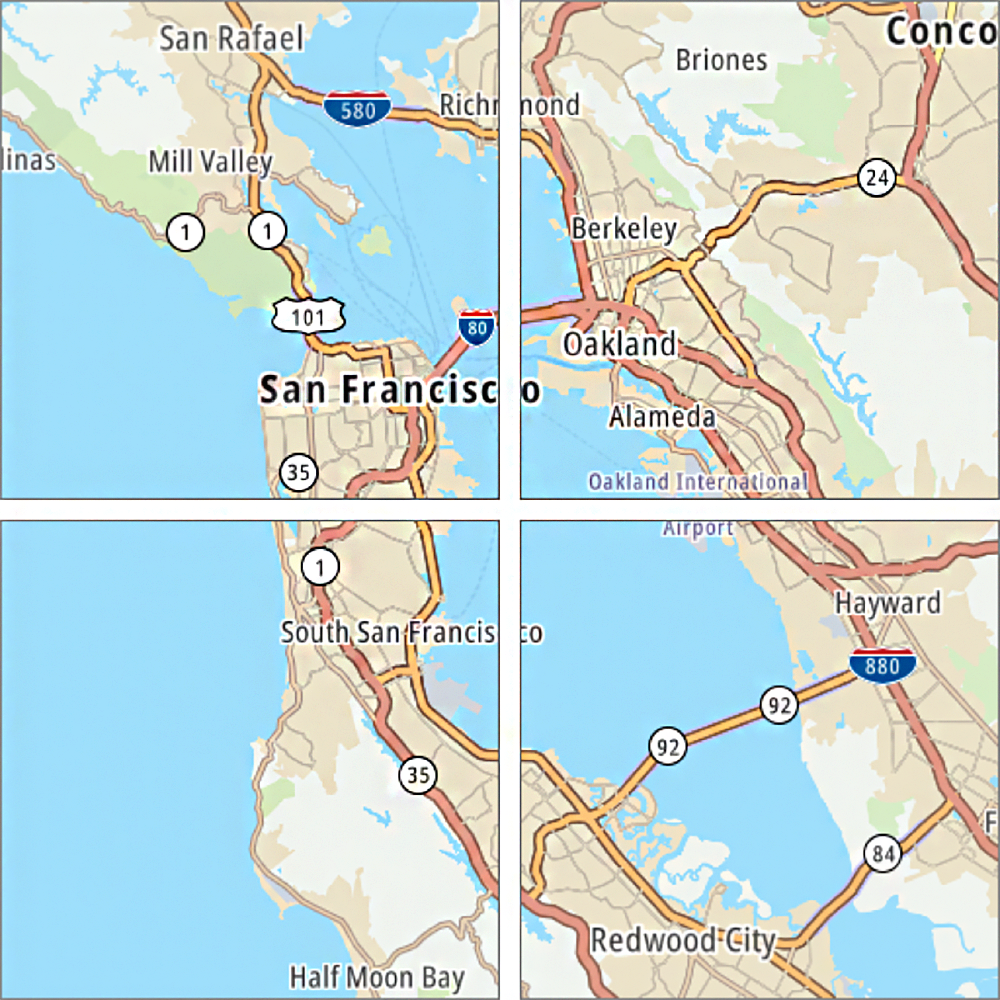
At this zoom level, the previous map actually consists of four separate tiles that are joined together. If we were to slightly separate each of these tiles, we could see where tile boundaries lay.
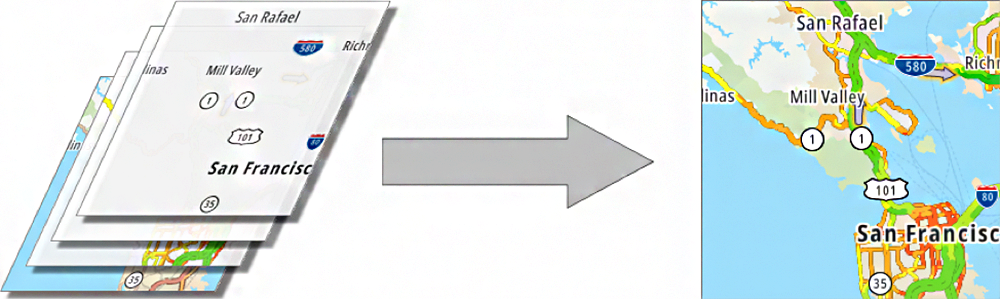
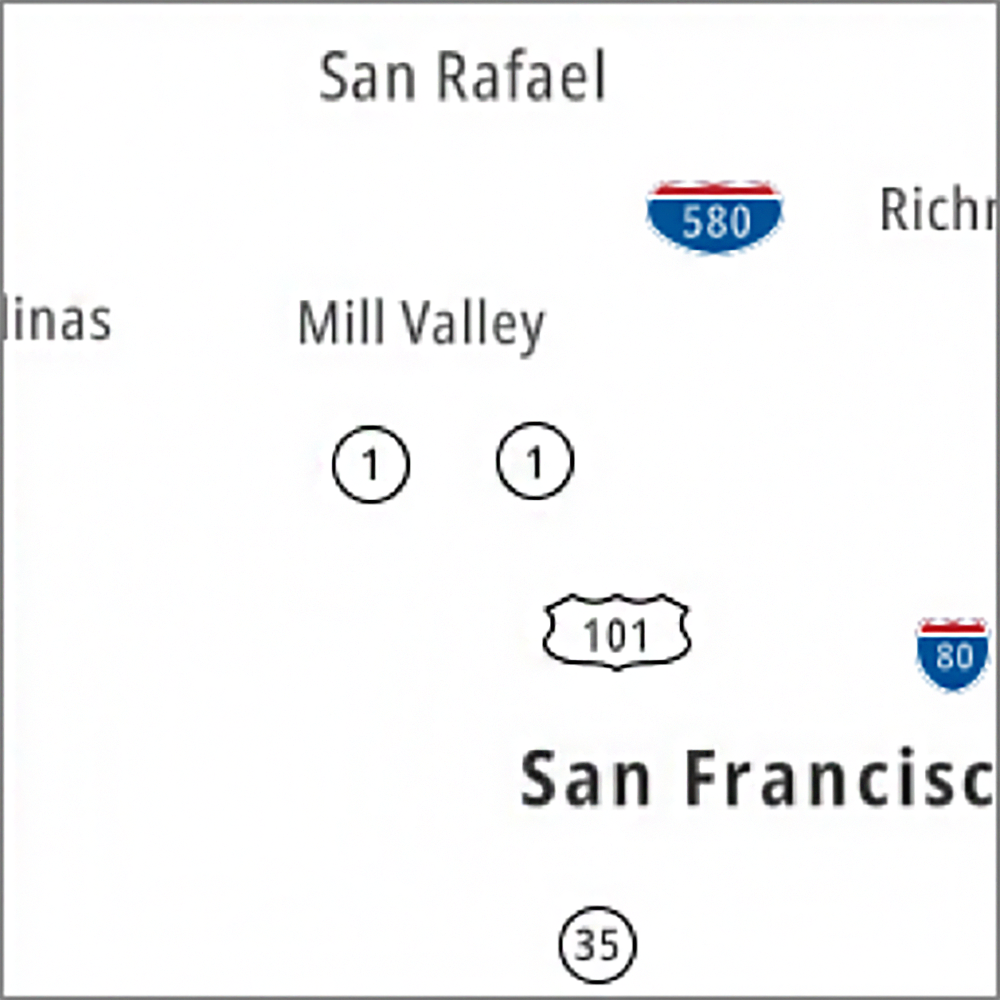
Let’s consider a single tile: the tile in the upper left corner of the previous map. This tile helps the user to visualize basic map information. There are other tiles, for this same location, that help to visualize different information (e.g. traffic flow). These visualizations can be layered together to provide a more nuanced view.

Above, we can see the different layers that are available. On their own, they can be a bit sparse. When combined, they allow the user to visualize a wealth of information quickly.
Each of the layers, except for the basic map layer, includes areas of the image that are transparent. This allows each of the layers to be stacked on top of each other, producing the image to the right.
An astute observer may notice that labels appear both in the basic map layer and the labels layer. The repetition is necessary. When traffic flow or traffic incidents are laid on top of the basic map, they may occlude some of the labels. This is the case following step 2 (below). The availability of the labels layer allows us to restore the occluded labels in step 3.

Increasing the Details
With maps, the zoom level affects the level of detail that is displayed. As the zoom level increases in the following series of maps, notice how the amount of information displayed also increases.
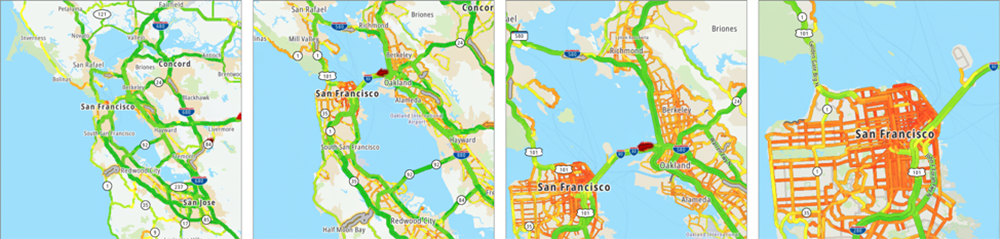
When far out, there are only hints of traffic issues in San Francisco. At the end of the series, the level of detail allows the user to see individual streets experiencing traffic issues.
Map Tiles
Requesting raster tiles from the API is relatively simple. There is a high degree of similarity in the format of the required elements of the URLs for both the Maps and Traffic APIs. In each case, the format is as follows:
http(s)://baseURL/service/versionNumber/tile/type/style/zoom/X/Y.format?key=API_KeyFor example, to request each of the possible layers for the San Francisco area, the correct URLs would be as follows (with your actual TomTom API key substituted for the text “API_Key”):
Basic:

Hybrid:
Labels:

Incidents:

Flow:
Vector Tiles
The TomTom API also provides the capability to request vector tiles. Instead of providing a pre-drawn image, these tiles (essentially) provide instructions for drawing the image yourself. The URLs for requesting these files are nearly identical to those used when requesting a raster tile.
Advantages of Using an SDK
While the APIs get you the information that you need, they do not address the complexities of a user interface. Thankfully, in addition to the APIs described in this article, TomTom also provides excellent Software Development Kits (SDKs) for a number of platforms (Web, Android, and iOS).
In addition to simplifying user interfaces, these SDKs shield the developer from many of the following complexities:
Compositing of multiple tile layers into a single tile image.
Assembling multiple nearby tiles into a single coherent map.
Overlaying additional information (e.g. markers).
Transforming coordinates between multiple coordinate systems: EPSG 3857 (web Mercator), EPS 4326 (latitude/longitude), tile coordinates (when requesting tiles), and pixel coordinates (when displaying information).
Rendering (or displaying) vector tiles.
For example, the following source code will show a map of San Francisco including traffic flow and traffic incidents layers. Don't forget to replace the "API_KEY" text with your own!
<!DOCTYPE html>
<html>
  <head>
     <link rel='stylesheet' type='text/css' href='https://api.tomtom.com/maps-sdk-for-web/cdn/6.x/6.11.0//maps/maps.css'>
     <script src="https://api.tomtom.com/maps-sdk-for-web/cdn/6.x/6.11.0/maps/maps-web.min.js"></script>
     <style> #map { height: 512px;  width: 512px;  }
</style>
  </head>

  <body>
      <div id='map'></div>
      <script>
         tt.setProductInfo('<your-product-id>', '<your-product-version>')
          var map = tt.map({
          key: 'API_KEY',
          container: 'map',
          center: { lat: 37.81005, lng: -122.41773 },
          zoom: 12,
          pitch: 50,
          stylesVisibility: {
            trafficIncidents: true,
            trafficFlow: true
          }
        })
      </script>
  </body>
</html>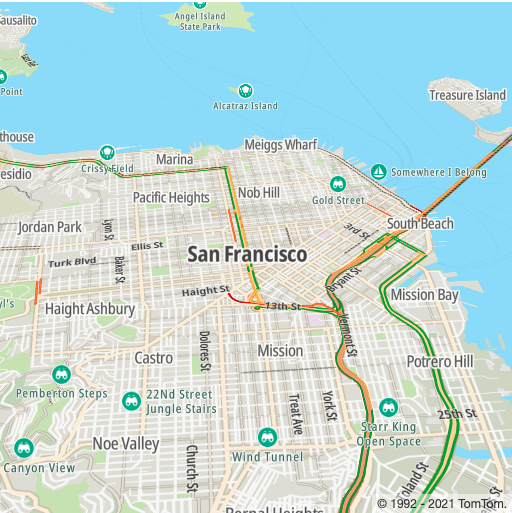
You can see the results of the code in the image above.
Traffic Details
While the TomTom API provides exceptional visualizations, sometimes you may need to dig even deeper. Thankfully, the API provides traffic information in the JSON or XML format, with even greater levels of detail than what is possible in a visualization.
Let’s consider the following map from the Boston, Massachusetts area, where we are including the Basic, Traffic Incident, and Labels layers. The Traffic Flow layer is omitted to help us better focus on traffic Incidents.

When we examine this map, we’ll notice the traffic incidents displayed as arrows in four different colors. The head of the arrow indicates the end of the incident and its opposite side indicates the beginning of the incident. The color coding is as follows:
 Unknown (0) or Undefined (4) – the delay caused by this incident is unknown or indefinite.
 Minor (1) – the delay caused by this incident is minor.
 Moderate (2) – the delay caused by this incident is moderate.
 Major (3) – the delay caused by this incident is major.
The previous map still presents a little bit too much information for us to dig deeper. From here on, we’ll focus on the following single tile from the upper left corner of the previous map.

In this tile, there are three traffic incidents: one is south of Derry and the other three are clustered near Andover. By requesting the incident detail from the Traffic API, we can find out more information about these incidents.
If there were no incidents in the region, the JSON response from the API would look as follows.
{
  "tm": {
    "@id": "1557529120",
    "poi":   }
}
If a traffic incident had occurred, it would appear as a JSON object within the “poi” array and be similar to the following:
{
  "id": "TTR81926518760064",
  "p": { "x": -7940794.9168659, "y": 5289584.3967859 },
  "op": { "x": -7940447.5022704, "y": 5290596.5511616 },
  "ic": 9,
  "ty": 0,
  "cs": 0,
  "d": "roadworks",
  "c": "new roadworks layout",
  "f": "NH-102/Nashua Rd/Exit 4 (I-93)",
  "t": "NH-111/Indian Rock Rd/Exit 3 (I-93)",
  "l": 6282,
  "r": "I-93"
}
Here, we see that road work is occurring to implement a new road work layout. The road work is occurring on route I-93 from NH-102/Nashua Rd/Exit 4 (I-93) to NH-111/Indian Rock Rd/Exit 3 (I-93).
Traffic Flow Details
The Traffic API also allows developers to request traffic flow detail for any road segment. Let’s consider the following map from the Toronto area.

When traffic flow detail is requested, it is necessary to specify the road segment you want information about. This is done by providing a latitude and longitude on or near the road segment. In this example, we’ve chosen the location on Pearl Street (latitude 43.648125 and longitude -79.385877) indicated by the blue dot. The response from the Traffic API to this request is as follows:
{
  "flowSegmentData": {
    "frc": "FRC6",
    "currentSpeed": 11,
    "freeFlowSpeed": 11,
    "currentTravelTime": 132,
    "freeFlowTravelTime": 132,
    "confidence": 0.93,
    "coordinates": {
      "coordinate": [
        { "latitude": 43.64834456714371,  "longitude": -79.38522694127332 },
        { "latitude": 43.648312029614374, "longitude": -79.38535988662035 },
        { "latitude": 43.648221176171454, "longitude": -79.38581670828187 },
        { "latitude": 43.648093534999674, "longitude": -79.38638897774021 },
        { "latitude": 43.647998525497734, "longitude": -79.38684125996943 },
        { "latitude": 43.64791268872469,  "longitude": -79.38724768865437 },
        { "latitude": 43.64765850161588,  "longitude": -79.3884527598657 },
        { "latitude": 43.647573895981495, "longitude": -79.3887885056012 },
        { "latitude": 43.64735328303331,  "longitude": -79.3898074544042 },
        { "latitude": 43.64730360762897,  "longitude": -79.39003679126628 }
      ]
    },
    "openlr": "C8eMXh8J7DPWBv4f/5gzBg==",
    "@version": "traffic-service 2.0.004"
  }
}
Here we see that road is a local road (classification "FRC6") and that traffic conditions are ideal, with the current speed and travel time equal to the free flow speed and travel time.
The following map shows the locations in the response, with the green dot indicating the first location, yellow dots indicating intervening locations, and the red dot indicating the final location in the array.

Next Steps
Requesting traffic flow detail is relatively simple. As you can see, the TomTom APIs and SDKs take the complexity out of requesting maps that display traffic information and routes that get you to your destination quickly based on current traffic status. For more advanced scenarios, developers can take advantage of a wealth of information available from incident data and map layers to create unique maps and visualizations.
Check out our Q&A on how traffic is built below:
YouTube video playerLastly, here are some suggested related articles to read:
- How To Add Traffic APIs to Your Location-Based App
- Understanding How TomTom Handles Data Used by the Traffic API
- Build a Traffic Alert Dashboard with the TomTom Traffic API
Happy mapping!