Layers
The layers tab provides an advanced mechanism for overriding properties set in the Foundations and Modules tabs. We recommend using Layers only if the Foundations and Modules tabs do not allow you to achieve the desired effect.
Before reading further, make sure you are familiar with the Layers concept.
In this guide you will learn how to change layer visibility, order, and other properties.
Visibility of layers
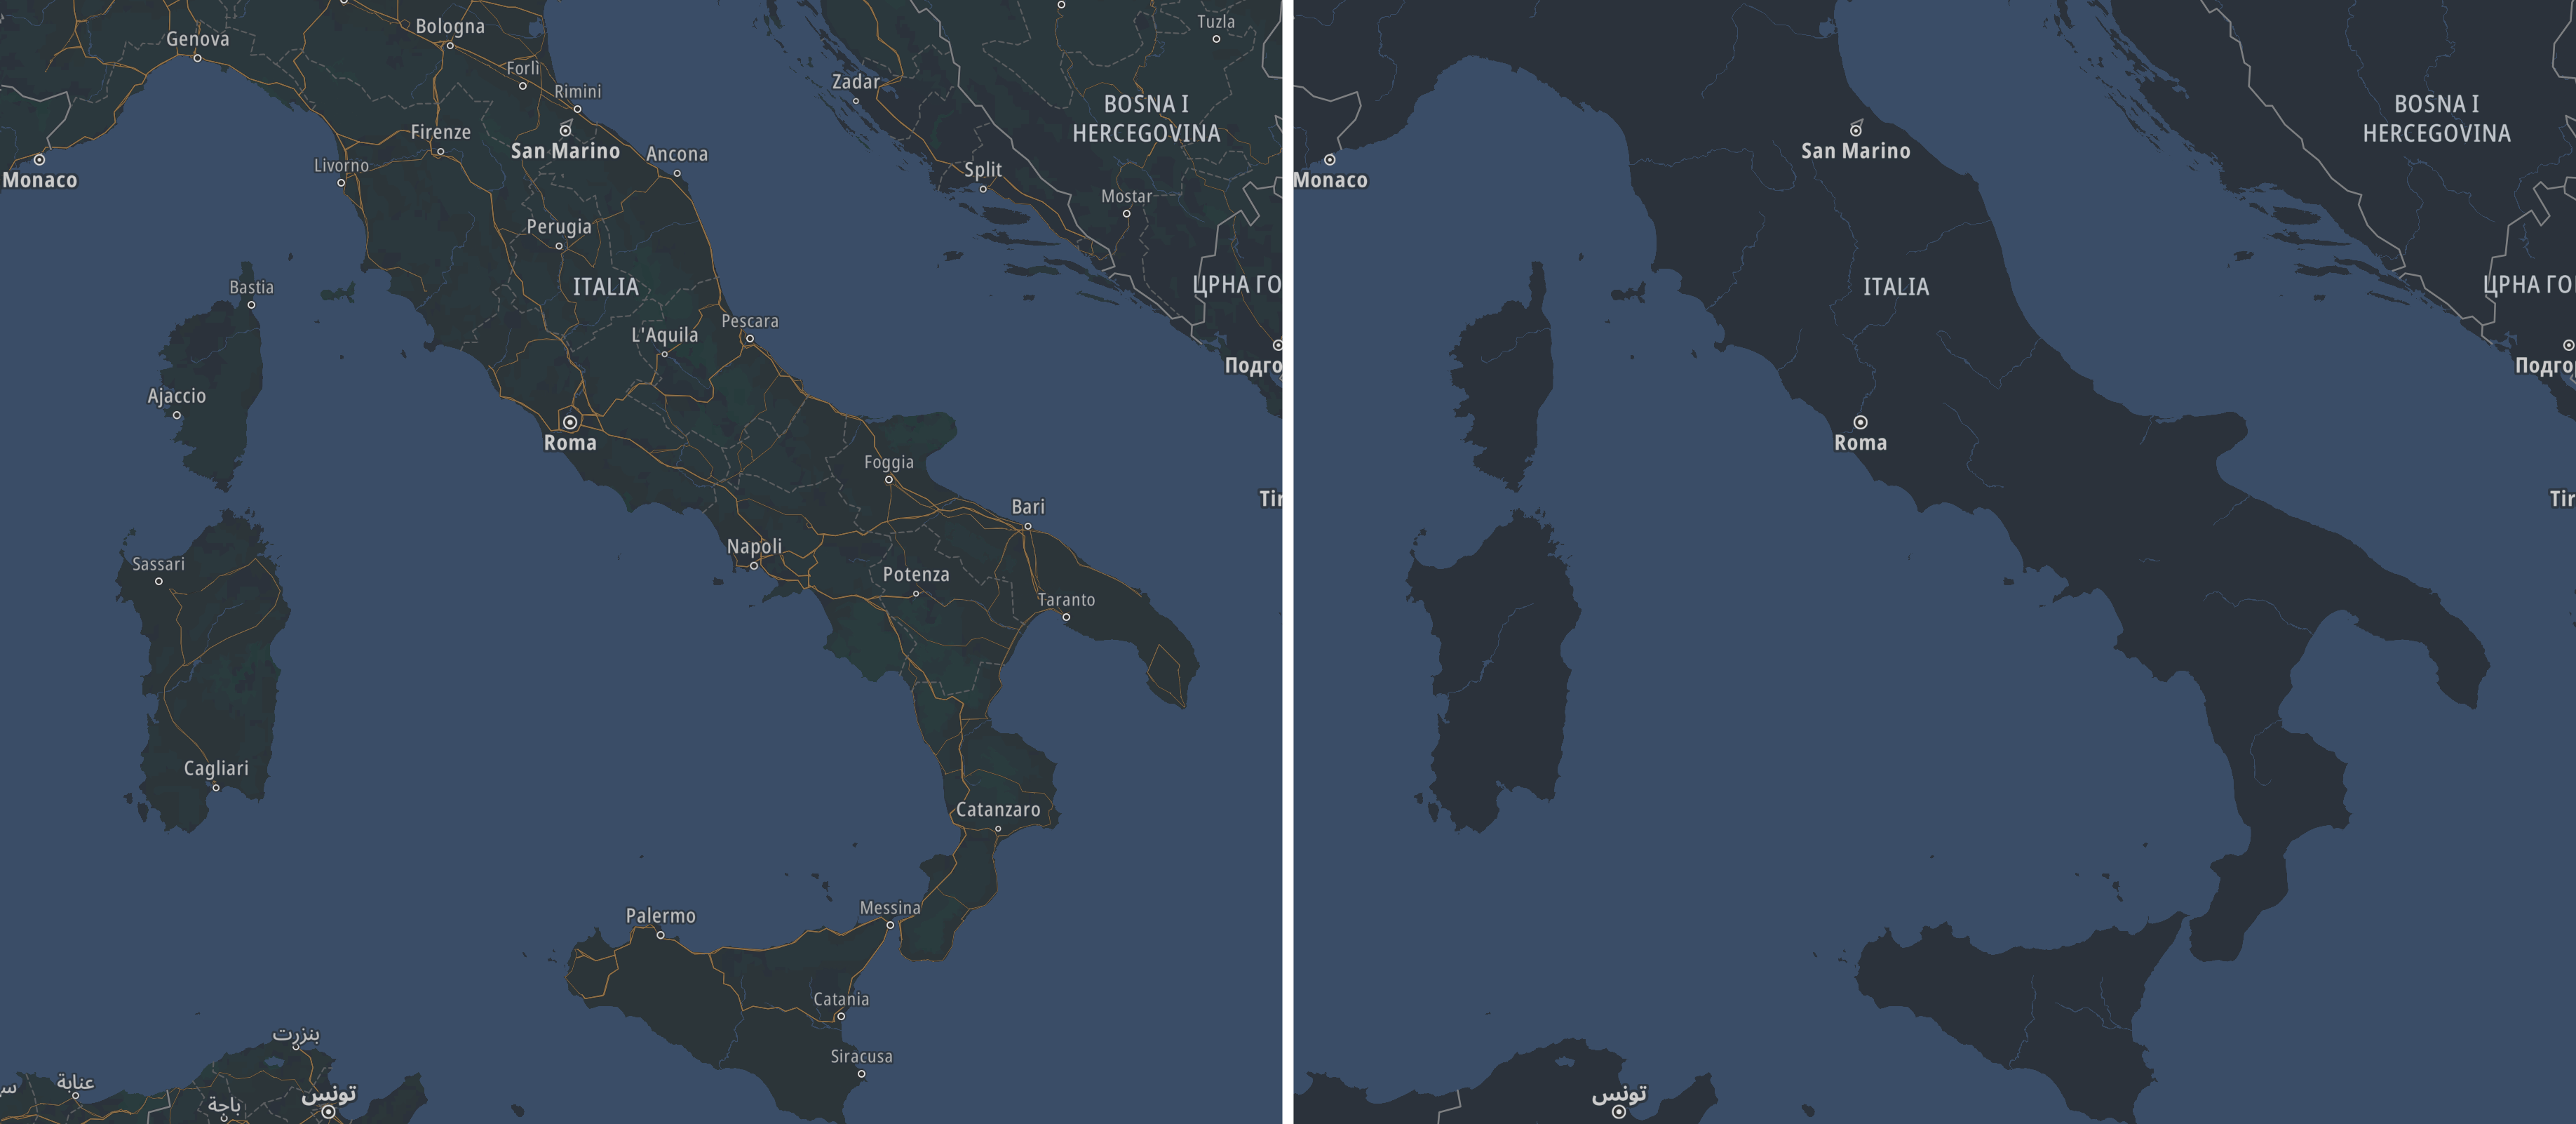
The visibility of the layer defines if the layer is displayed on the map. You can hide or show any layer. For example, you might want to hide some layers to make some features of the map stand out.
Follow these steps to change the visibility of the layer:
- Open a style.
- Click the Layers tab.
- Hold the pointer over the layer whose visibility you want to change.
 Hide Layer appears.
 - Click Hide Layer and notice that the layer is no longer displayed on the map.
When the layer is hidden and you hold the pointer over it,
 Show Layer is shown next to the layer name.
 - To make the layer visible again, hold the pointer over it and click Show Layer.
Order of layers
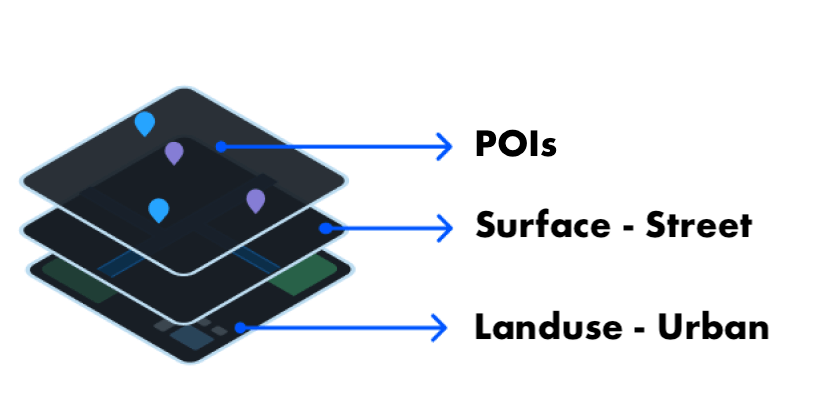
Each layer of the map contains visual information. The order of the layers determines in which order this information will be painted on the map. The order of layers is represented by the layer list in the Layers tab.
If we consider two layers:
- a layer higher in the list will be displayed on the top
- a layer lower in the list will be displayed at the bottom
For example, map layers responsible for displaying labels and POIs are usually at the top of the layer list; therefore, they are displayed over the other layers and are easily readable.
Follow these steps to change the order of the layers.
- Open a style.
- Click the Layers tab.
- Find the layer whose order you want to change.
- To activate dragging, click the layer name and hold the mouse button. The layer outline will change.
- Drag the layer to the desired place in the layer list. The order of layers will change. Observe how the order of appearance changes on the map.
Linked layer properties
By default the layer properties of the TomTom map styles are linked to the Foundations and Modules. Map Maker calculates the individual property values based on Foundations and Modules settings. This is why, if you want to change the layer property, you need to unlink it first. By unlinking, you break the connection. Changes made in Foundations and Modules will not affect unliked property anymore. You can always link it back if you change your mind.
Linked layer properties:
- Cannot be modified.
- Follow the changes from the Foundations and Modules (are calculated from them).
Unlinked layer properties:
- Can be modified.
- Do not follow the changes from the Foundations and Modules (are independent).
Link and unlink property
Follow these steps to unlink the layer property:
-
Open a style.
-
Click the Layers tab.
-
Click the layer you want to change (for example Landuse - Park).
-
Find a property in the Layer Editor (for example Color).
-
The property's input box is disabled; it cannot be edited. Hold the pointer over a layer property,
 Unlink appears next to the property.
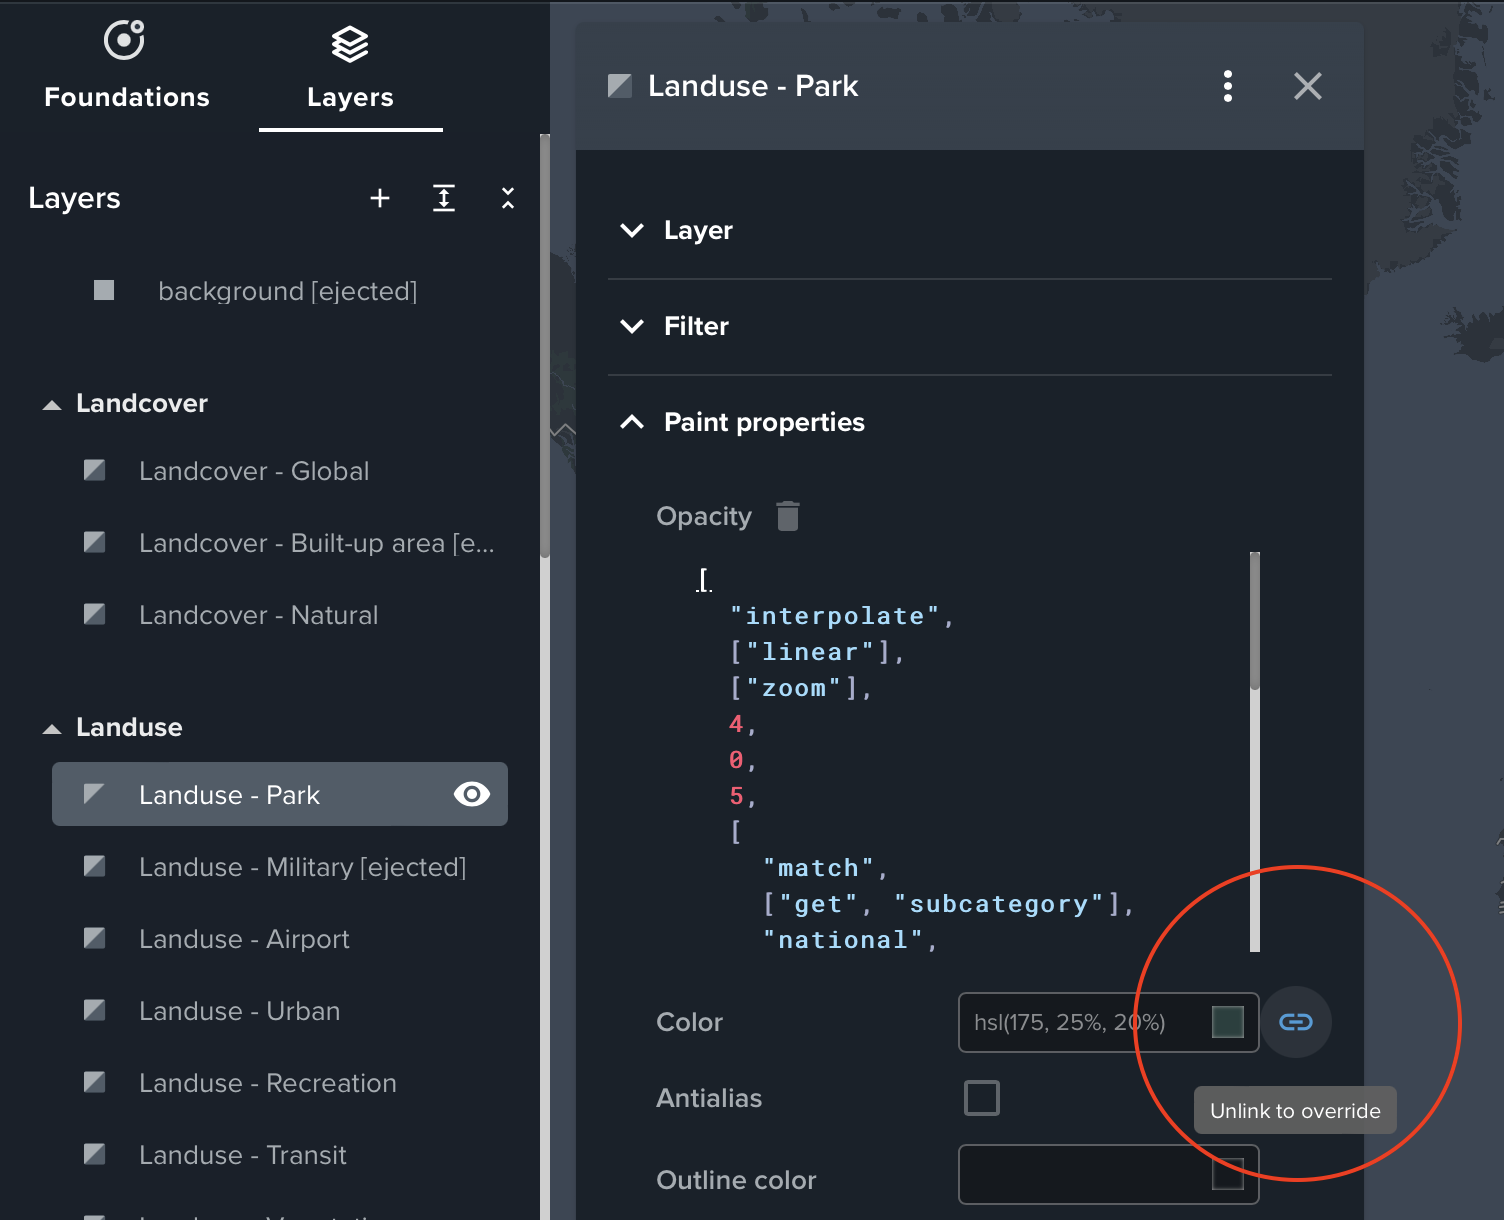
-
Click
Unlink. -
Now you can modify the property's value.
When a property is unlinked,  Link is shown next to it.
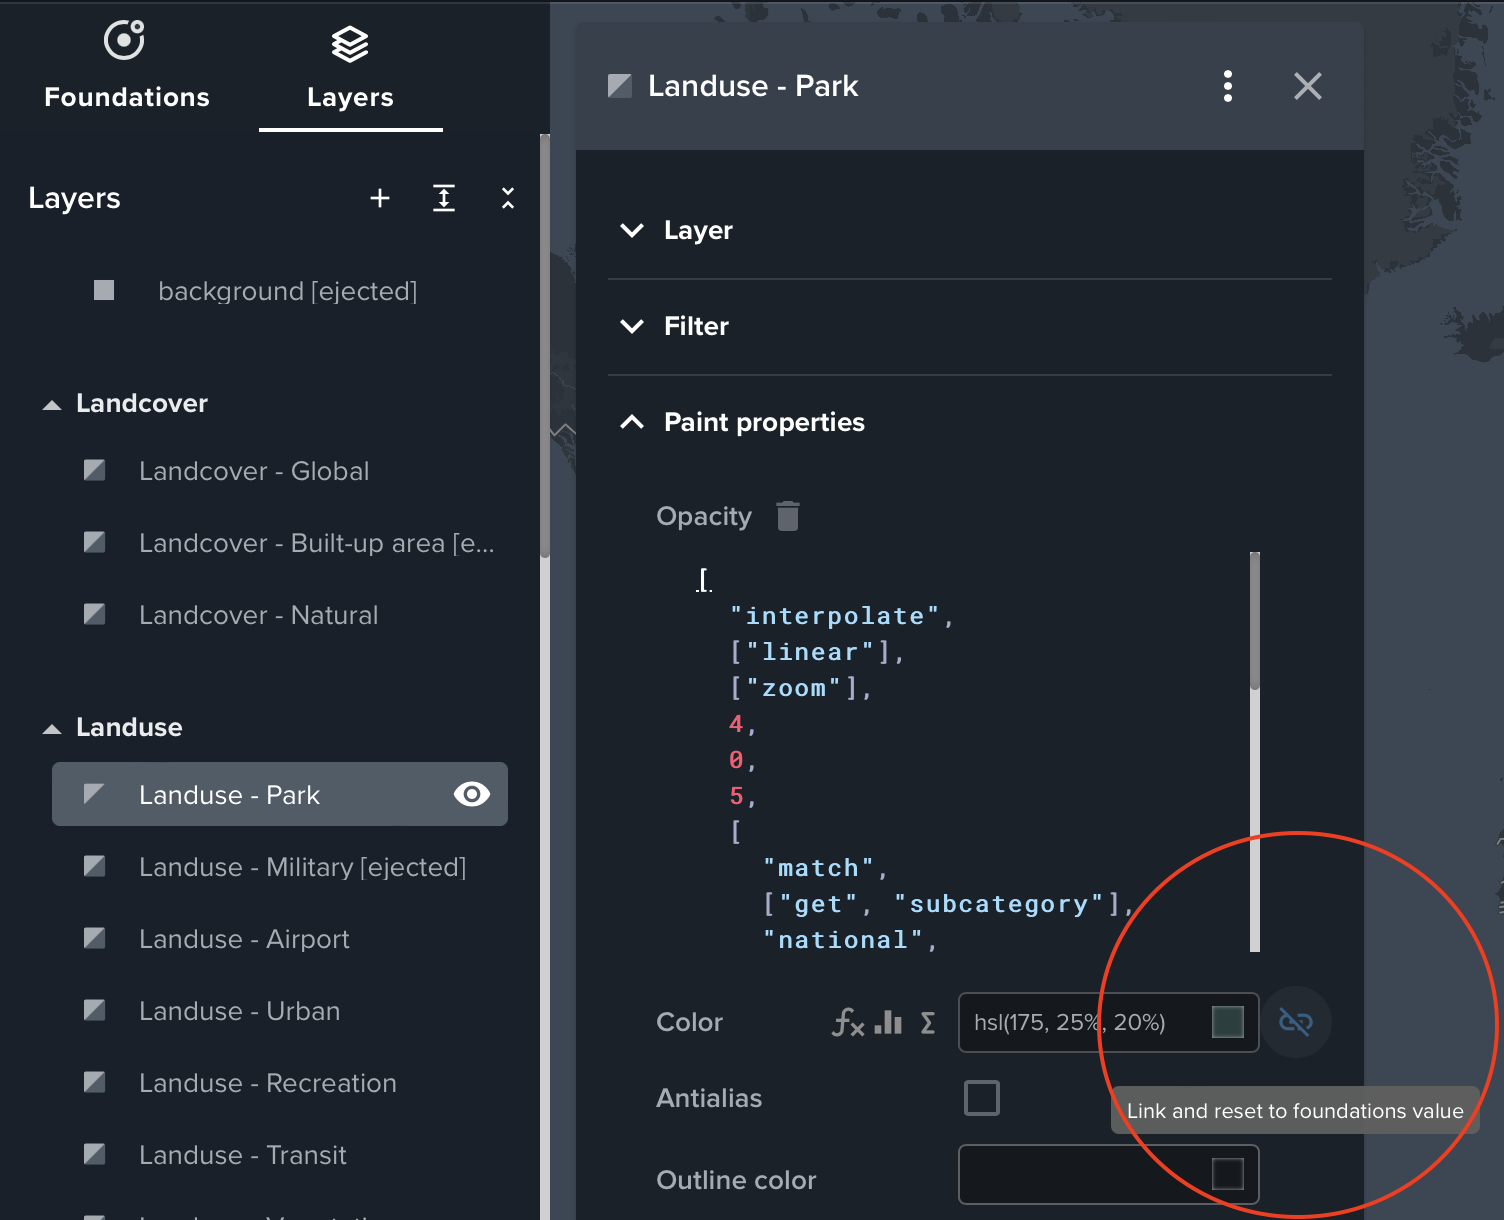
To reset the property to take value from Foundations and Modules, click Link.
Please note that changes you have made to the property will be lost.
Property types
Layer property can be specified as:
- constants
- expressions
- stops
Constants

Constant allows you to define a property as a single value (for example number: 0.5, or color: #001122).
You can read more about types of values in MapLibre Style Specification > Types.
Expressions
Expression makes a property dynamic. For example, the Color property specified as an expression can change value based on zoom level or a feature property.
Stops
Stops are another way to define the expression. With stops, you can define the property based on zoom level, as a zoom level and a property's value pairs.
Color and opacity
Follow these steps to change the color and opacity of the layer:
-
Open a style.
-
Click the Layers tab.
-
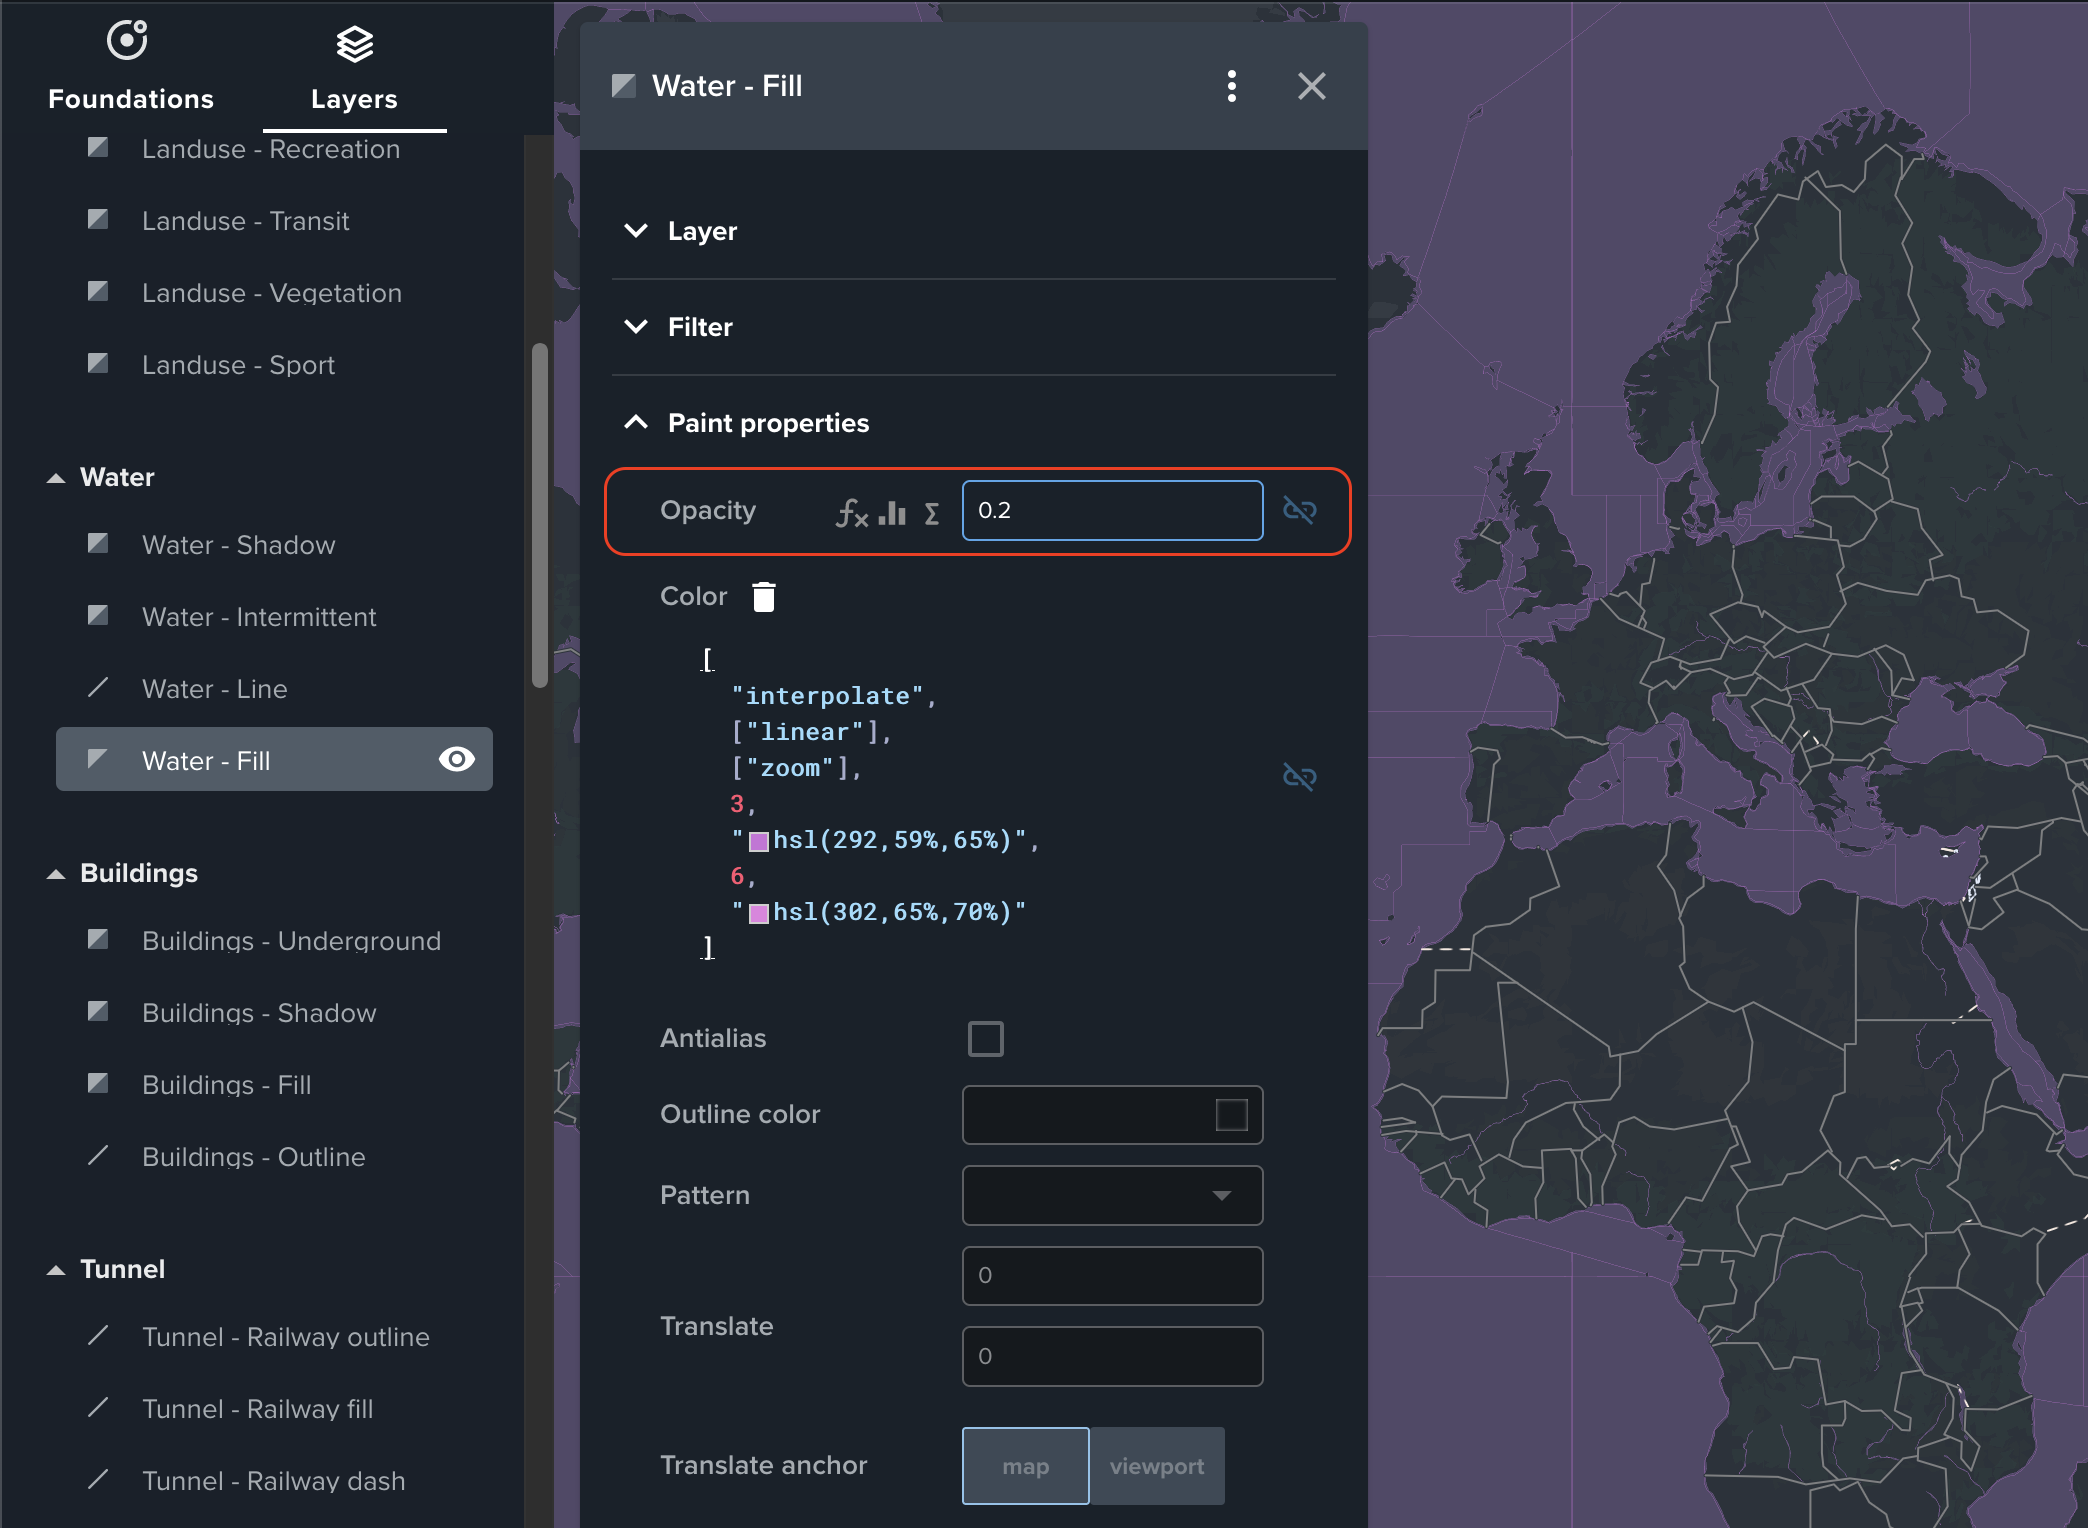
Click the layer you want to change (for example, Water - Fill).
-
Find Opacity and Color properties in the Layer Editor.
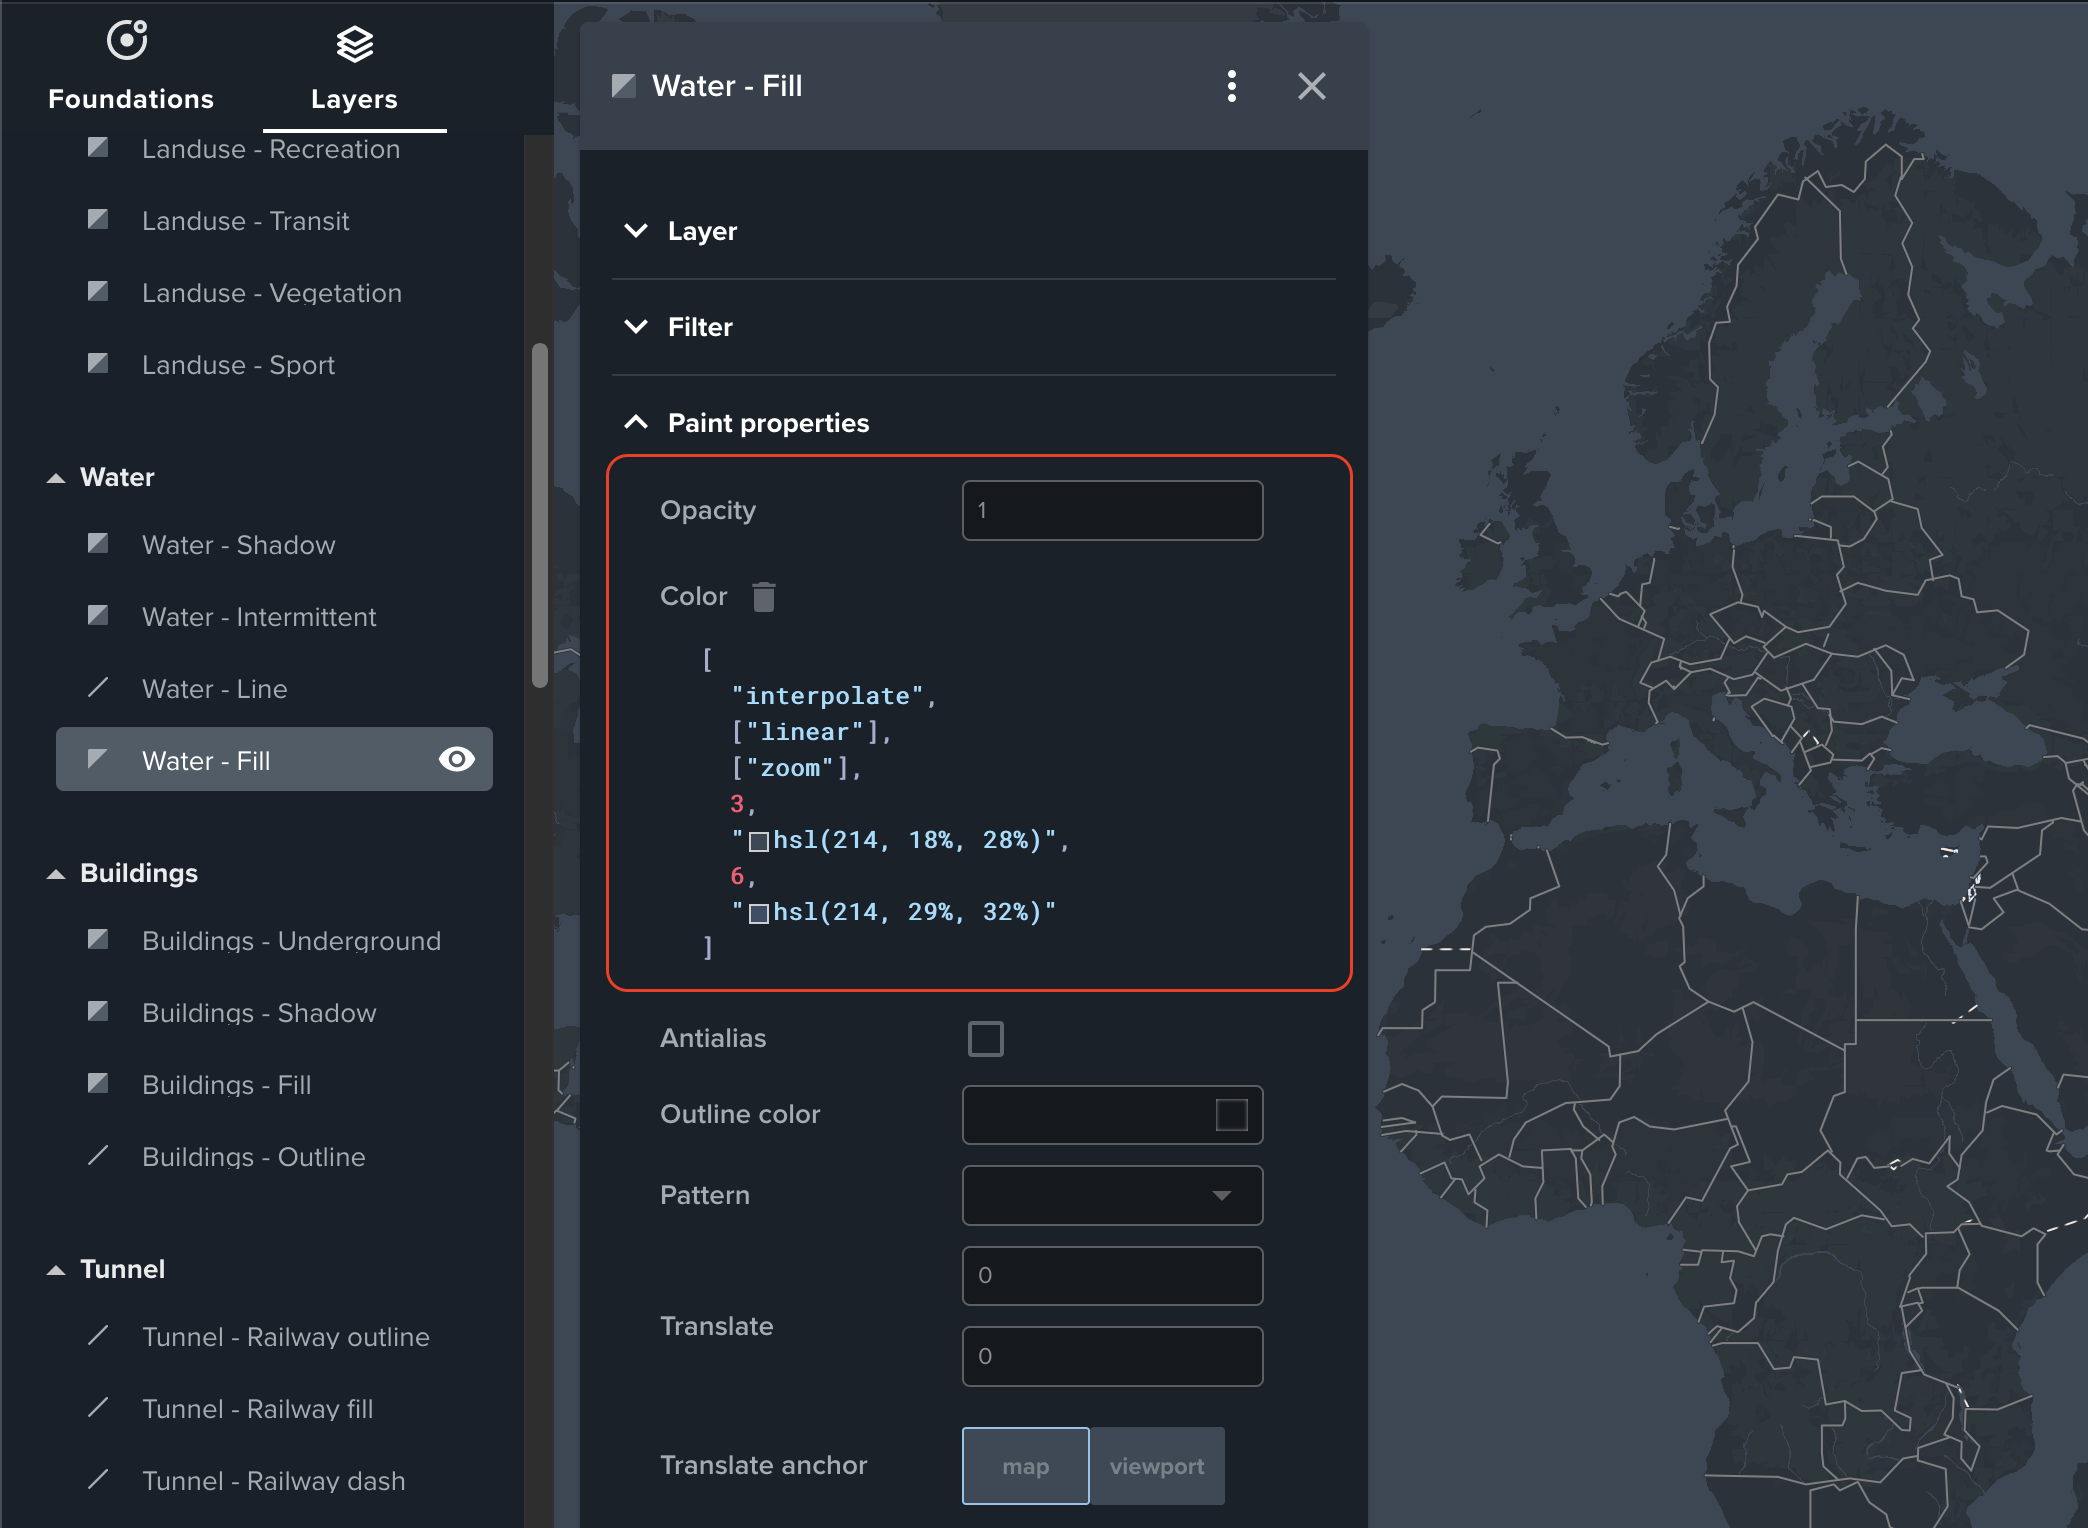
In the example, Opacity is defined as a constant, and Color as an expression.
-
Unlink Color and Opacity properties by clicking
Unlink. -
Change the Color property value. You can do it by:
- using the color picker, which will appear after clicking on the color square
- entering the color value
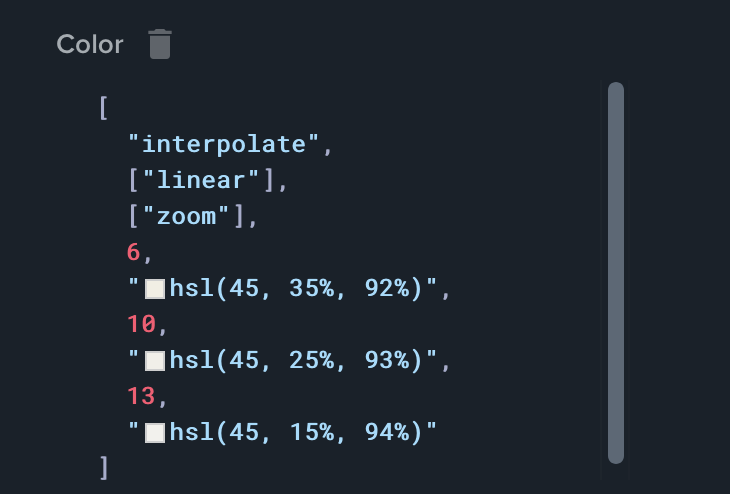
Notice that if the Color is defined as an expression, multiple color values represent this property.
Read more about accepted color types in MapLibre Style Specification > Types > Color.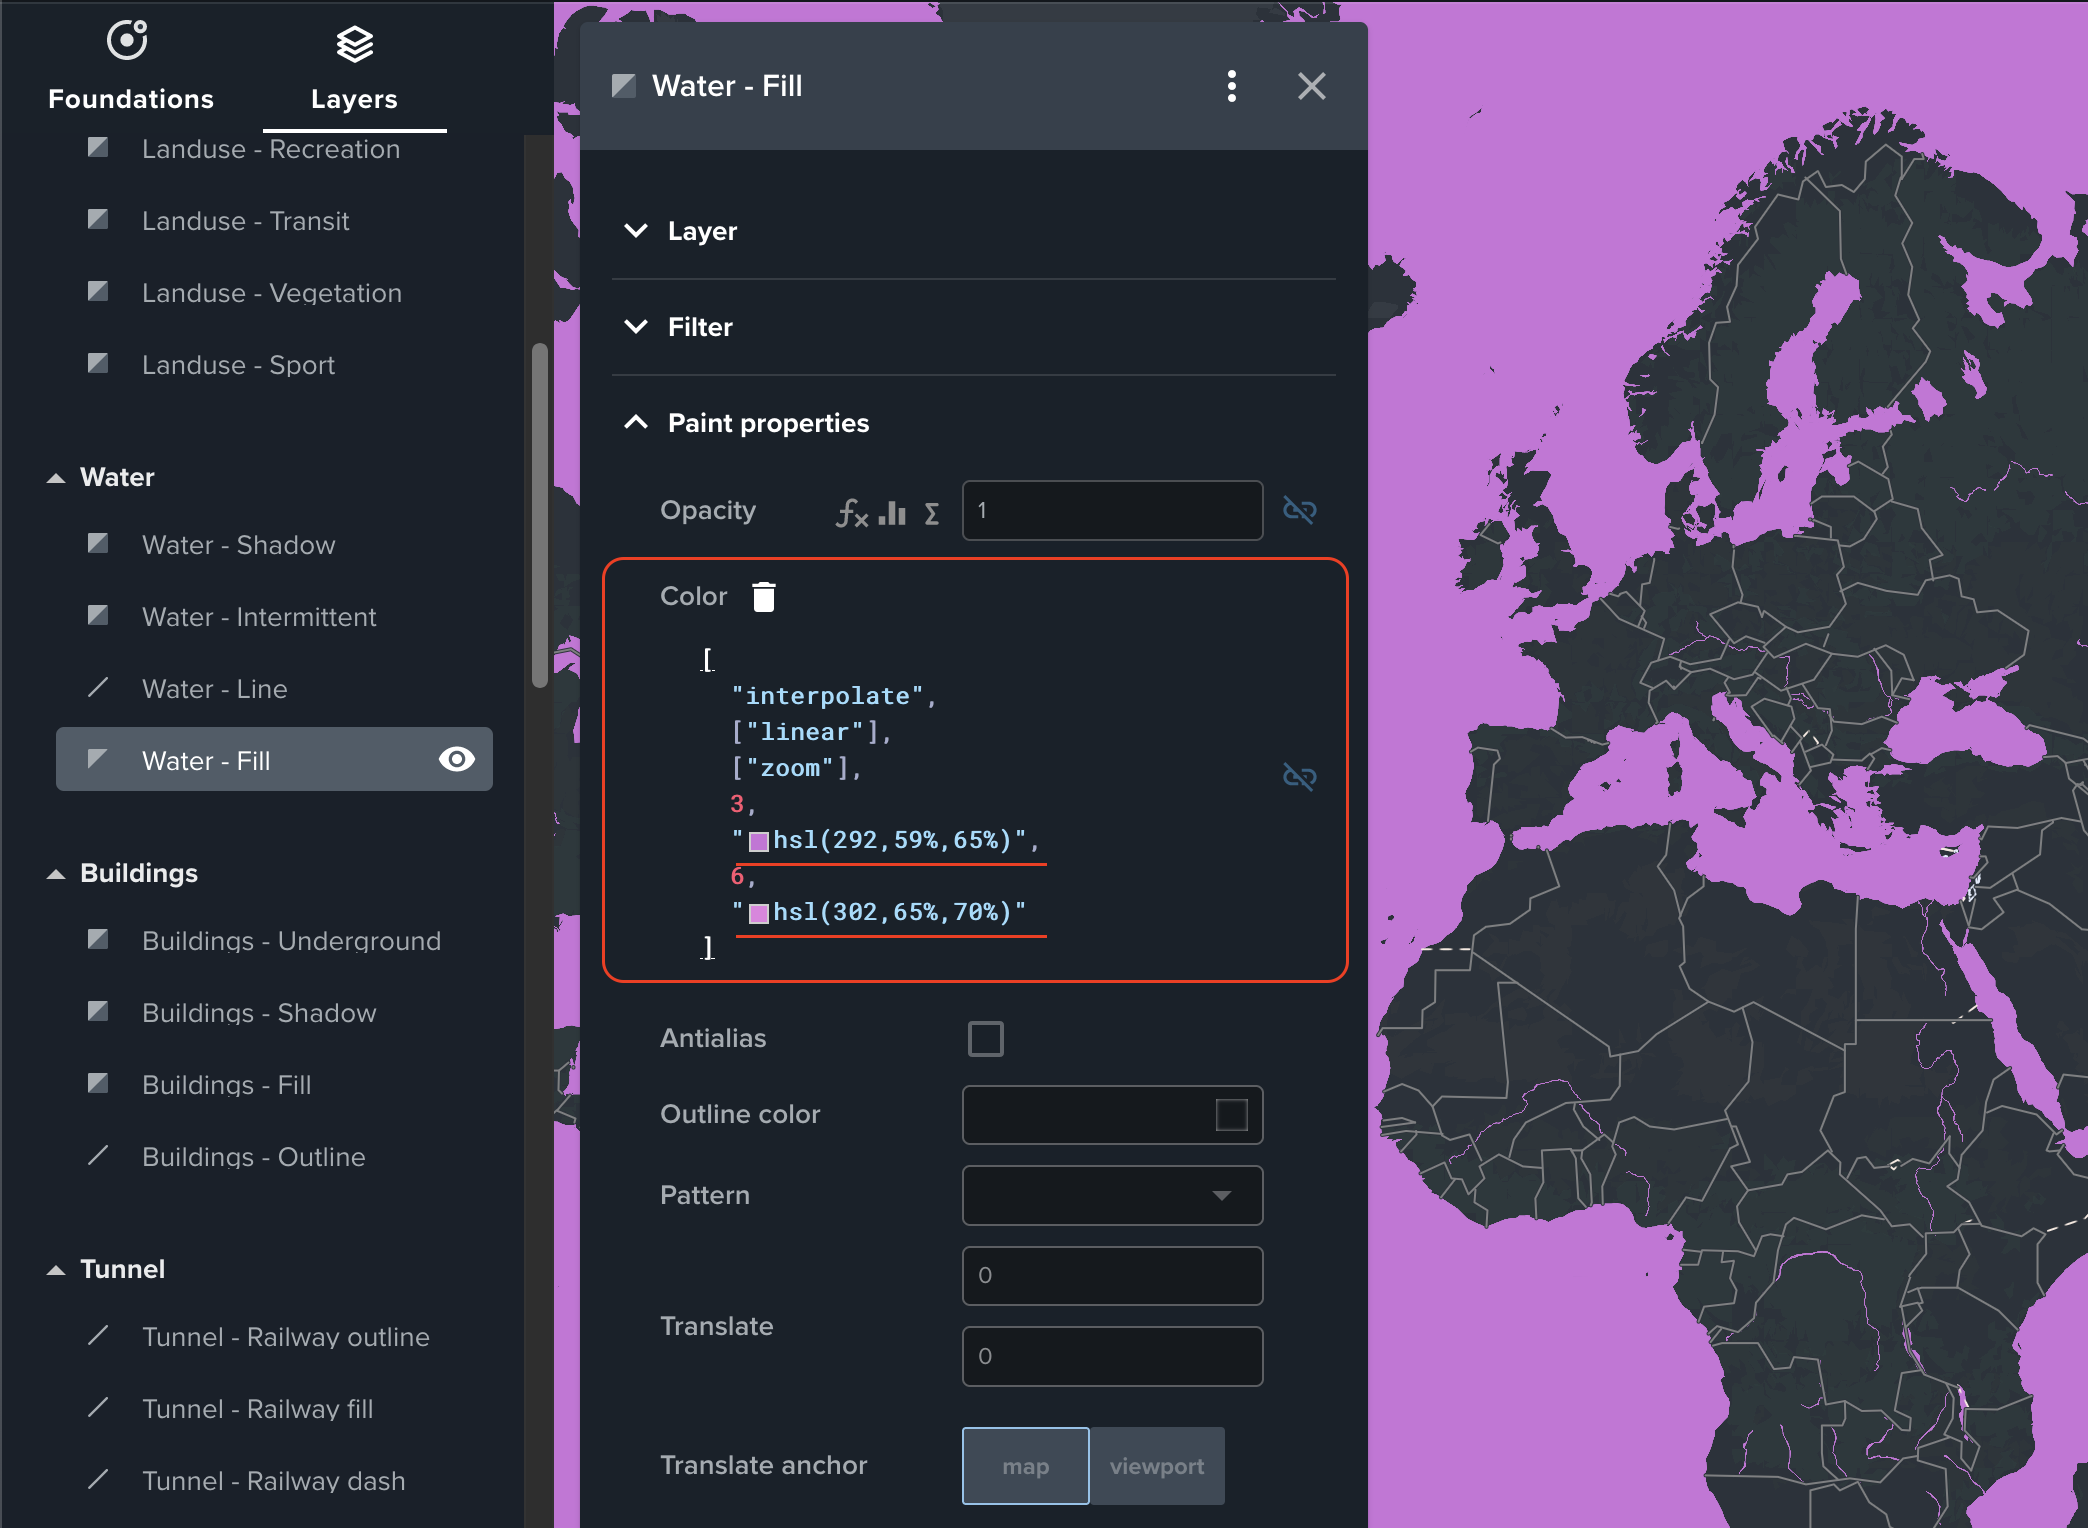
-
If you want to set constant value, you can clear the expression. To clear the expression click
 Clear.
 -
Change the Opacity property. Enter the value between 0 (fully transparent) and 1 (fully opaque).
You can always reset a property to the theme value by linking it again. Please note that all changes will be lost.
Line width and dash pattern
If the layer type is Line, you can modify the line width and dash pattern.
Dasharray
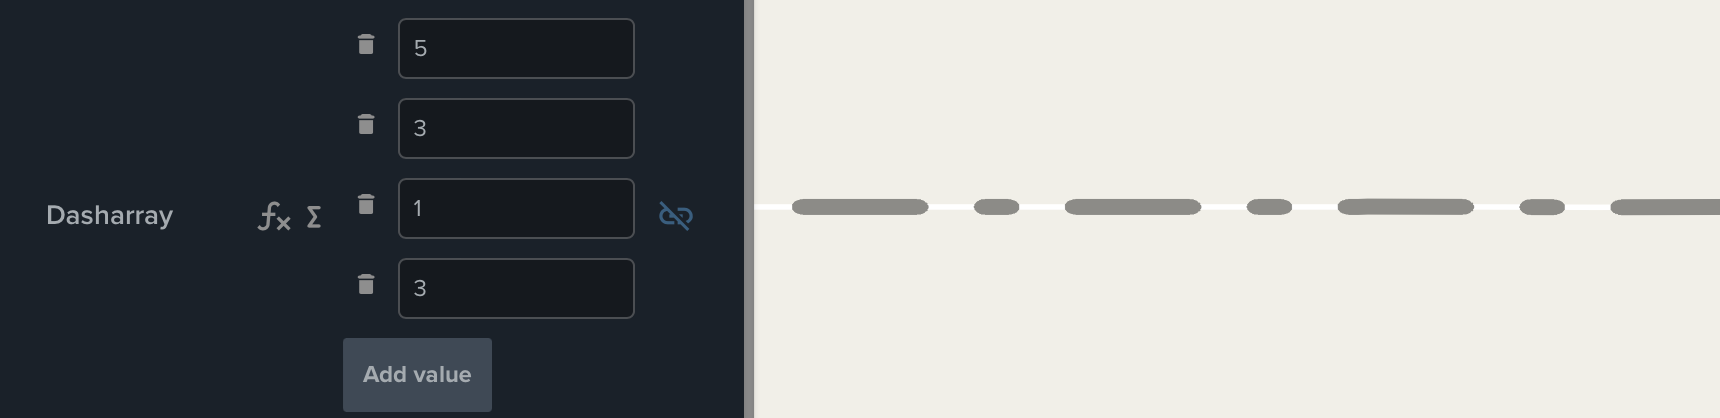
Layer line dash pattern is controlled by the Dasharray property. You can define patterns like long dashes, short dashes, or dash-dot lines by setting values in the Dasharray.
You can define the Dasharray with multiple values. A single value represents the length of a particular section of the line, multiplied by the line Width. Every odd value represents a line segment, and every even value represents a break. In other words:
- First, third, and every second value after that is responsible for line segment (dash length).
- Second, fourth, and every second value after that is responsible for break.
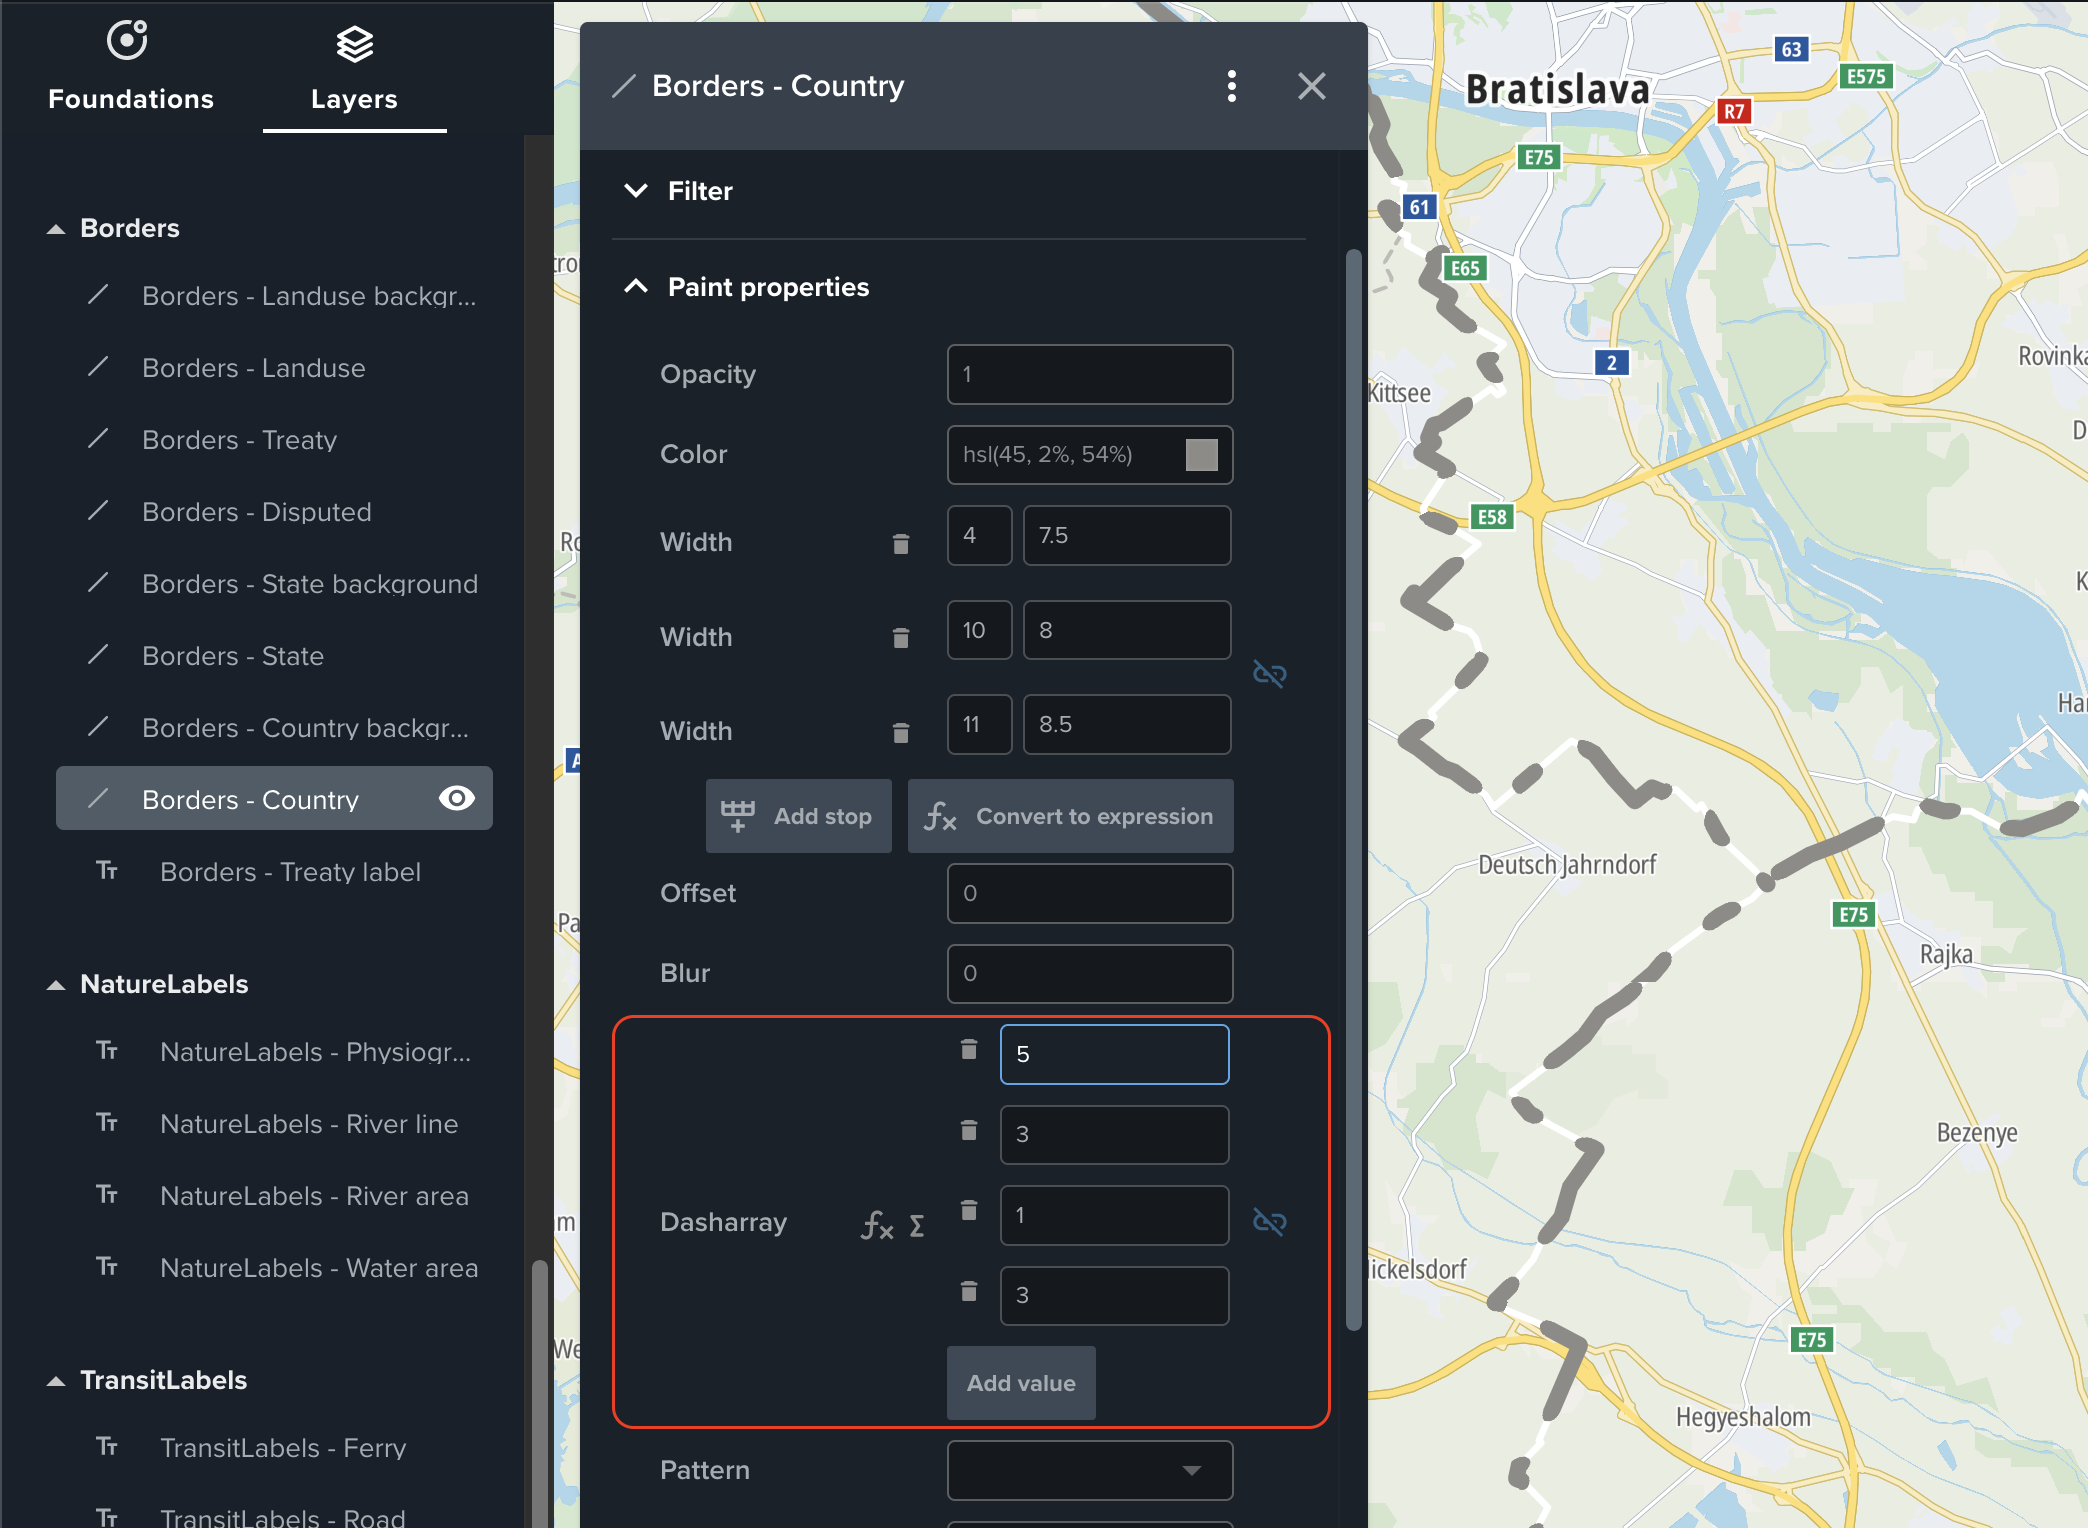
Consider following example: 5 - 3 - 1 - 3. This line will consist of:
- line segment of length 5 x line Width, followed by
- break of length 3 x line Width, followed by
- line segment of length 1 x line Width, followed by
- break of length 3 x line Width, and repeat
Changing line width and dash pattern
Follow these steps to change the line width and dash pattern of the layer:
- Open a style.
- Click the Layers tab.
- Click the layer you want to change (for example, Borders - Country layer). Remember that it should be a "Line" type of layer.
- Find Width and Dasharray properties in the Layer Editor.
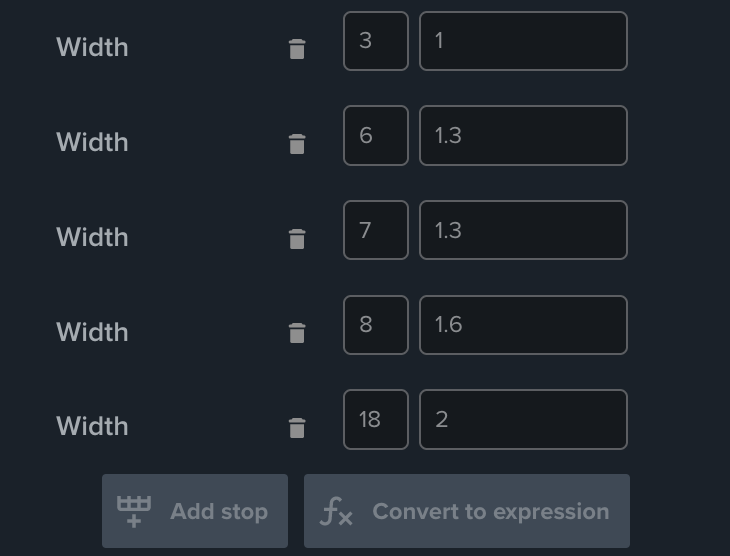
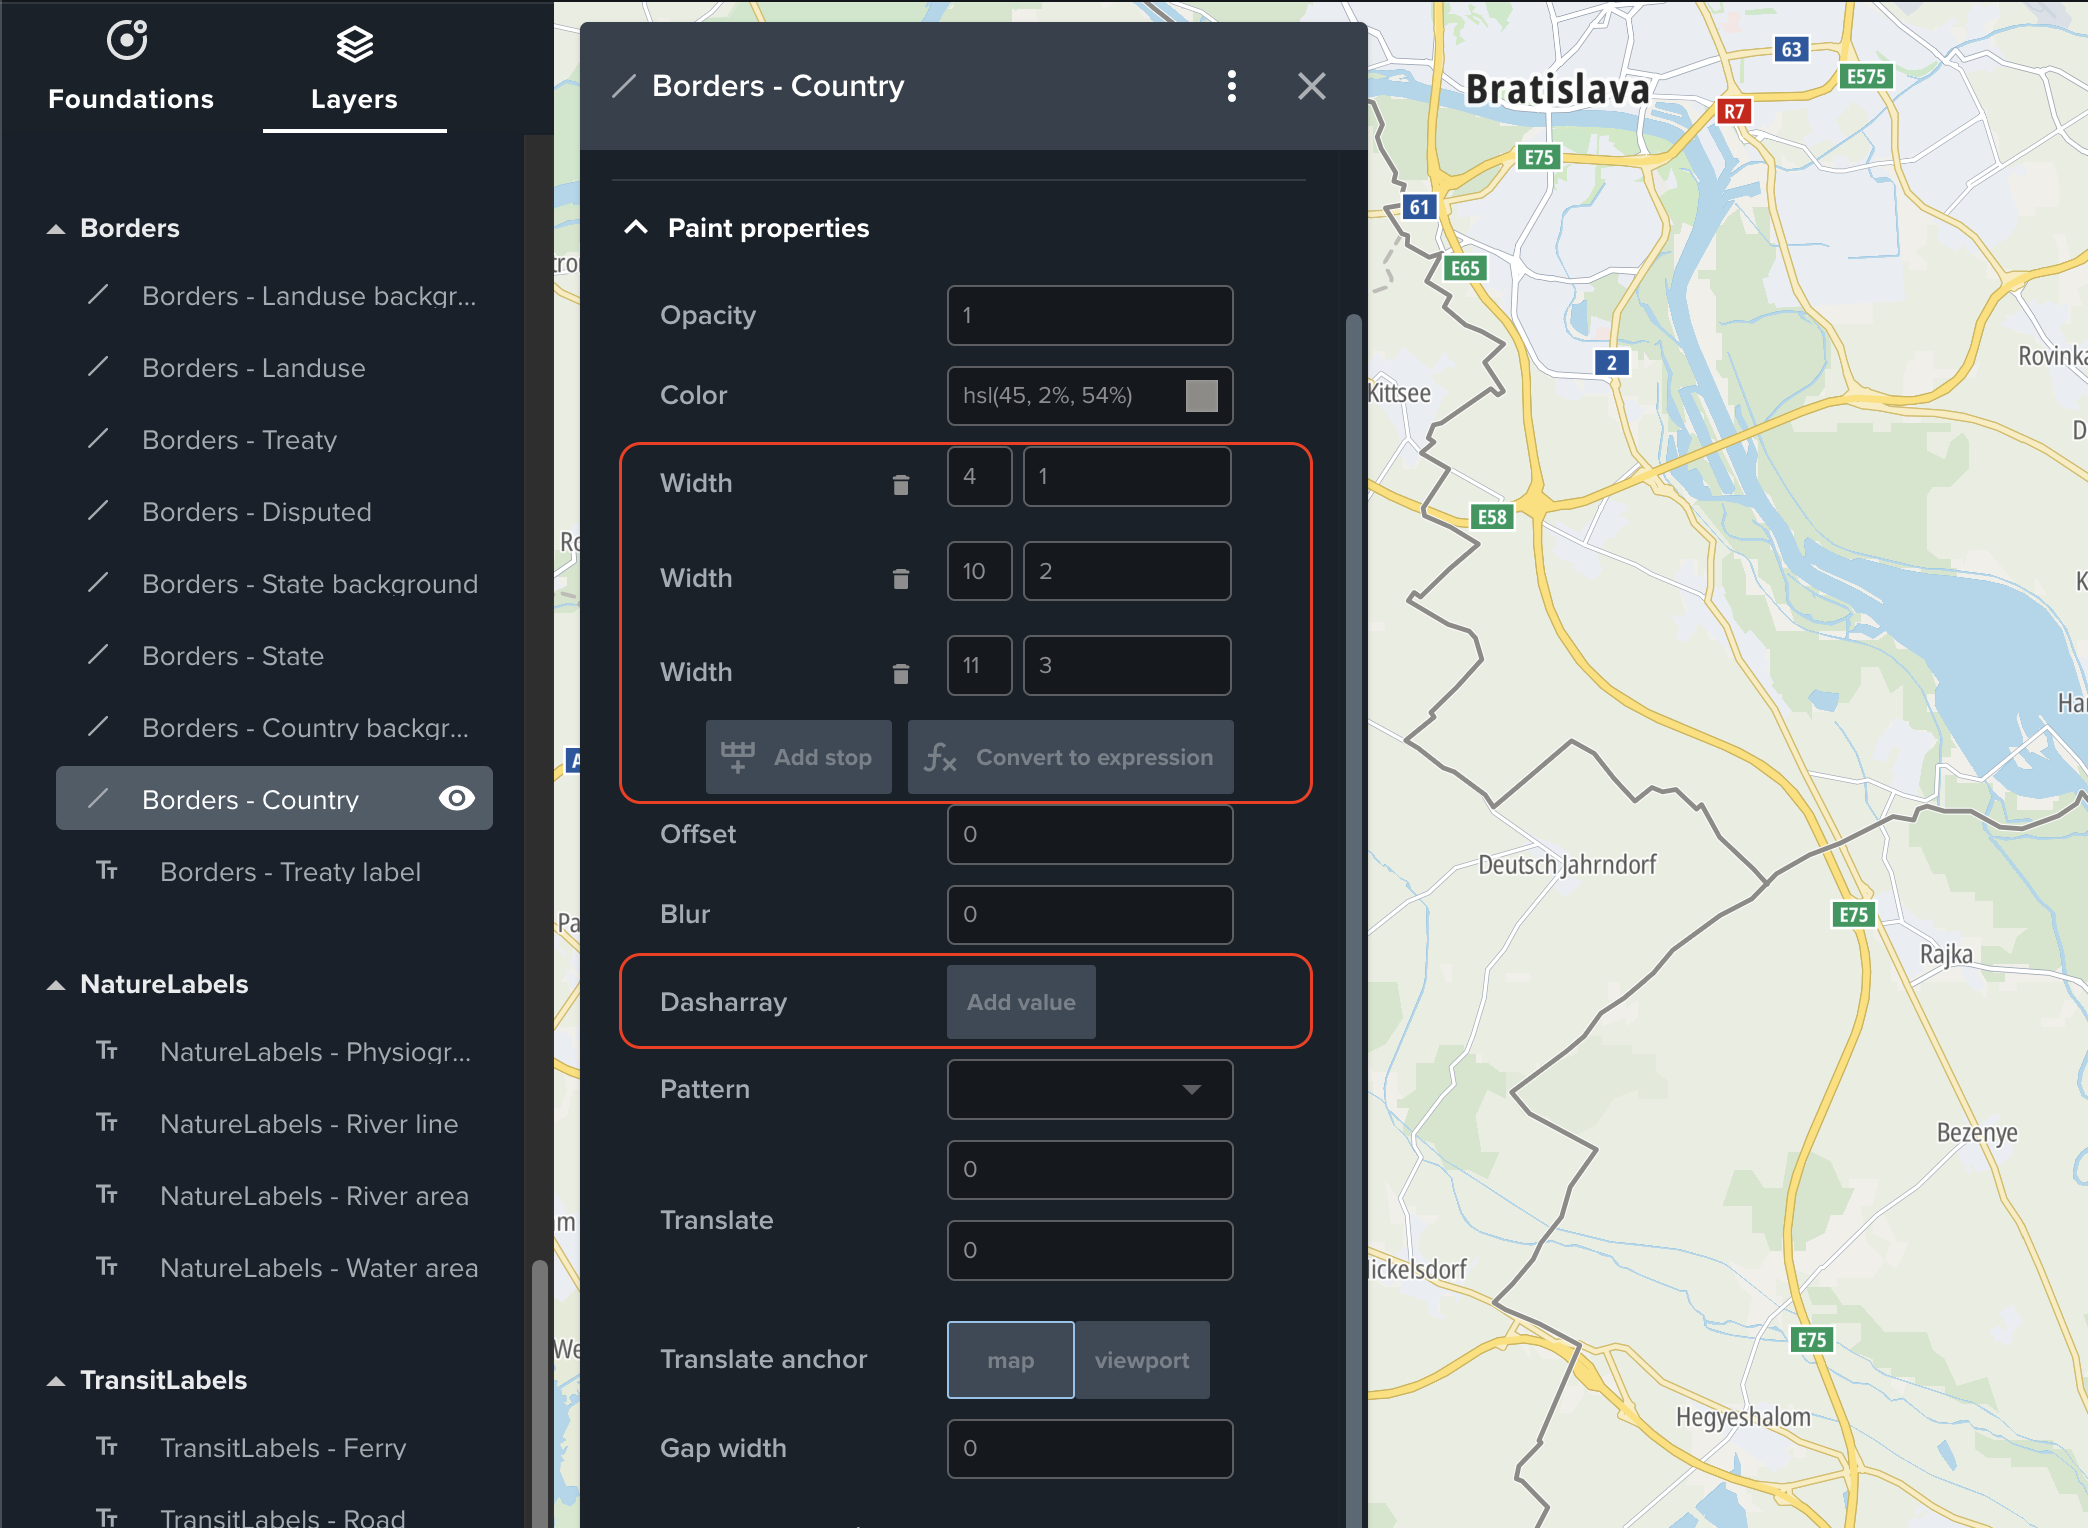 In the example, Width is defined as steps, and Dasharray is not defined.
 - Unlink the Width property by clicking Unlink.
See Linked layer properties for more information.
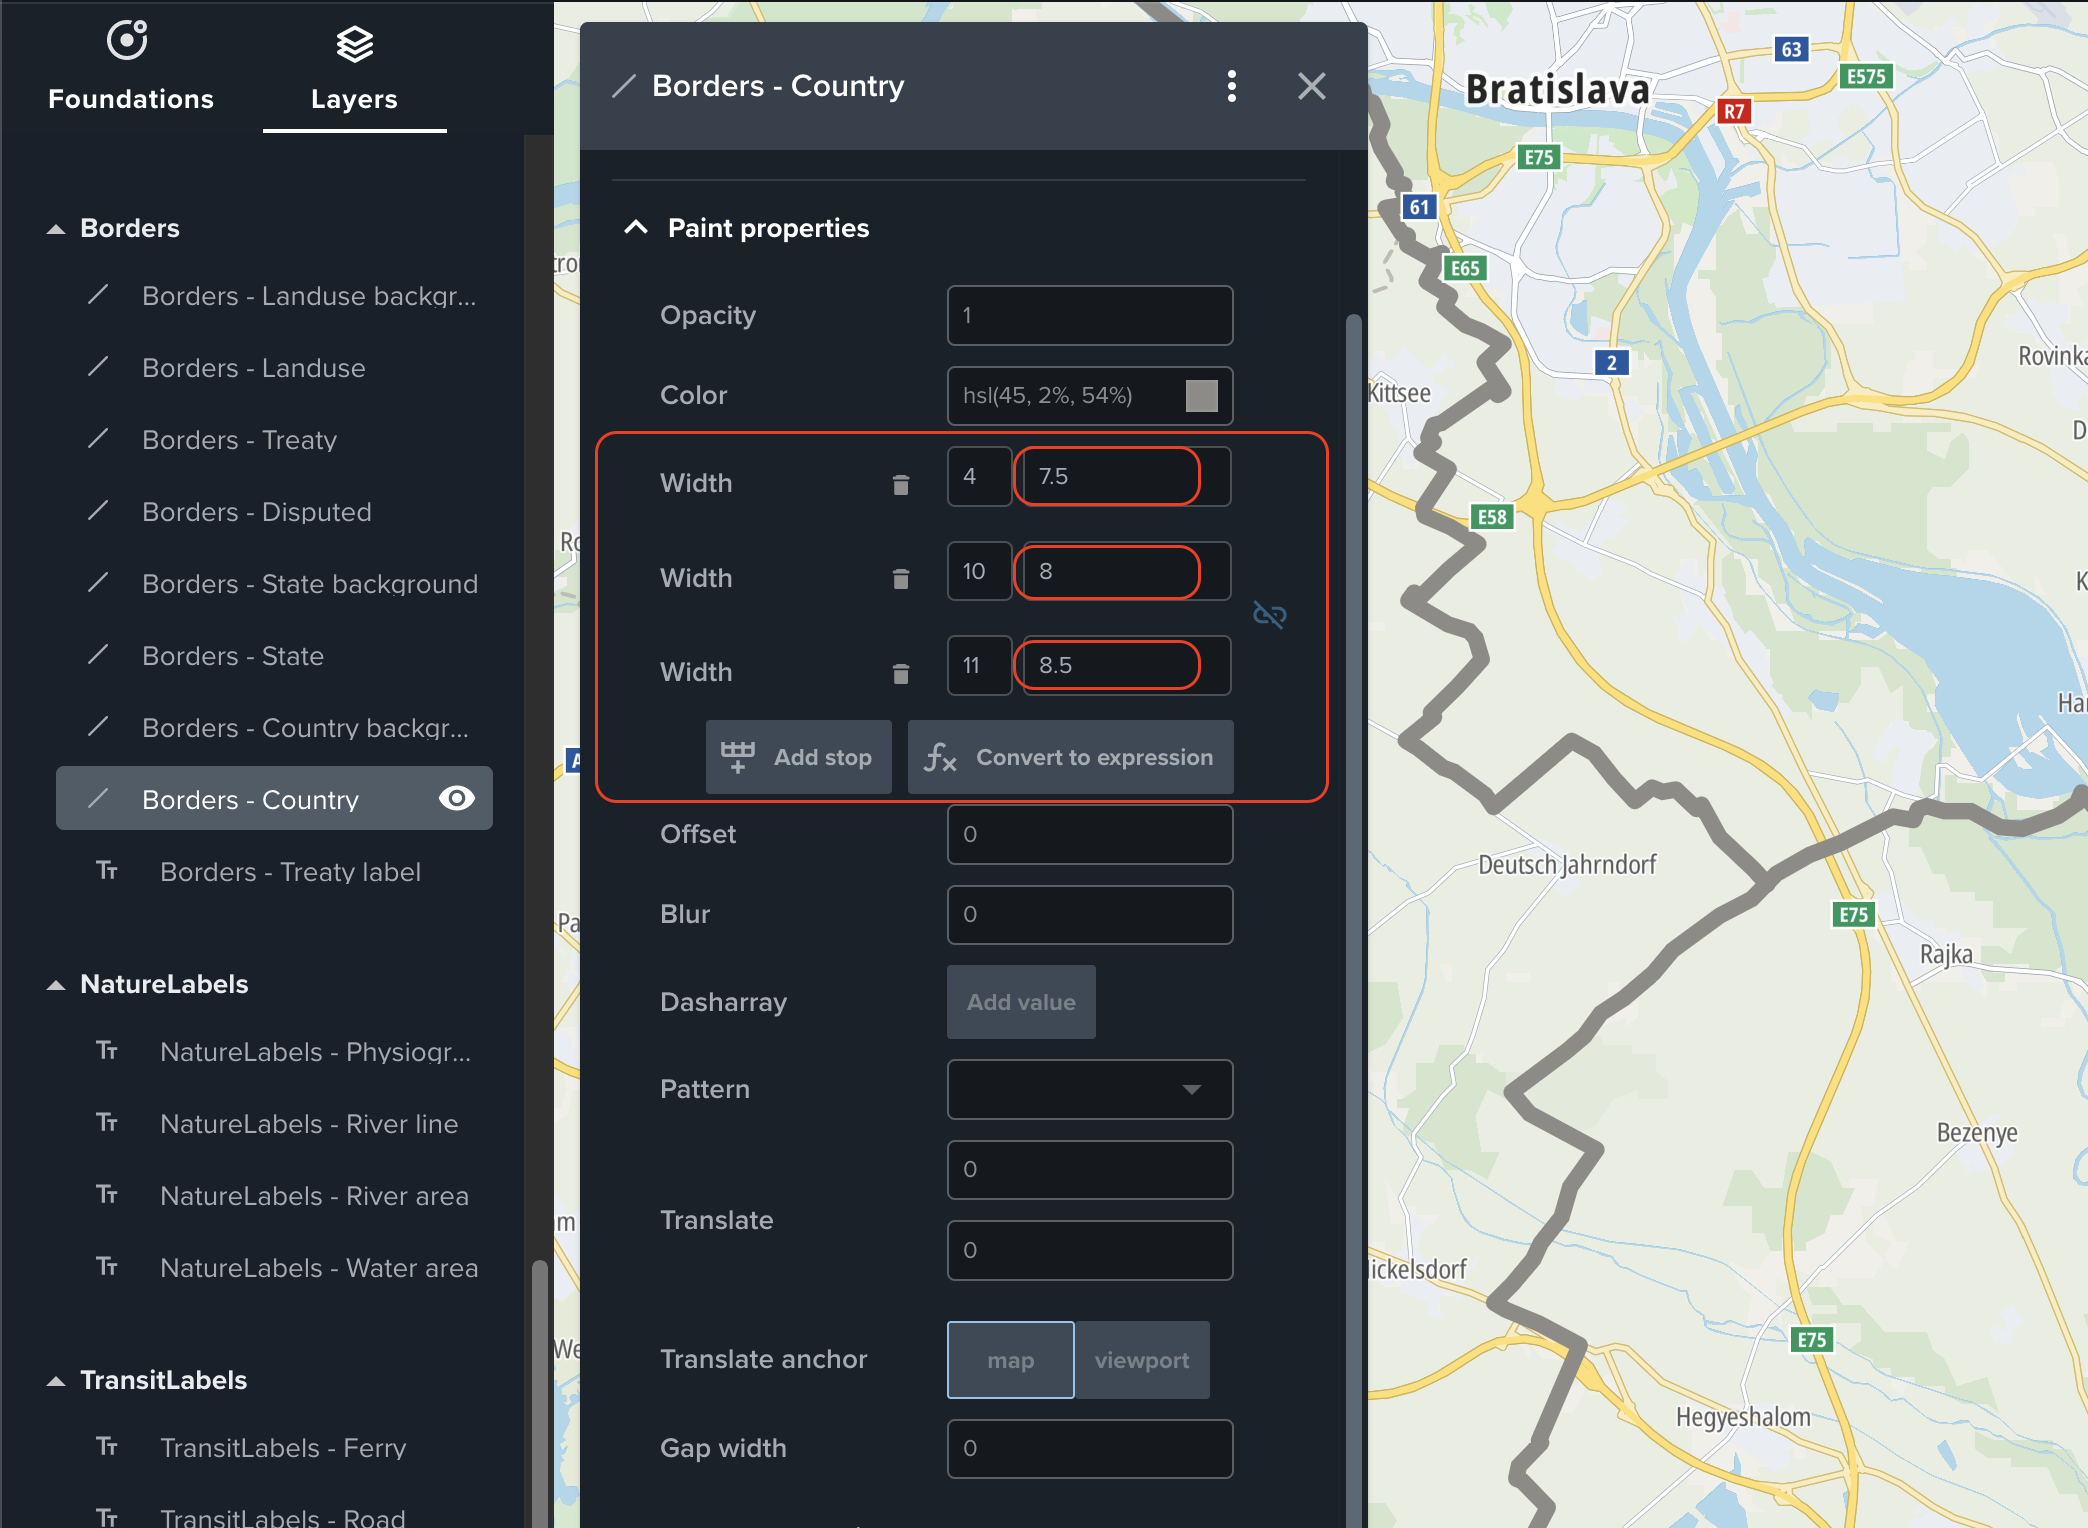
- Enter a numeric value in the Width box and observe how line width changes on the map. If the Width is defined as steps, remember that the first box represents the zoom level and the second the Width.
- If you want to set constant value, you can clear the steps.
To clear the steps click Clear.
- Unlink the Dasharray property by clicking Unlink.
- Add values to the Dasharray by clicking Add value.
- Enter values in Dasharray boxes and observe how the line dash pattern changes on the map.
- You can remove unwanted values by clicking Clear.
The shortest segment might not look like it has a length the same as the width. This is caused by caps, which add additional length to the segment. You can try to change the Cap property of the layer and see how it influences the line dash pattern.