Introduction to the map style
This guide assumes you have no prior experience in mapping or working with map styles. It is highly recommended you read this guide before learning about more advanced Map Maker features.
After reading, you will know:
- What are the building blocks of a map.
- What is the map style.
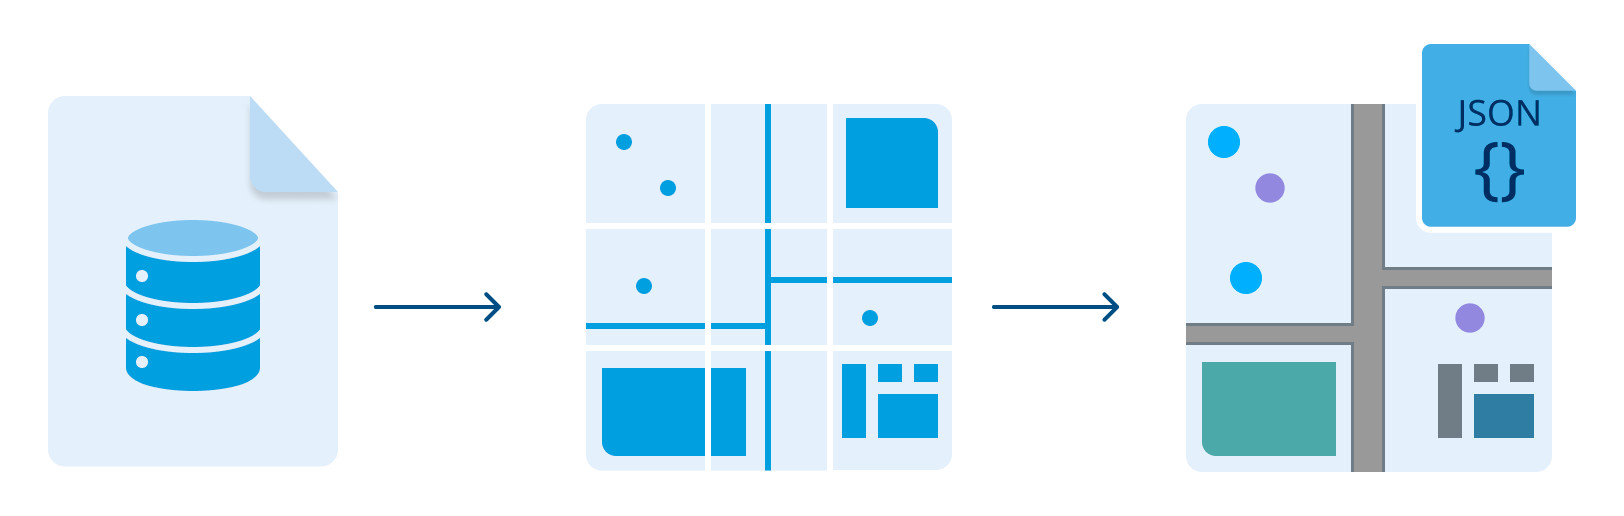
- How the map data is connected to the style.
- What is the MapLibre Style Specification.
Map building blocks
To build a map you need a lot of data, like the location of rivers, highways, parks, or grocery stores. In this section, you will learn about the structure of map data and how the data is organized.
Map features
A map feature is a geometry that defines the shape and position of physical world objects, like roads, rivers, or cities. Geometry in the map feature is connected to a set of properties called metadata. For example, metadata can describe if a given geometry is a city.
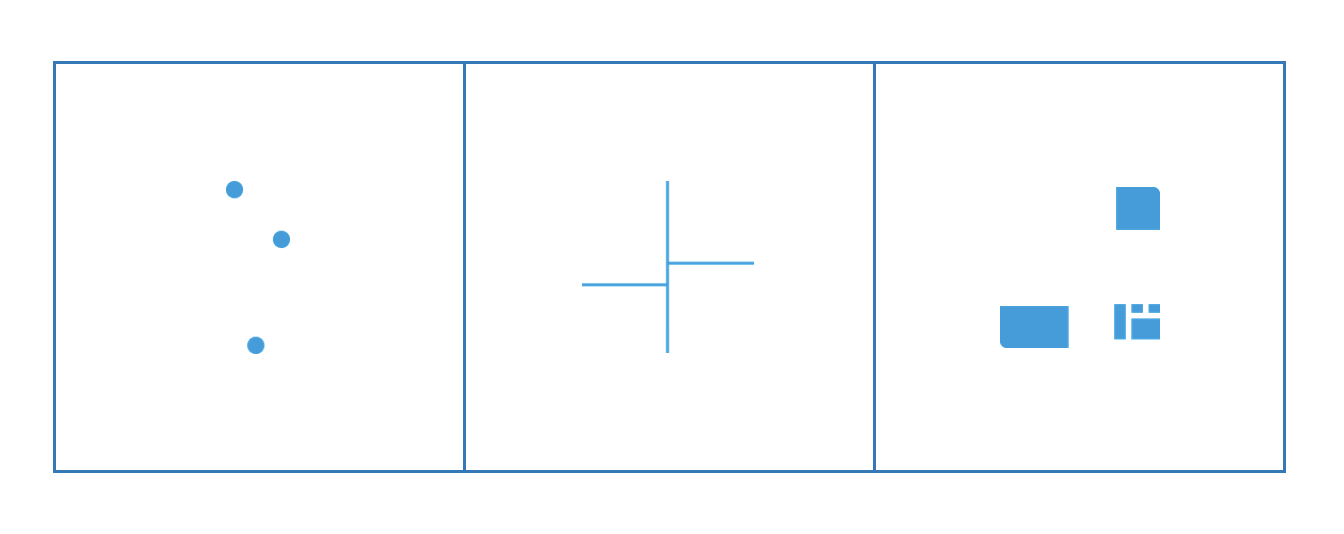
There are 3 types of map features:
- Points are typically used for the specific location of an object, Points of interest (POIs) or label and are usually rendered at the very top of the map.
- Lines are typically used to represent long and continuous features such as roads and transit lines.
- Polygons are typically used to represent boundaries like natural features, together with water and 2D buildings. They are usually represented with a simple fill color.
A map of the entire world contains hundreds of thousands of features. As you can imagine, it may be hard to find anything in such a set. That is why features are organized into groups. For example, all water geometries like oceans, seas, lakes, and other water bodies are in a single group "water". Those groups are called source layers or tile layers.
Tiles
The previous section mentions the enormous number of map features. This amount of data is problematic for two reasons:
- Performance. Map data is stored on a server. Downloading it all at once would take ages and occupy thousands of times more memory than a typical mobile phone has.
- Clarity of display. Usually, you want to display only certain map features at a given time. For example, when you are looking at a continent, information about local roads and metro stations is not useful and would clutter the view.
To address those problems, map data is divided into tiles and zoom levels.
Tiles are rectangular slices of the world. Tiles form a pyramid. Each step of the pyramid is a zoom level. There is just one tile on the top (zoom level 0). When you go down (zoom the map), you will get 4 tiles, then 16, and so on.

Tiles deeper in the pyramid contain more details, but at the same time cover a smaller geographical area. Tiles from the highest zoom level can contain features like road lanes or house numbers.
There are two types of tiles:
- Vector tiles that contain map features and enable styling them. You will do most of the styling on vector tiles.
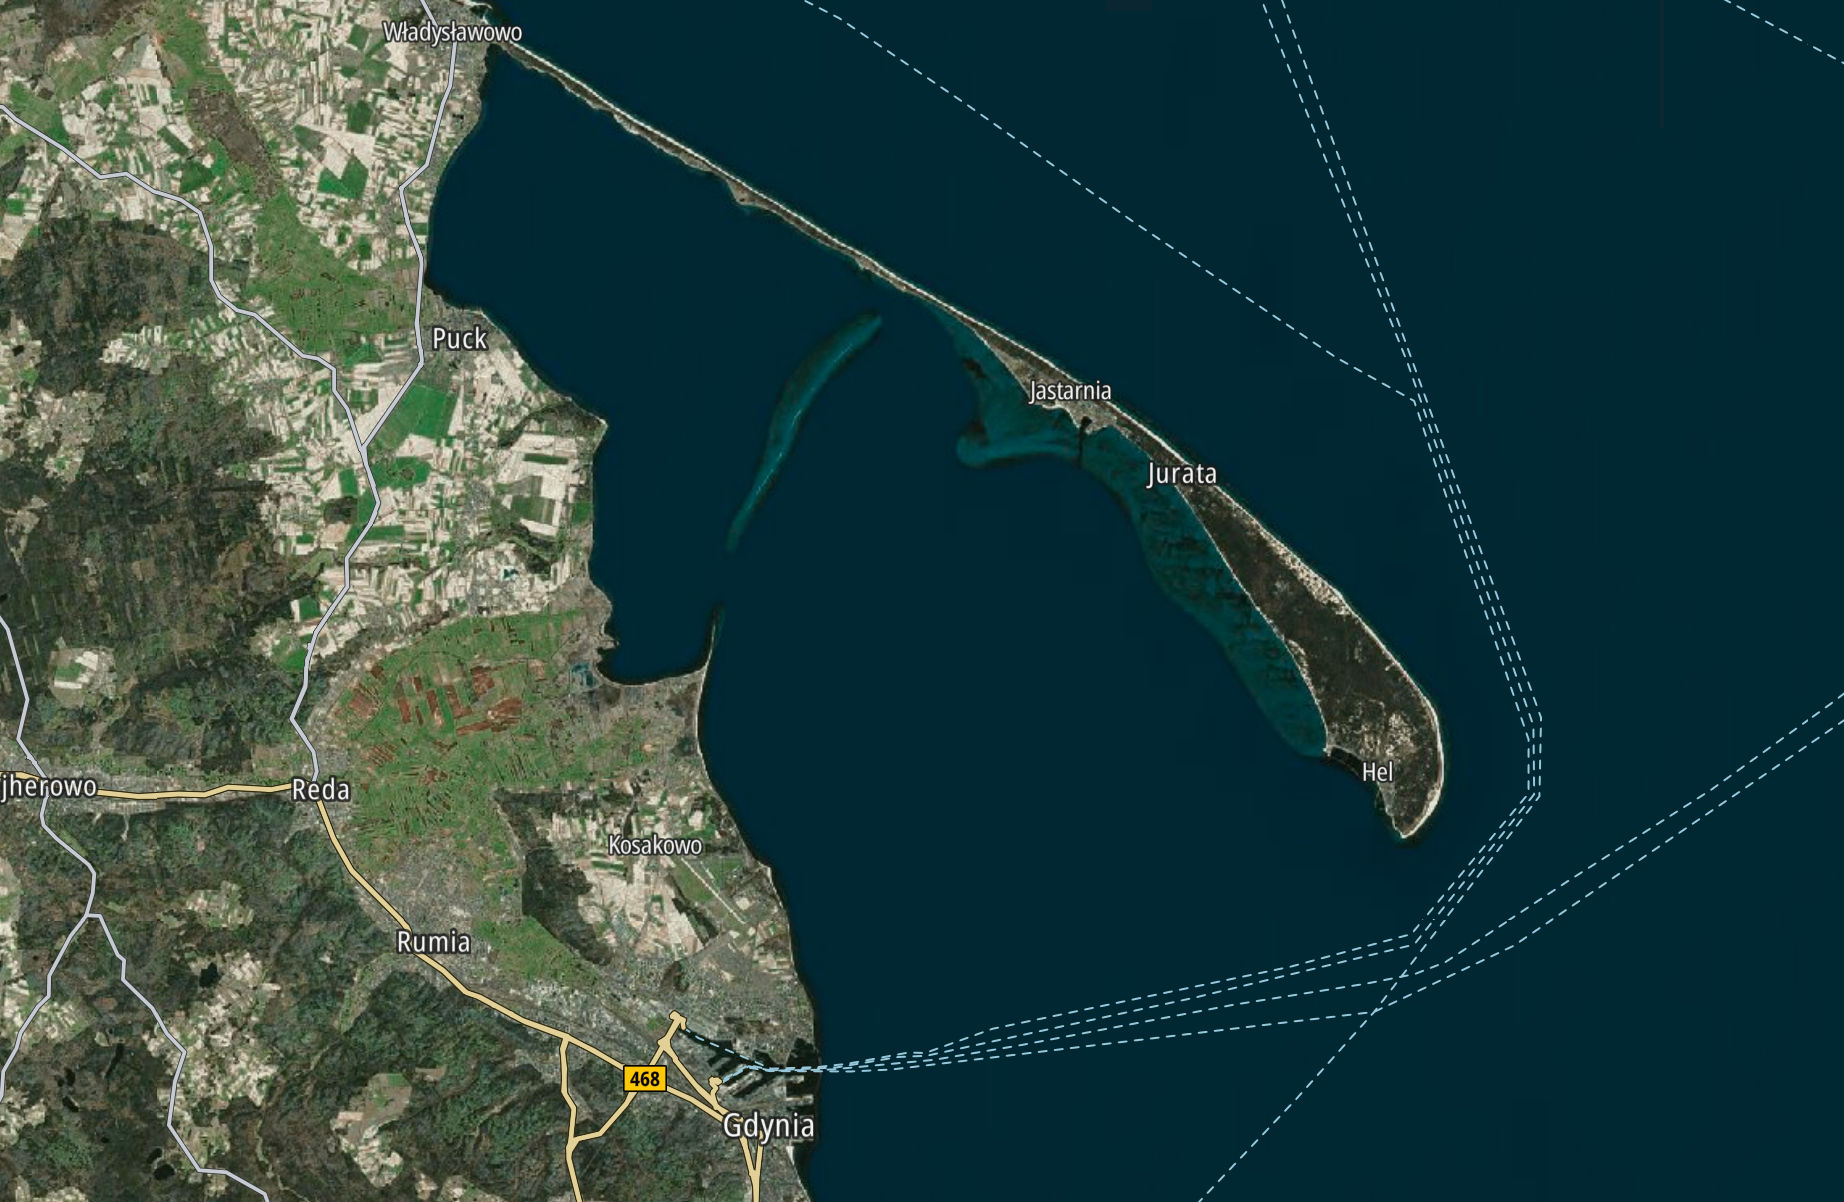
- Raster tiles that are just bitmaps, like satellite imagery. Styling options for the raster tiles are limited.
You can find a technical explanation of Zoom Levels and Tile Grid in the Map Display API documentation.
Summary
In this section you have learned that:
- The map feature is the smallest building block of a map.
- Map features are organized into source layers.
- Map data is divided into rectangular tiles.
In the next section, you'll see how this data can be filtered and styled.
Map Style
Map style describes the map's appearance. It defines what data to display, the order to display it, and how to style the data when displaying it.
MapLibre Style Specification is a formal definition of all properties that define the map's appearance. This section will provide a high-level introduction to map style, so you don't need to worry about technicalities.
Style structure
The style consists of:
- Sources
- Layers
- Root properties (e.g., style name, version and initial position)
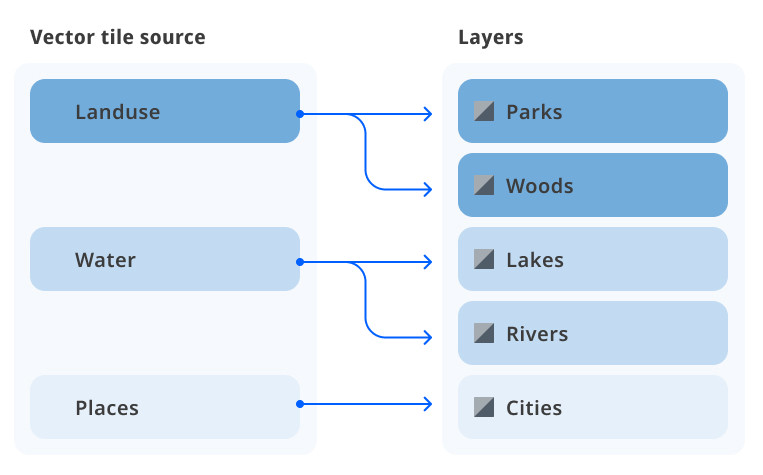
Sources
A source describes what data the map should display. For example, you can have a map with one source taking tiles from the TomTom Raster Satellite Tile API and another source taking tiles from the TomTom Vector Tile API to display a road network on top.
But the Source itself doesn't specify how the data should look. The MapLibre Style specification explains it well:
Adding a source isn't enough to make data appear on the map because sources don't contain styling details like color or width. Layers refer to a source and give it a visual representation. This makes it possible to style the same source in different ways, like differentiating between types of roads in a highways layer.
You will work mostly with vector, raster, and GeoJSON sources. Vector and raster sources provide tiles from a server, so they are often called tiled sources.
For more information about types of sources, see MapLibre Style Specification > Sources
Layers
The Layer defines where to take the data from and how it should look. Layers allow you to do fine-grained customization of features' appearance.
Some key facts you should know about Layers:
- Each Layer is associated with a Source (apart from the background layer). If you add a custom layer for displaying wildfires, you need to associate it with a source that provides wildfire data.
- Some Layer properties are used to filter features. For example, you can display
roadfeatures from only one category,local_road, and only from zoom level 15. - The Layer contains properties that define what map features look like. For example, "fill color" or "line width".
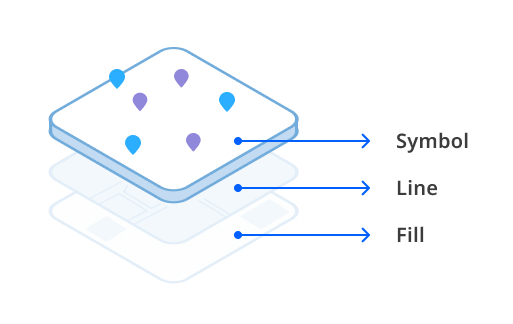
- The order of layers determines the order of appearance on the map. Layers higher in the stack will be displayed on the top. For example, you will find layers responsible for displaying labels and POIs at the top of the layer list.
For more information about types of layers, see MapLibre Style Specification > Layers
Summary
Key facts you should remember from this section:
- Layers describe what features to display and how they should look.
- Sources provide layer information about map data.
- Map data is usually provided in the form of tiles.
Next steps
Map Maker offers abstraction over map working directly with MapLibre Style Specification, so in most cases, you don't need to worry about low-level details like sources or layers. We recommend you start with Foundations and Modules and fallback to Layers if you will find the first two functions limiting.
- Foundations - Learn how to customize map colors with only a few clicks.
- Modules - Learn how to quickly customize groups of layers.
- MapLibre Style Spec - See detailed description of layer types and their properties.