Consumption model integration
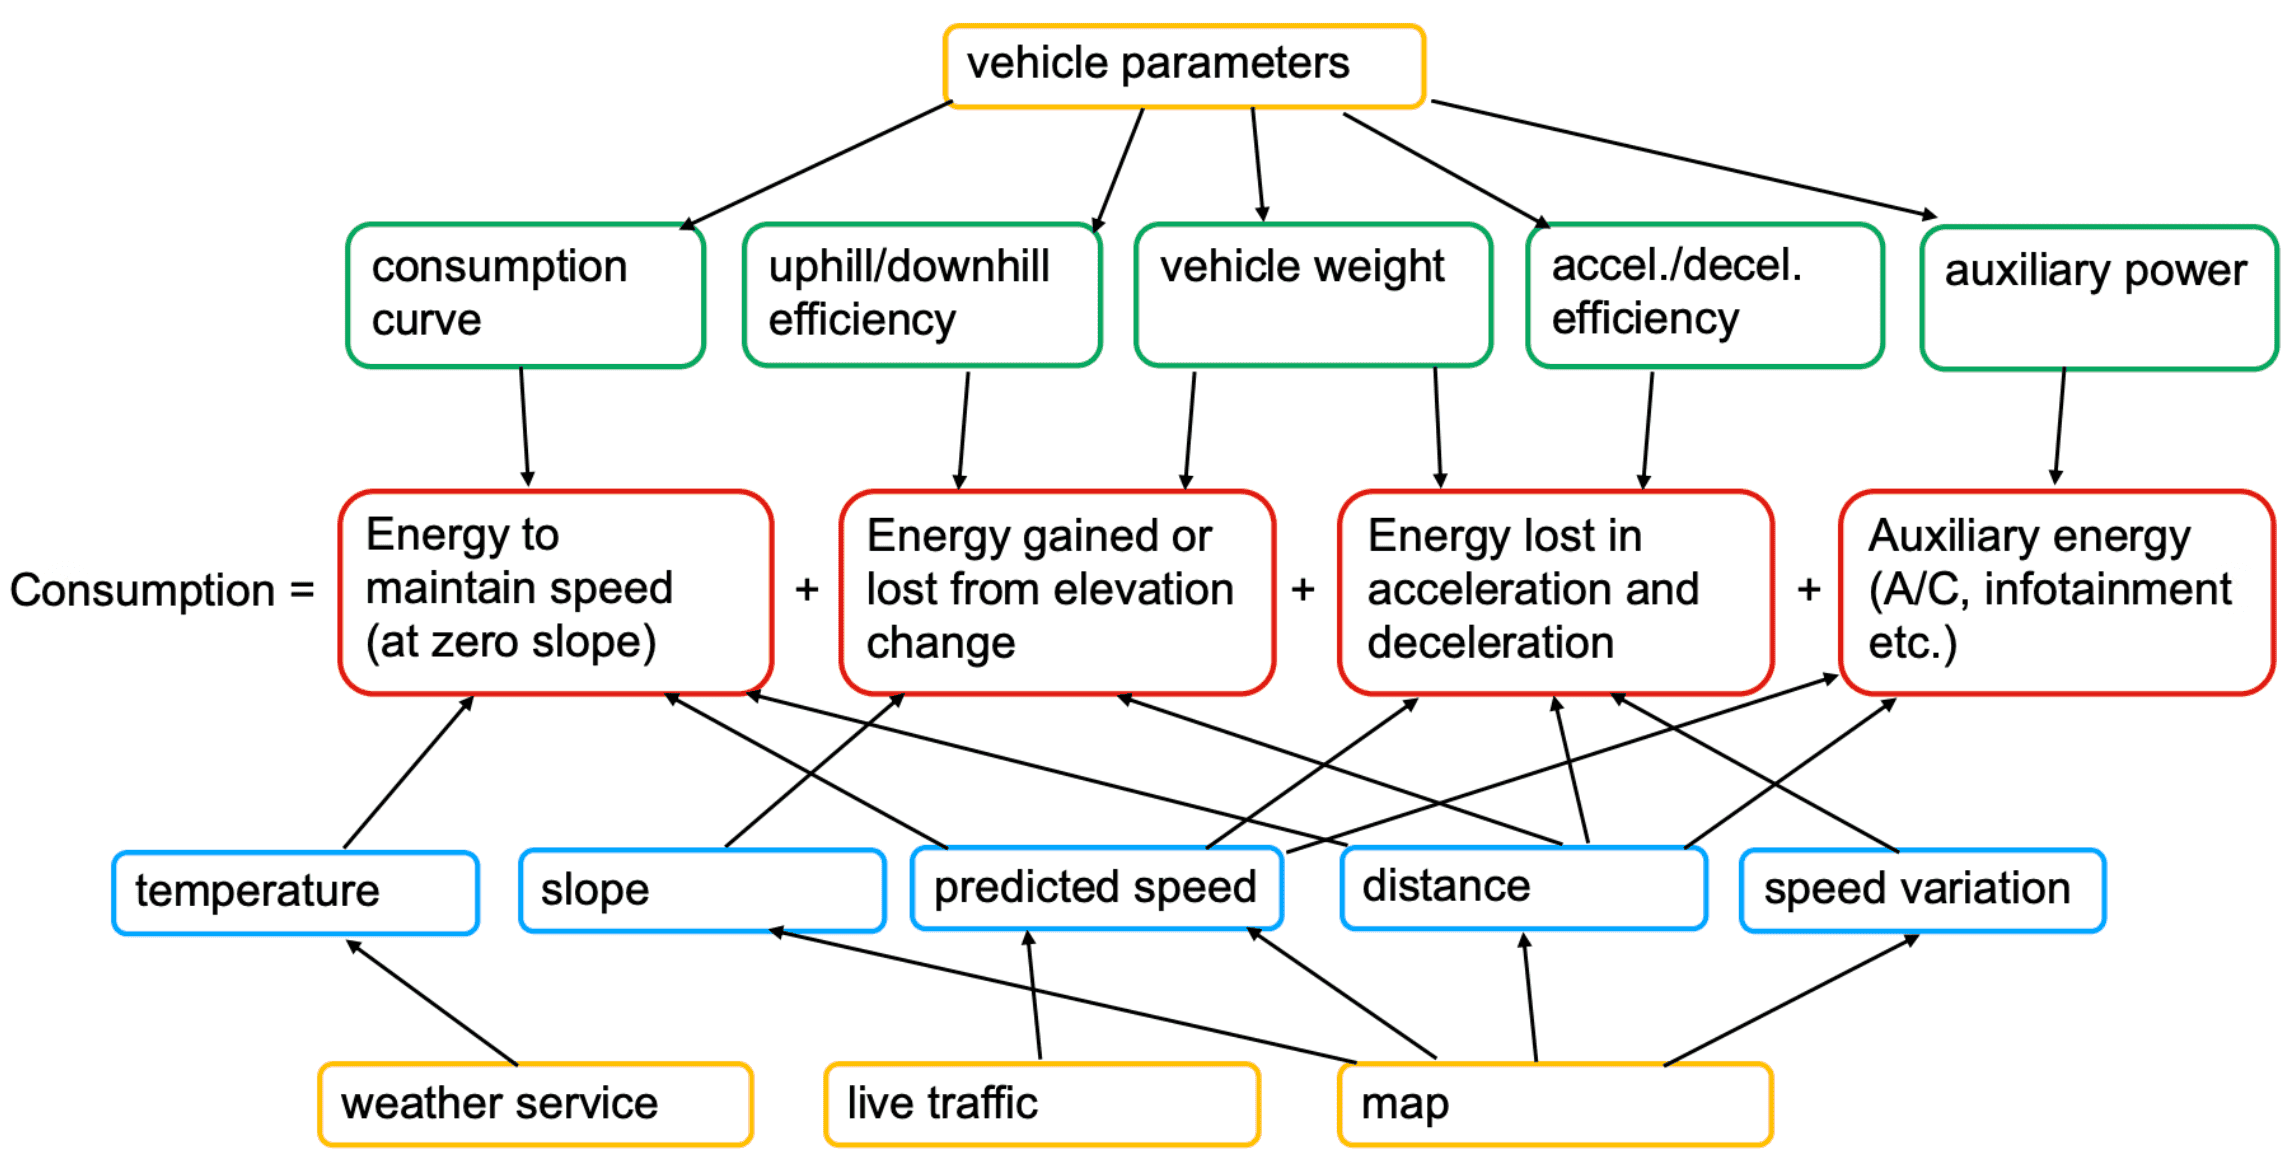
The Navigation System must accurately predict energy consumption along the route to estimate State of Charge (SoC) upon arrival, display range on a map, and automatically incorporate charging stops. Several parameters are essential for reliable consumption estimates. Some parameters serve additional functions; for example, vehicle weight is also used to avoid roads with weight restrictions during routing.
An alternative to providing these parameters manually is TomTom's AI-powered consumption estimation. See Vehicle Integration.
Consumption model overview
Parameter stability
Most vehicle parameters can be dynamically adjusted during a trip. However, charging station selection is highly sensitive to these parameters. Charging stations are typically chosen to ensure State of Charge upon arrival is just above a configurable threshold. If parameters change after charging stop selection, a station may become unreachable, requiring route recalculation with different charging stops.
If parameters shift in the opposite direction, the original charging stops might become viable again, causing an inconsistent user experience. Parameters must remain relatively stable throughout the trip, avoiding short-term spikes. Even without automatically added charging stops, fluctuating predicted State of Charge at arrival creates an impression of unreliability. For example, 5% fluctuations in current battery capacity during a trip contribute to this perception (see Current battery capacity).
Parameters
The following consumption parameters are relevant:
- Nominal battery capacity
- Current battery capacity
- State of Energy (SoE)
- Consumption curve
- Auxiliary power
- Weight
- Efficiency
For charging parameters, refer to the Charging parameters page.
Nominal battery capacity
The maximum amount of energy (in watt-hours) that can be extracted from the battery at 20°C and is available for propulsion, thermal management, and auxiliary power (such as HVAC systems). This is a fixed value specific to each car model.
This value excludes energy permanently reserved in top/bottom buffers to protect battery longevity. Internal battery losses (energy lost before reaching the inverter due to Ohmic heating and electro-chemical side losses) must be deducted. Battery aging effects (State of Health) must also be considered.
This value includes all powertrain consumption, including losses in the power inverter.
Current battery capacity
The battery capacity (in watt-hours) reflects the vehicle's current capacity after accounting for aging and State of Health.
Batteries typically experience 2–3% capacity loss per year. This value must remain within [0, nominal_battery_capacity].
This value must remain stable throughout a trip. It should not account for efficiency variations due to current battery temperature; instead, it should refer to the energy available at 20°C.
This ensures consistency, as battery temperature can fluctuate significantly during the trip, requiring a common baseline for battery capacity across all charging and operational events. Small fluctuations (less than 0.3% over the trip due to updated State of Health) are acceptable. Larger fluctuations negatively impact user experience (see Parameter stability). Changing battery capacity can also cause incorrect charging time estimates, since the charging curve (see Charging curve) assumes constant battery capacity.
State of Energy (SoE)
The current amount of energy (in watt-hours) that can be extracted from the battery at 20°C and is available
for propulsion, battery thermal management, and auxiliary power. This value must be within [0, current_battery_capacity].
Updates should occur at 1 Hz with the smoothest possible rate of change (see Parameter stability). Fluctuations caused by thermal effects (not consumption or charging) should remain below 0.3% over the trip.
The SoE must be consistent with battery capacity:
- Does not account for internal battery losses
- Does not consider reserved energy (both
0andcurrent_battery_capacityare reachable values) - Is independent of current battery temperature
The SoE should linearly map to the State of Charge percentage displayed to the driver:
- SoE of
0kWh = 0% SoC - SoE of
current_battery_capacitykWh = 100% SoC
Consumption curve
The consumption curve represents the energy required to travel 100 km while overcoming air and rolling resistance at varying speeds under ideal conditions. This parameter is crucial for accurate consumption estimates and must be updated when conditions change that affect rolling resistance (such as weight increases).
The following example represents a consumption curve with points (10:11.41), (20:9.17), (30:8.77), (40:8.95), (50:9.48), (60:10.26), (70:11.26), (80:12.46), (90:13.85), (100:15.43), (110:17.19), (120:19.13), (130:21.25), (140:23.55), (150:26.02), (160:28.66), (170:31.48), (180:34.48), (190:37.65), (200:40.99):
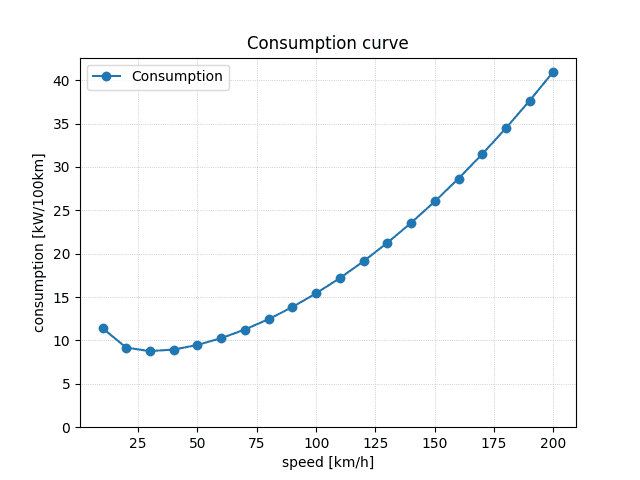
Consumption curve
The consumption includes all internal losses, such as those from transmission, load-dependent inefficiencies of the motor, and losses in the power electronics (inverters). However, no additional sources of consumption should be considered such as energy used for auxiliary power or battery preconditioning. The consumption curve applies to a route characterized by:
- No acceleration or deceleration
- No slopes
- An ambient temperature of 20°C, with no adverse weather conditions like wind or rain
Define the curve with 15 to 25 points, roughly evenly spaced from 10 km/h to maximum vehicle speed. Values between points are linearly interpolated. Values before the first point and after the last point are linearly extrapolated. Ensure linear extrapolation does not yield negative consumption at any positive speed.
Ideally, determine this curve through drive tests with controlled scenarios (no acceleration, deceleration, or slopes) at various speeds. If unavailable, use rough estimates based on vehicle parameters such as weight and drag area. TomTom provides a script to help.
The consumption curve is the most important parameter for consumption estimation. Errors have large effects (e.g., 10% too low results in consumption estimation 10% too low). Focus improvement efforts here.
The routing system adjusts the consumption curve for air resistance changes due to temperature (this is why the curve should be at a fixed temperature). Online, it uses TomTom's weather service to predict temperature. Onboard, it uses the ambient temperature sensor. To improve offline consumption prediction, always provide the ambient temperature signal.
TomTom will offer automatic consumption curve correction based on vehicle telemetry data in an upcoming feature.
Auxiliary power
Expected average auxiliary power for the trip remainder. May fluctuate during the journey (e.g., when air conditioning settings change). Encompasses all non-motor, non-drivetrain, and non-battery consumption, such as climate control, infotainment, and lighting.
Estimate this value based on measured current auxiliary power use. The parameter should not reflect instantaneous power to avoid fluctuations that lead to replanning (see Parameter stability). Provide average power consumption over the past 5 minutes. Alternatively, use a prediction (e.g., based on ambient temperature) to estimate future auxiliary power. If neither measured auxiliary power nor estimates are available, use a default of 500 W.
For this parameter, only larger errors matter. For example, 800 W instead of 500 W results in ~2% consumption prediction error. 2000 W (e.g., air conditioning at high heat) results in ~10% error.
Weight
Total vehicle weight (in kg), including passengers, cargo, and additional installed equipment.
If the vehicle can dynamically estimate weight, update this value to improve consumption prediction accuracy. Note that adjusting weight after departure (e.g., when gathering sufficient estimation data takes a few minutes) can require replanning charging stops, particularly with significant weight differences (e.g., 400 kg increase for a delivery vehicle could increase consumption by 5–7%).
Efficiency
The following parameters are required:
- Acceleration efficiency: Efficiency of converting electric energy to kinetic energy during acceleration
(
KineticEnergyGained/ElectricEnergyConsumed), in % - Deceleration efficiency: Efficiency of converting kinetic energy to electric energy during deceleration
(
ElectricEnergyGained/KineticEnergyLost), in %
Note: These values may depend on initial and final speeds during acceleration or deceleration. Provide values for a typical maneuver, such as 60 km/h to 80 km/h.
- Uphill efficiency: Efficiency of converting electric energy to potential energy when gaining elevation
(
PotentialEnergyGained/ElectricEnergyConsumed), in % - Downhill efficiency: Efficiency of converting potential energy to electric energy when losing elevation
(
ElectricEnergyGained/PotentialEnergyLost), in %
Note: These values may depend on initial speed and slope. Specify values for a typical scenario, such as 2% slope at 80 km/h.
Uphill and downhill efficiency values are independent of current vehicle weight and do not require updates when weight changes. Their relationship to energy consumed per kilometer of elevation gain (EUphill) and energy recovered per kilometer of elevation loss (EDownhill):
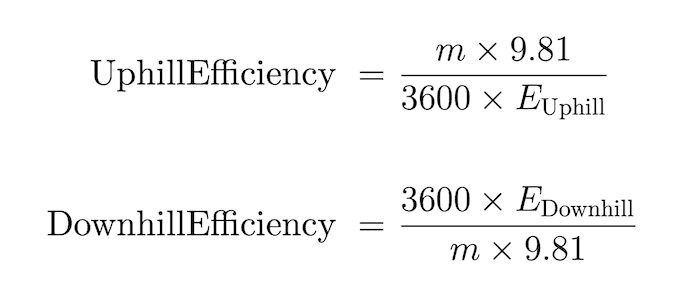
Uphill and downhill efficiency formula
If these values are unavailable, a default value of 90% can be used.