Analyzing and Visualizing TomTom Location History Data
) Ruanna Owens
Ruanna Owens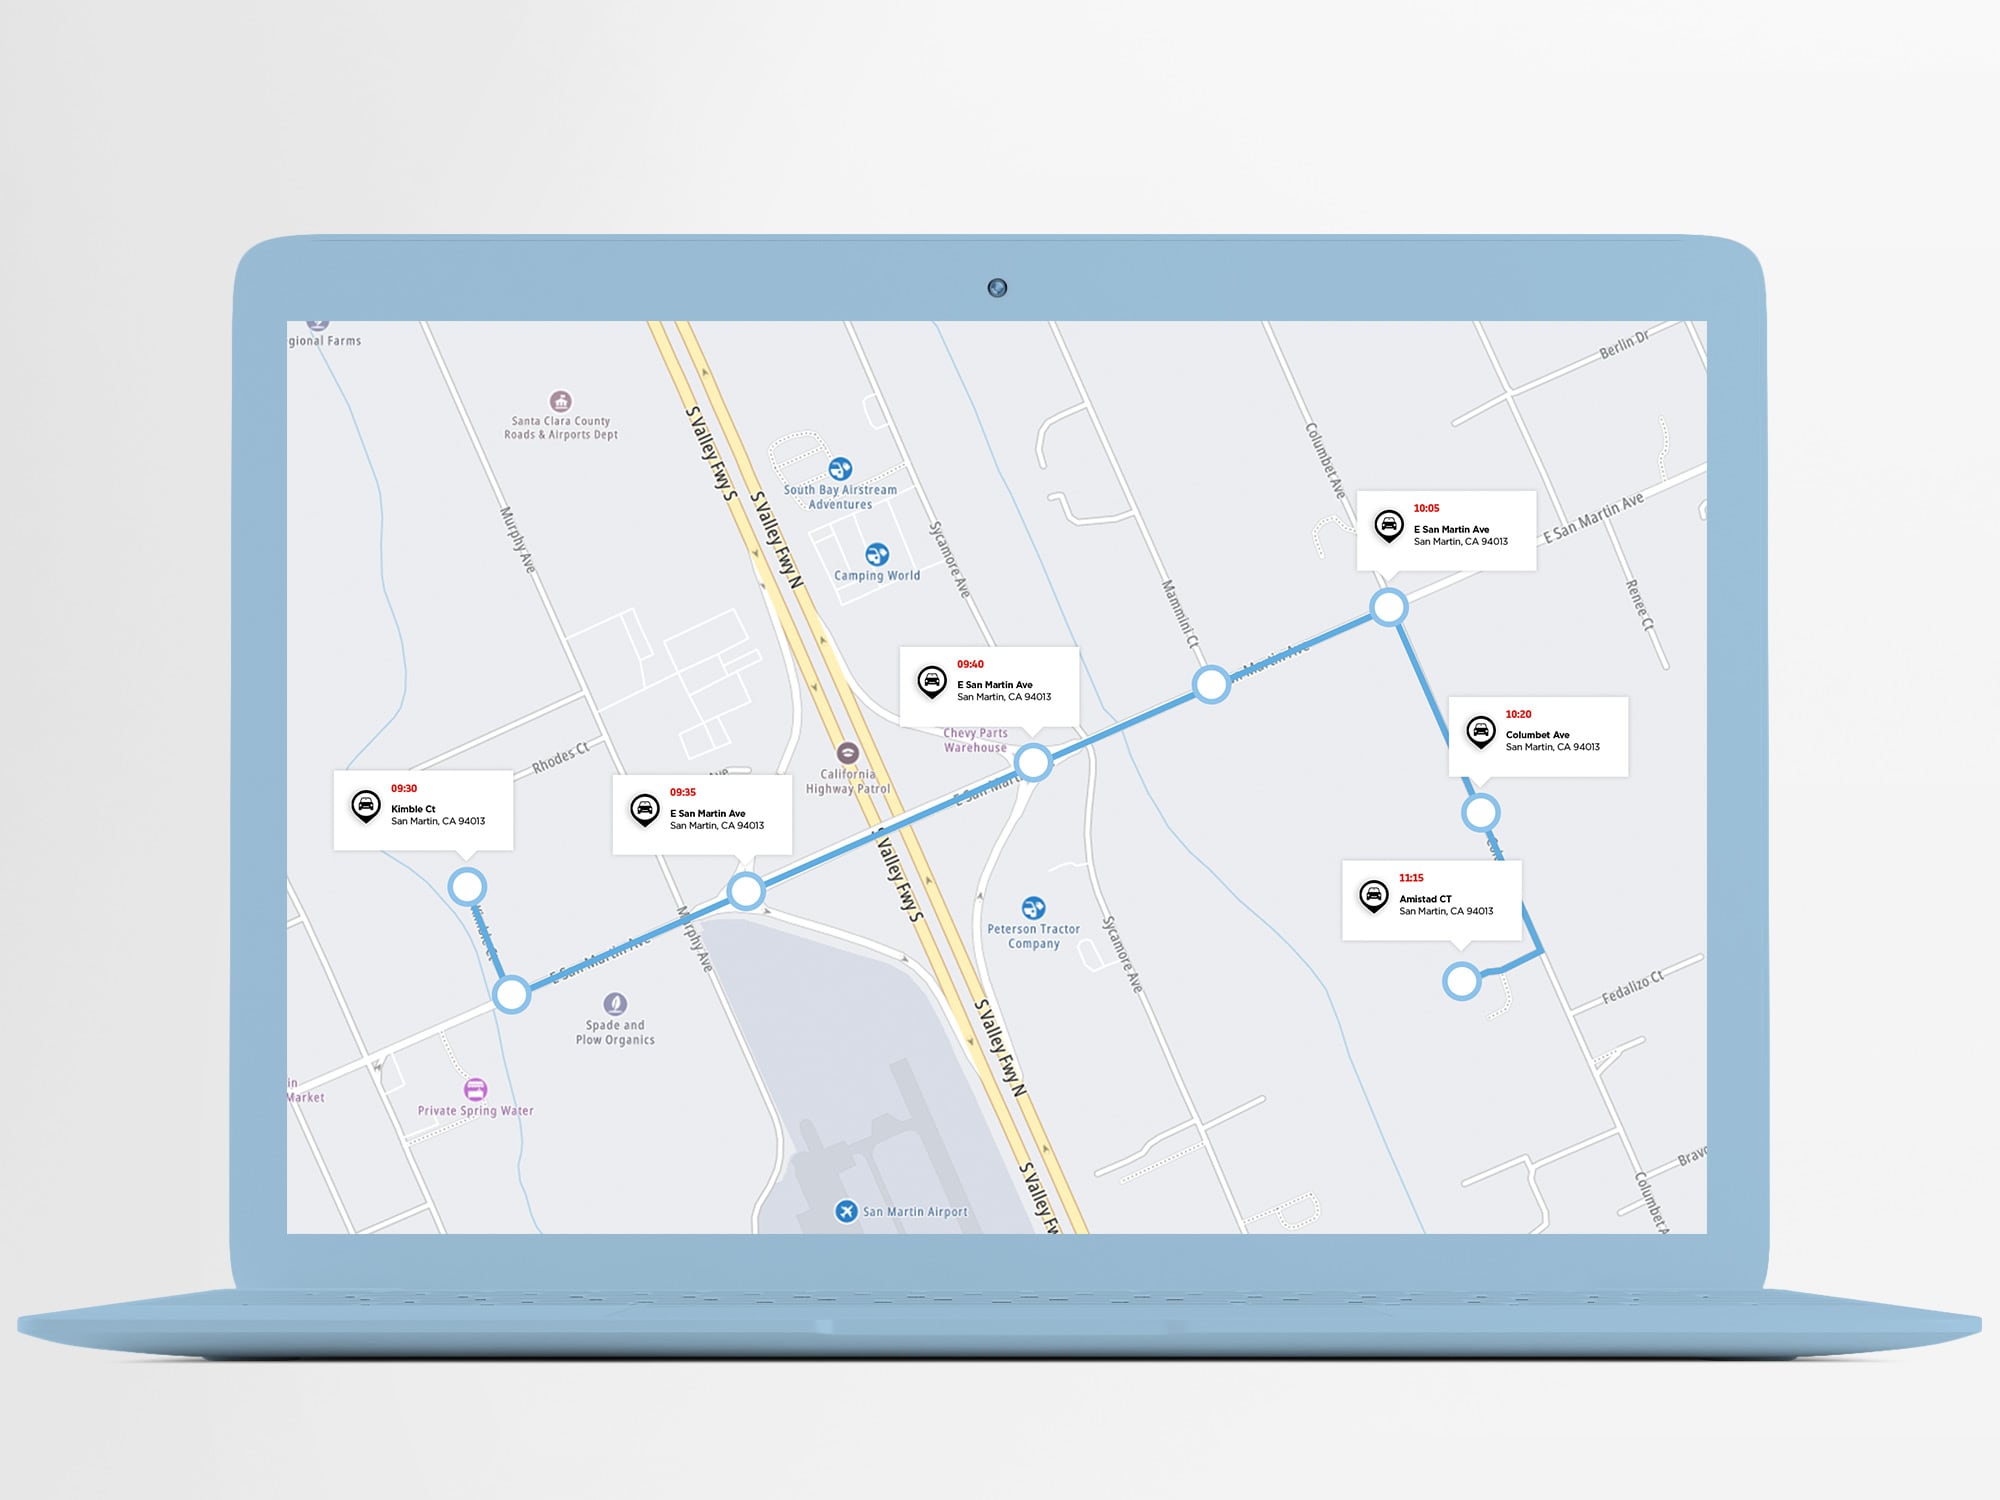
Now more than ever, developers and data scientists can glean insights into datasets. But insights into data require data. TomTom makes it easy for developers and data scientists to collect data from its APIs quickly, enabling developers and data scientists to put the data to work using their favorite tools.
Data science plays a notable role in the significant insights we notice on everyday map applications. Data scientists and full-stack developers apply various complex analytical techniques to deep-dive into the data gathered by devices. This data is collected using the maps within these applications, always seeking more straightforward ways to do so.
In this article, we’ll demonstrate the most direct and easiest ways to use data science tools to retrieve, analyze, and visualize data from maps applications. We’ll concentrate on location history data generated by the TomTom Location History API to develop a practical and rich use case.
Many developers and data scientists prefer to use the TomTom API, as it provides an easy experience with flexible techniques to apply data science tools inside map applications. These applications keep track of where things have been over time and manage multiple objects’ locations using TomTom’s Location History service. This is aided by geofencing applications to keep track of whether an item is inside or outside of some virtual boundary.
The applications store this location history in the cloud (for secure collection and storage of location information) and share it with the geofencing service to provide the history of object transitions through fence borders. The tracked object could be persons, vehicles, packages, or smartphones.
We must create a library of these objects and define their attributes to benefit from using their location history. We need to build an application that pulls data from the TomTom Location History API to work with location history data, such as position history based on saved object location records.

There are two keys necessary to work with location history: the API key, which allows us to work with any TomTom Maps API (including the Location History API), and the Admin key, which is used by the Location History service to create, edit, or delete objects and their location history. To start using the Location History service endpoints, we must register and create a configuration for the user of the API as well as creating an admin key. The Location History API includes the following features:
Service, for managing options
Configuration, which enables us to create, edit, and delete location history data
Archive, which contains archive structure, historical positions, and a prepared data downloader
To register for an admin key, we use the configuration service’s Register Admin Key endpoint. The admin key registration URL format for the POST HTTP method looks like the following snippet:
https://api.tomtom.com/locationHistory/1/register?key=Your_API_Key
{
  “secret”: “your_secret”
}
Developers define the Objects service to provide a client-side reporting device representing the item to be geofenced. This enables getting object lists and details in addition to adding, editing, and deleting objects.
The Location History API interacts with other APIs, such as the Geofencing API, by sharing objects in the same account. Each object in the Location History API view has two fields: name and properties. After getting the admin key, we should adjust the Location History API and Geofencing API settings using consentForStoringObjectsPositionsHistory. By setting it to true, both services can save an object’s position. Therefore, the Location History API endpoints combine places saved from the Geofencing API and Location History API.
{
  "consentForStoringObjectsPositionsHistory": true,
  "consentForStoringTransitionsHistory": false
}
We must create an object for each entity (person, vehicle, package, smartphone, and so on) we want to locate. We can do this using the Object service’s Add new object endpoint with the POST command like the following:
POST
https://api.tomtom.com/locationHistory/1/objects?key=Your_API_Key&adminKey=Your_Admin_Key
{
  "name": "Ford Expedition Car"
}
Tracking each object results in storing its current position using the Position History service’s Send position endpoint, which may contain geometrical information, such as types, points, and coordinates. We can retrieve historical places by using the get objects Position History endpoint.
Each object records its location (latitude, longitude, and elevation) over time periodically. So, the Location History service collects vast amounts of data over several weeks. This may be more useful than where an object was several months ago when developing a location history database or file containing all previous locations of an object. It can also serve as our data science dataset, as shown in the sample below.

The following section demonstrates how our application consumes, analyzes, and visualizes the location history data.
Our Data Science Toolbox
Now it’s time for data scientists to play with the location history data collected by the TomTom Location History API. We use the most common and favorable data science tools based on the Python programming language. We write our Python scripts inside Jupyter notebooks using Python’s data science packages, such as Pandas for data analysis and NumPy for numerical analysis and data visualization. We also use the Matplotlib and Seaborn packages.
Here we use Anaconda, a highly popular open-source package, to perform all data science tasks and install all the Python packages and libraries needed. By getting helpful information about where objects have been, data scientists can evaluate the historical data of the objects’ locations and then suggest decisions and insights on future routes, fences, speed, or direction. Before starting, we must set up our environment using the following Python code:
import numpy as np   # Package for Numerical Analysis
import pandas as pd  # Package for Data Analysis
import matplotlib.pyplot as plt # Package for Data Visualization
import seaborn as sns # Another Package for Extra Data Visualization
# For Pretty display for plots in jupyter notebooks
%matplotlib inline
# And to allow the use of the function display() for pandas data frames
from IPython.display import display
# To Ignore warnings of loaded modules during runtime execution if needed
import warnings
warnings.filterwarnings("ignore")
To deal with maps inside IPython Jupyter notebooks, we must install a package called Folium with the following command at the Anaconda command prompt:
import folium as TomTom
My_TomTom_Map =
TomTom.Map
(
location=[45.523, -122.675],
zoom_start=10,
tiles='http://{s}.api.tomtom.com/map/1/tile/basic/main/{z}/{x}/{y}.png',
API_key = ' Your_API_Key ',
attr='TomTom Map App'
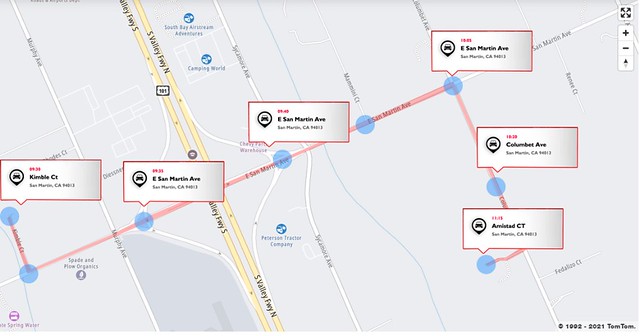
)Using this code, we connect to the TomTom API and we get the output of the required map, as shown below:

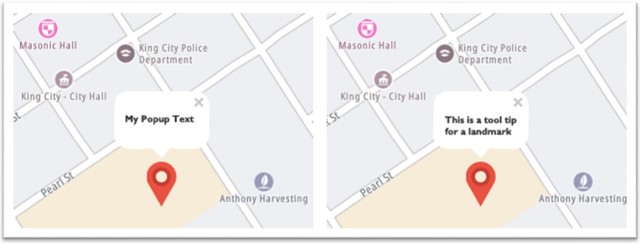
Used with Python, Folium helps facilitate both the binding of data to a map for visualizations and passing rich vector and raster and HTML visualizations as markers on the map. Folium supports numerous marker types, such as a simple leaflet style location marker with a popup and tooltip. We use the following code to display markers on the map in Folium:
mytooltip = "This is a tool tip for a landmark"

TomTom.Marker(
    [45.3288, -121.6625],
     popup="<i>My Popup Text</i>",
     tooltip= mytooltip
            ).add_to(MyMarker)
MyMarker
This yields the following output:
Analyzing Location History Data
To inspect the most exciting insights and indications from the dataset, we need to prepare and explore this dataset. We load the dataset for analysis as shown below:

We use the dtTypes function to collect all the data types used in the dataset, and check it for missing values. We do this using the following piece of code:
full_data.isnull().sum()To investigate the statistics of the given dataset, we use this line of code:
full_data.describe()Visualizing Location History Data
To better understand our data and to find abnormalities and peculiarities as well as feature relationships and inconsistencies in the data, we must visualize it in various ways. To do so, we use the visualization packages matplotlib and seaborn to generate different types of plots and visualizations such as bar plots, box plots, scatter plots, and so on. As a starting point, we check the distribution of data using latitude and longitude to get a data distribution visualization using the Seaborn library, as follows:

To examine how features correlate with each other, we can use a heatmap from Seaborn and the Matplotlib visualization packages. We can see that some features are slightly correlated with each other, using this piece of code:
plt.figure(figsize=(10,11))
sns.heatmap(full_data.corr(),annot=True)
plt.plot()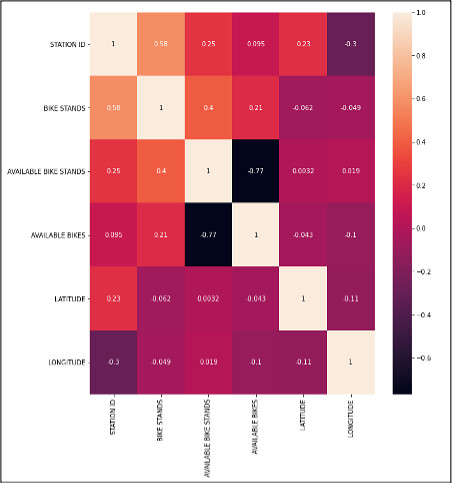
Relationships between features in the dataset could also be clarified and investigated in other ways, such as using a scatter plot. The following code shows a scatter plot of our dataset using the Seaborn package:
sns.pairplot(full_data)
For example, in the analysis above, we can observe a strong relationship between available bikes and available bike stands. As the number of available bikes increases, the number of available bike stands decreases. We can also gain a better idea of their geographical distribution, helping a bike-sharing company, for example, know where to provide more bikes or bike stands, so their customers find one when and where they need one.
Next Steps
In this article, we opened the door to using the TomTom Location History API. After synchronizing our application with the API service, we got data in CSV format or as real-time data while connected to the service. Then we constructed a data science application that digests the data immediately and gives the required analytics and visualizations.
Now that you’ve seen how approachable and easy it is to use the TomTom Location History API, why not sign up and start using TomTom Maps? Register to learn more and experiment with all of the ways TomTom can help you analyze and visualize your data.