Dashboard Analytics FAQs
Introduction
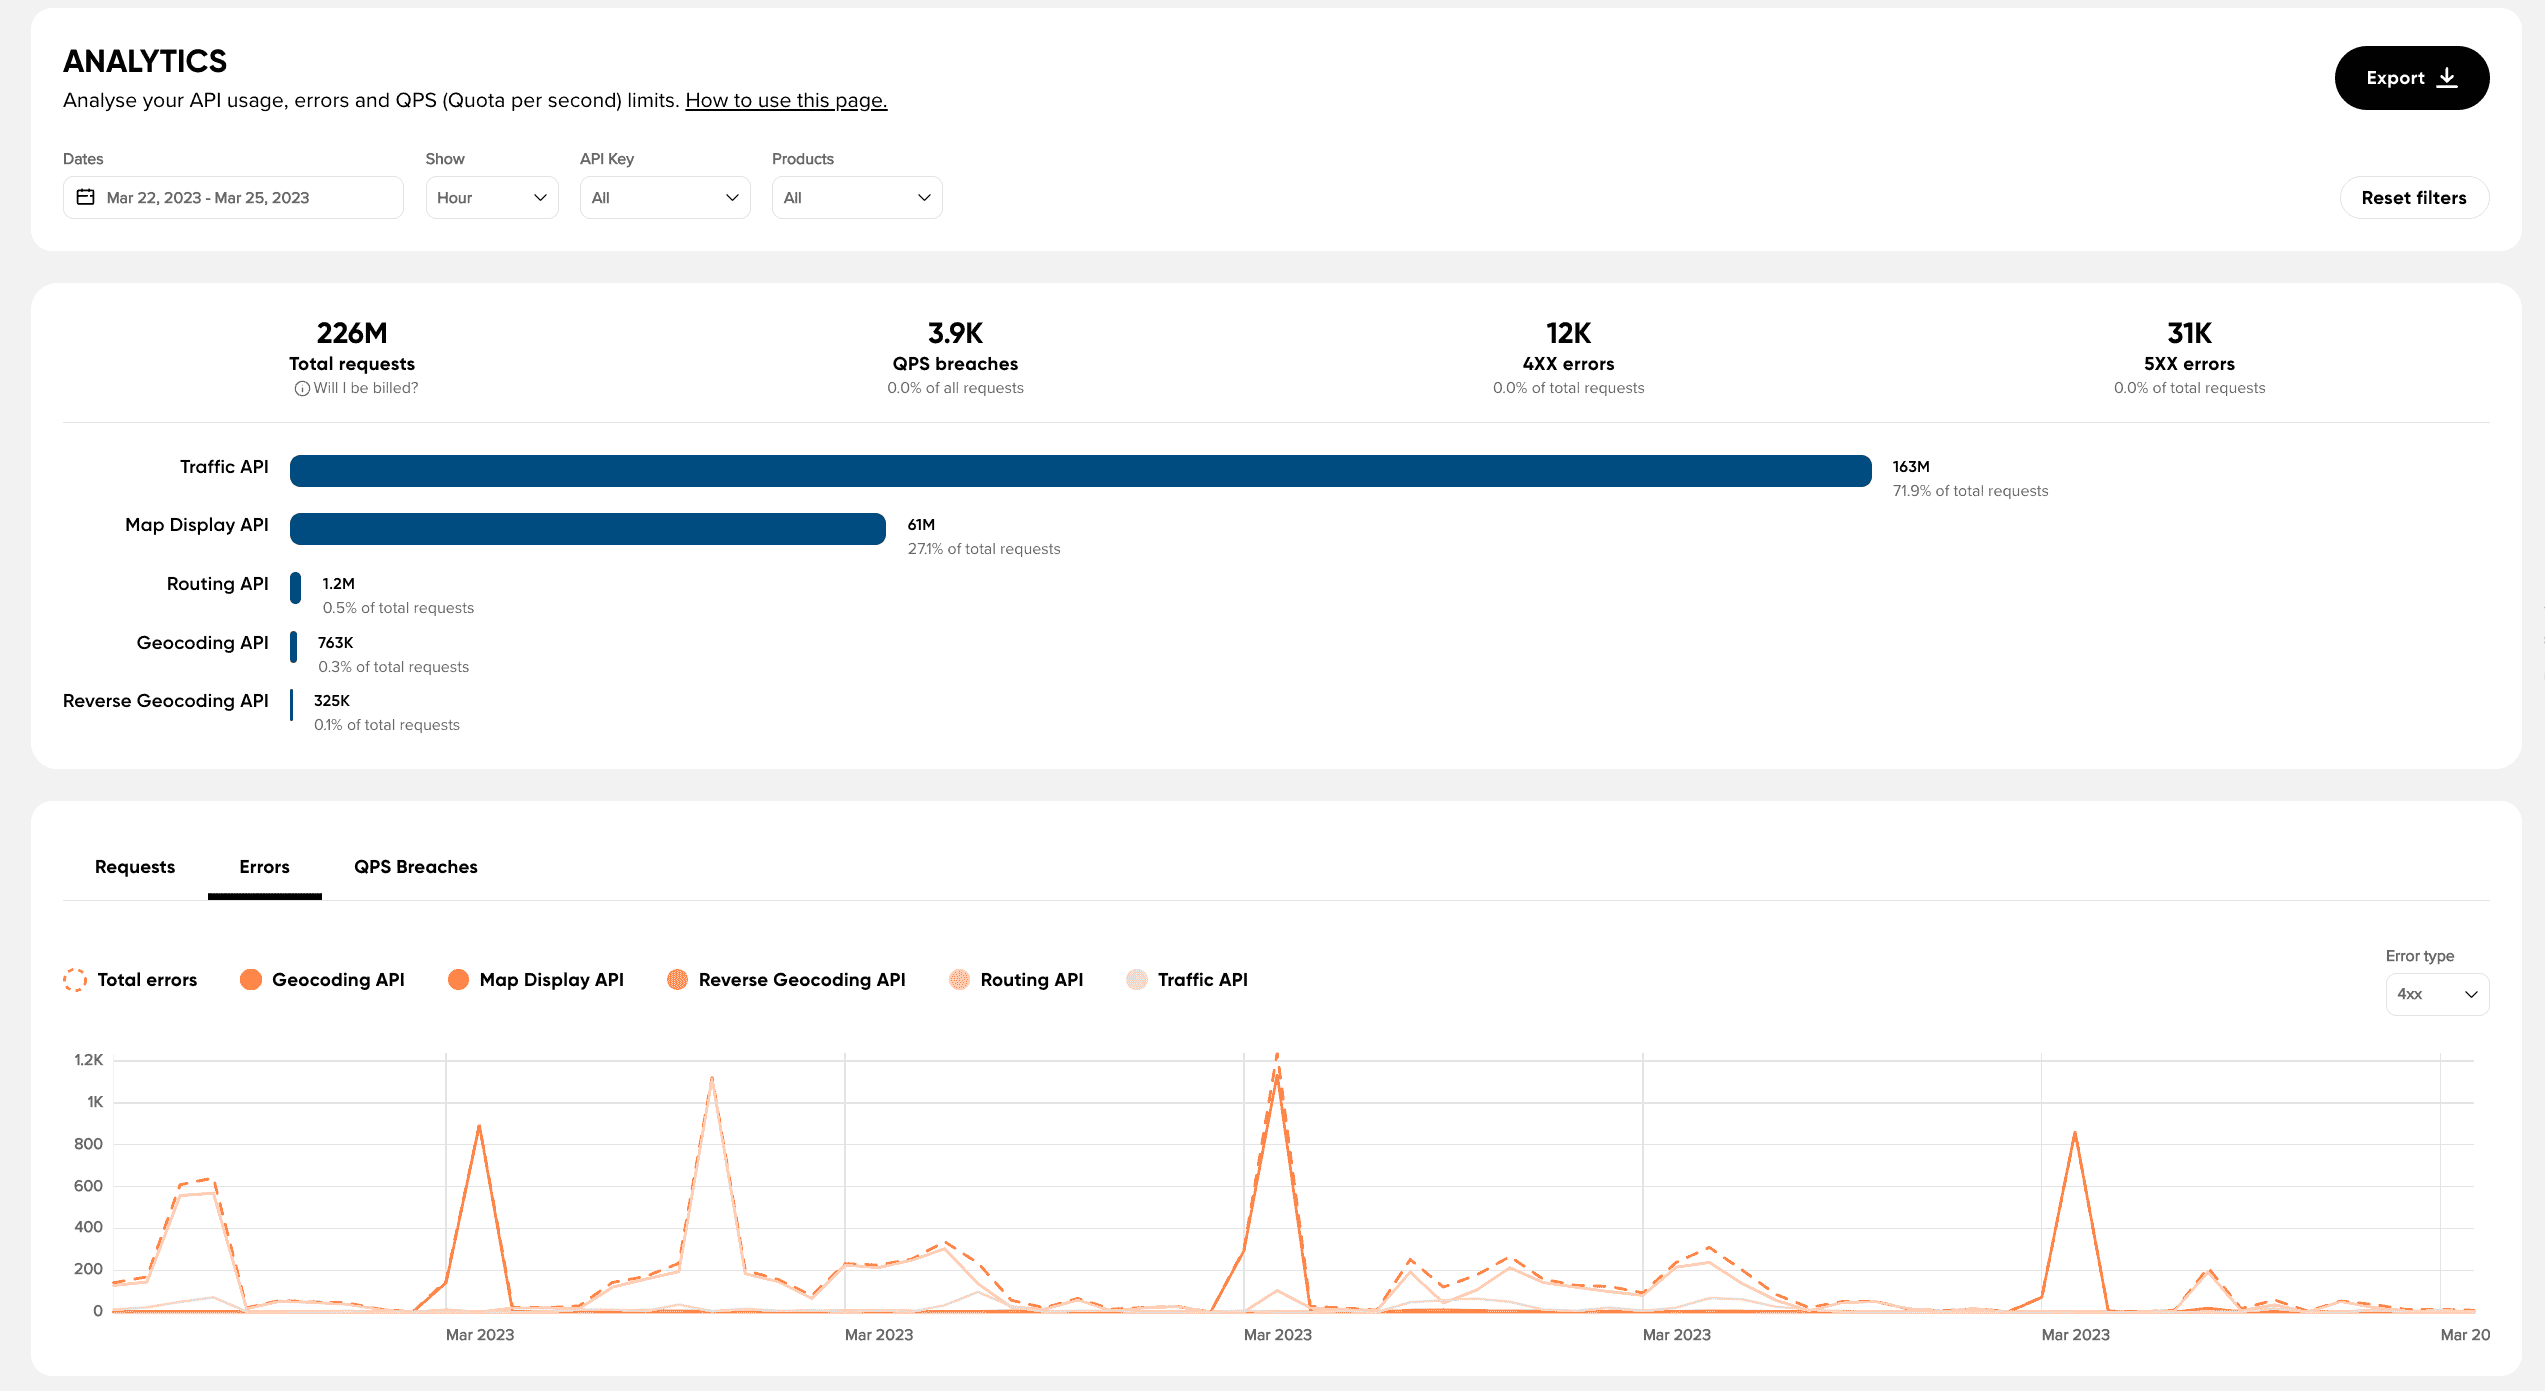
The Dashboard Analytics feature provides customers with full visibility of the main metrics related to API usage such as total requests, errors, and QPS breaches. This documentation will explain how to use the main metrics, filters, and tutorials of this Dashboard Analytics feature.
What are the main metrics
Total requests
- A summary of all the API requests you made.
- These could be different to what you see on your invoice.
- You will be invoiced based on your contractual agreement with TomTom.
QPS breaches
- QPS breaches occur when the number of queries per second exceeds the limit set for an API key and the products (APIs) it is using.
- QPS limits can be changed.
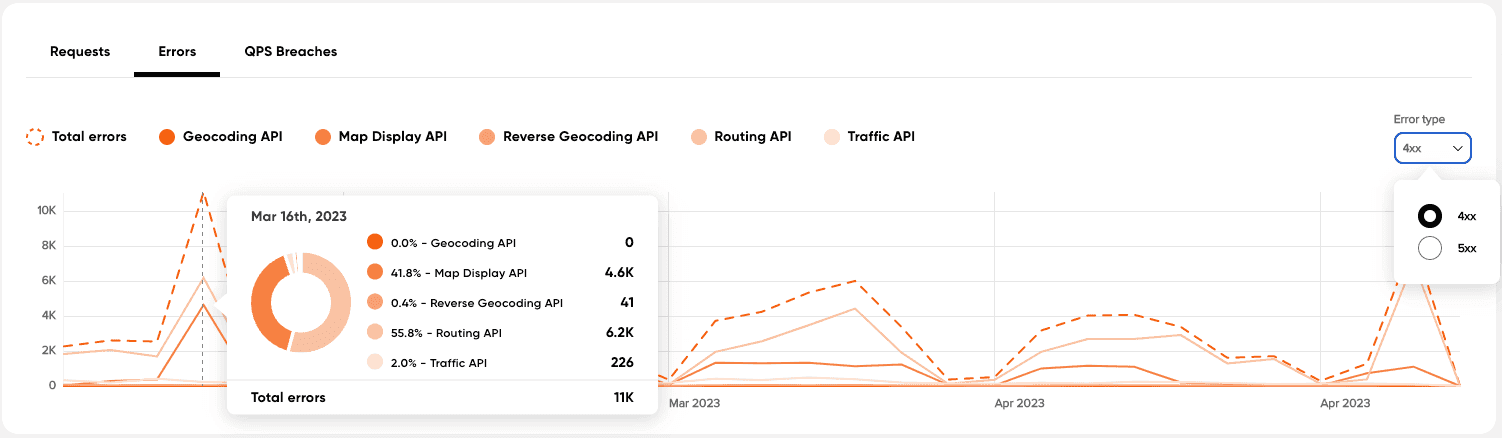
4XX errors
- 4xx errors (such as 404 Not Found) indicate client-side errors, meaning that the client made a request that the server could not fulfill.
- This could be due to an incorrect URL, a missing resource, or insufficient permissions.
5XX errors
- 5xx errors (such as 500 Internal Server Error) indicate server-side errors, meaning that the server encountered an issue while trying to fulfill the client's request.
- This could be due to a server configuration error, a database connection issue, or a problem with the server's code.
Useful terms
QPS
QPS stands for queries per second. It is a measure of the number of queries that can be processed by an API in one second.
QPS limits
The QPS limit refers to the maximum number of queries per second that can be made. This can be changed on the API key page.
What the filters do
There are several ways to zoom in the data using filters.
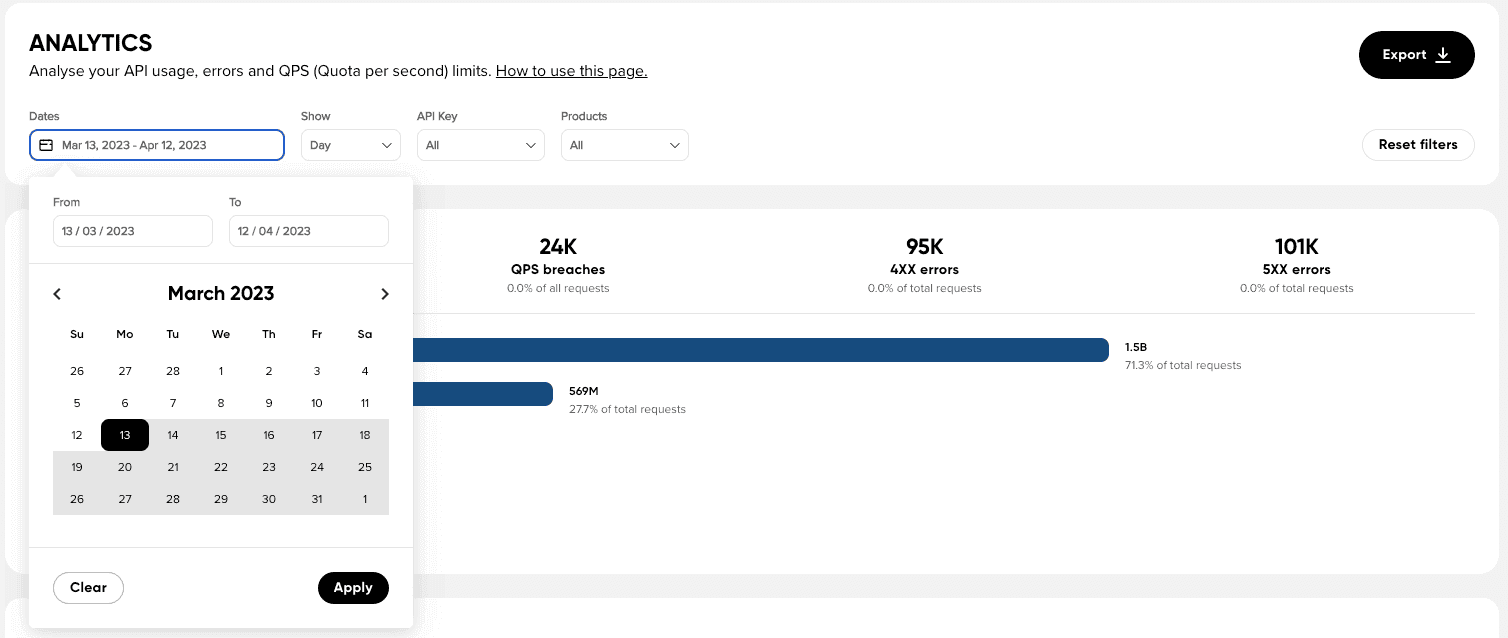
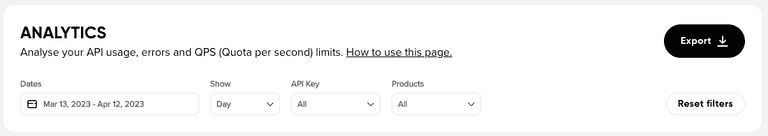
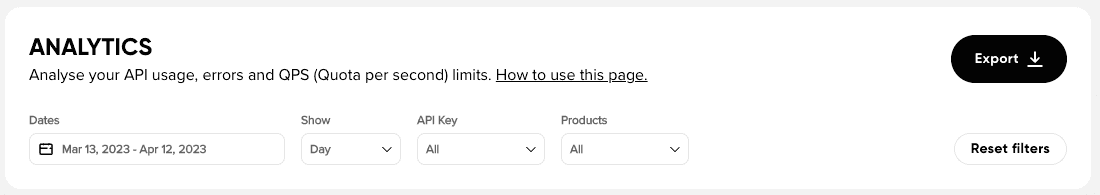
Dates
Easily select the range of dates you need to focus on.
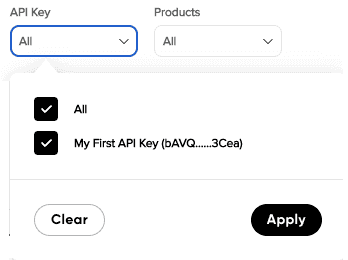
API Key
Shows you all the data for products belonging to a specific API key.
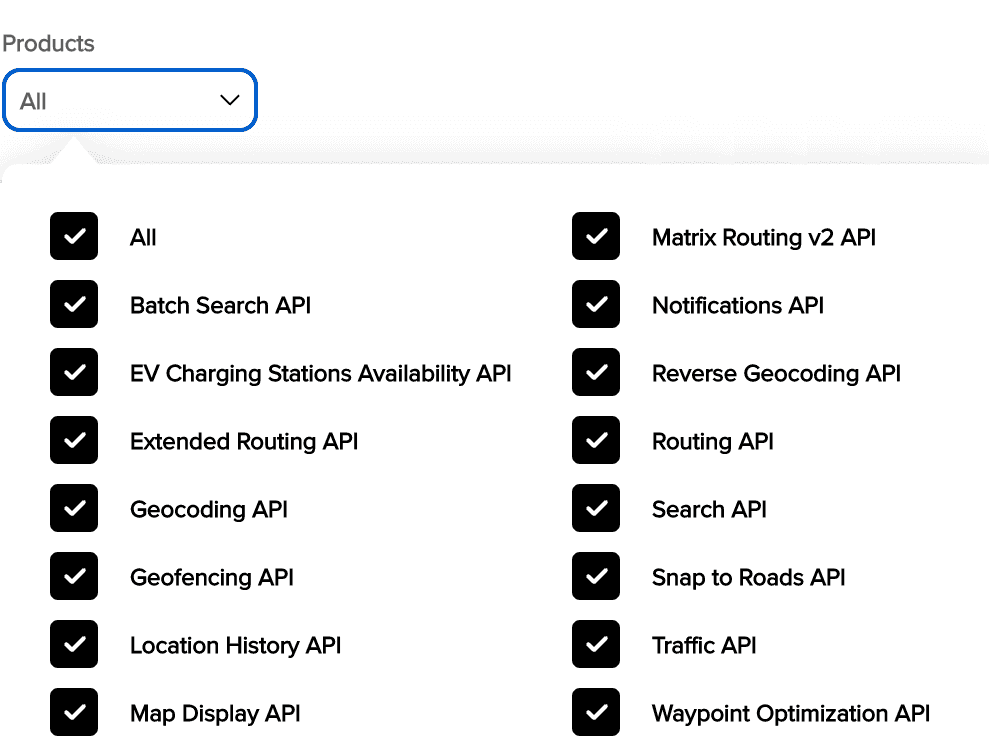
Products
Shows you all the data for products you select
(Note: you must select the API key first, or all API keys).
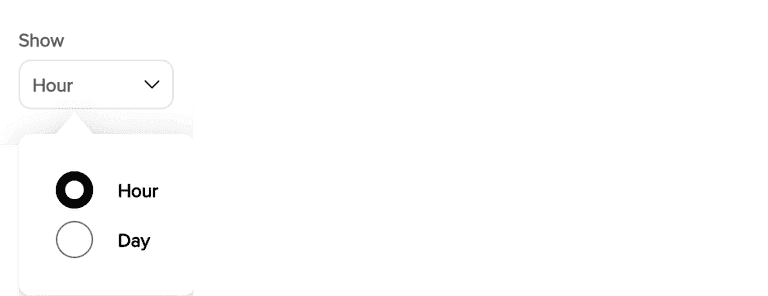
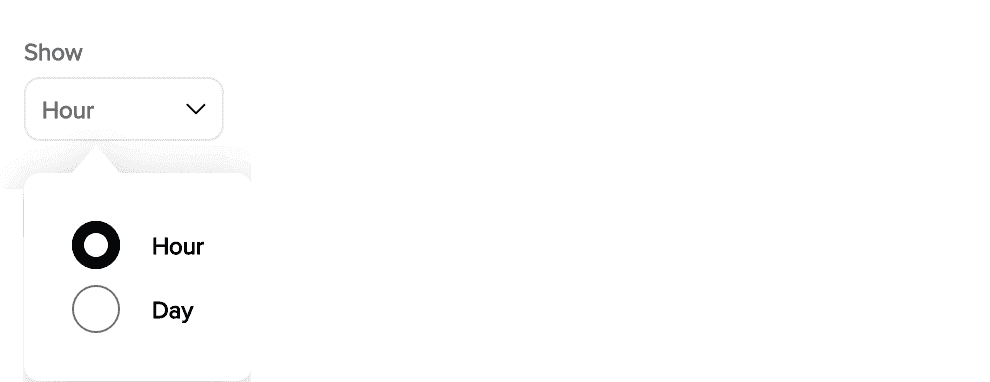
Show This pulldown menu changes the detail level for the graphs.
- Click the dropdown menu.
- Select either "Hour" or "Day".
How to use the page
Investigate overall usage
- Set filter > Date > Zoom level > Key > Product

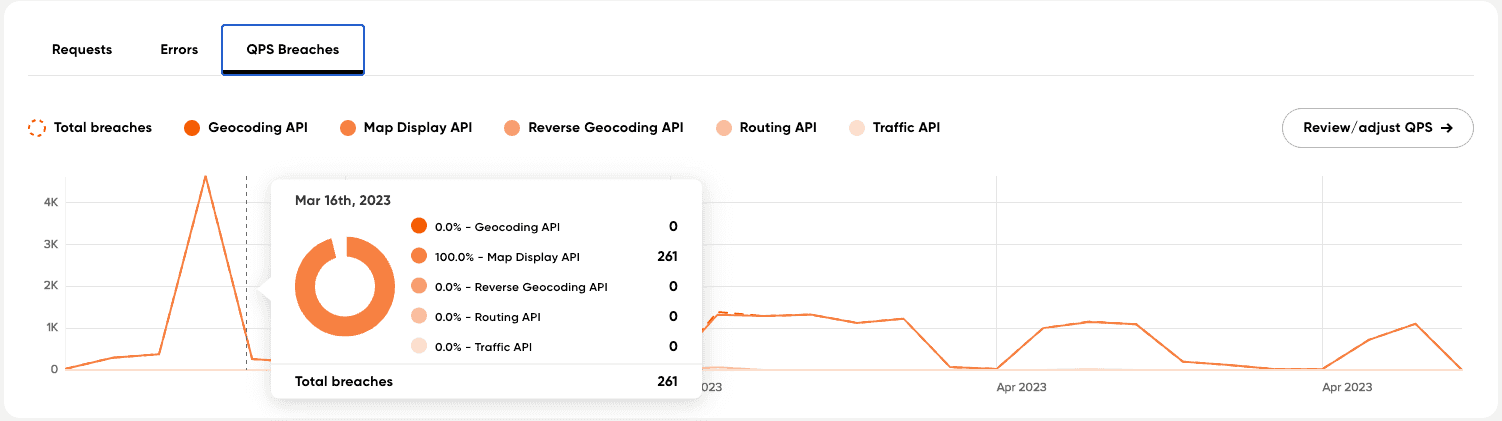
See which products have QPS breaches
- Set filter > Date > Zoom level > Key > Product > QPS breaches tab

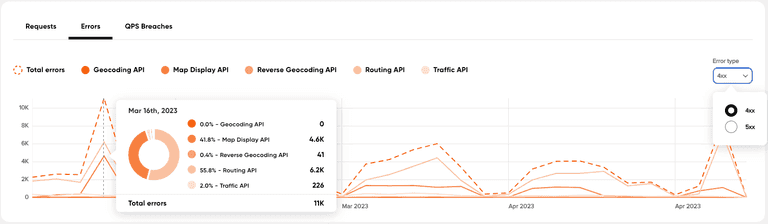
See which products have errors and when they are happening
- Set filter > Date > Zoom level > Key > Product > Errors tab
Download the data
- In order to get a download file with your data, click "Export".
- CSV file, this is the default file format.
The columns of the CSV file are:
- Date/Time
- Product name
- Service name
- Application
- Total requests
- QPS breaches
- Total errors
- Additional columns with the Error codes