Traffic Stats: Stadium traffic on match day
Question
How does traffic around a football stadium differ between a match day and a non-match day?
How-to explanation
Major events like football matches or city marathons affect traffic. But how significant is the impact, and where does it occur?
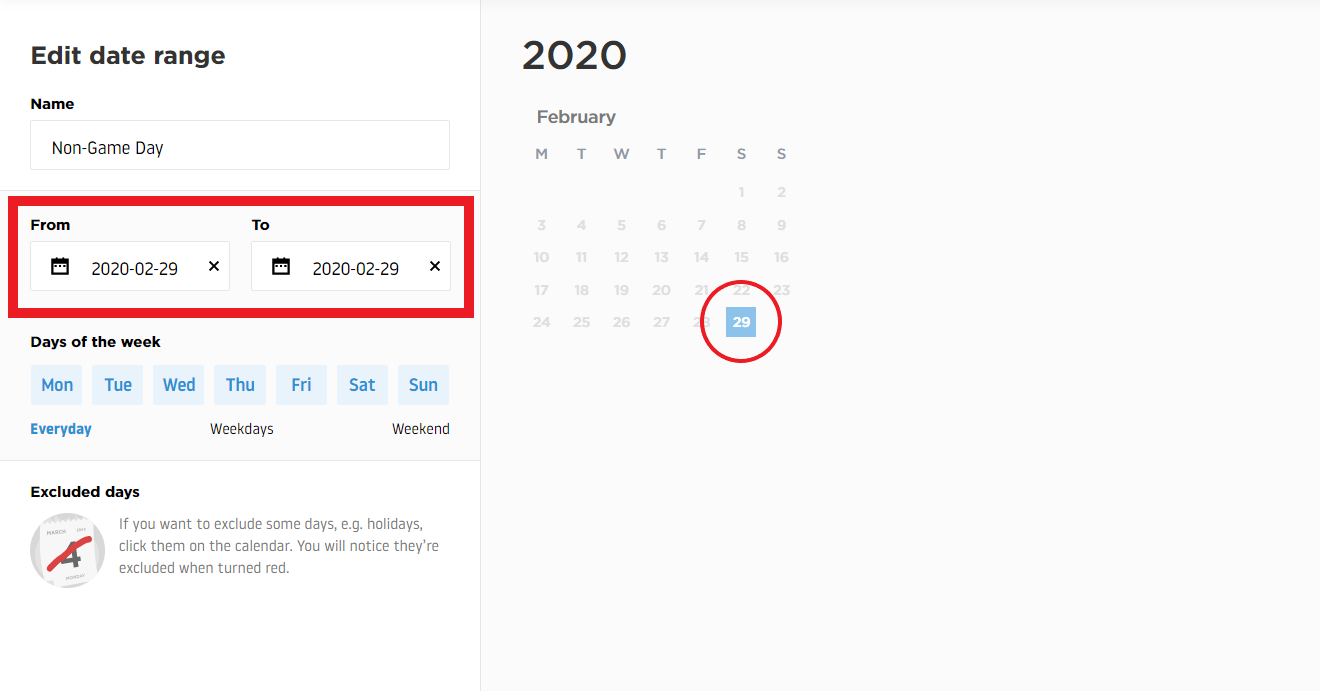
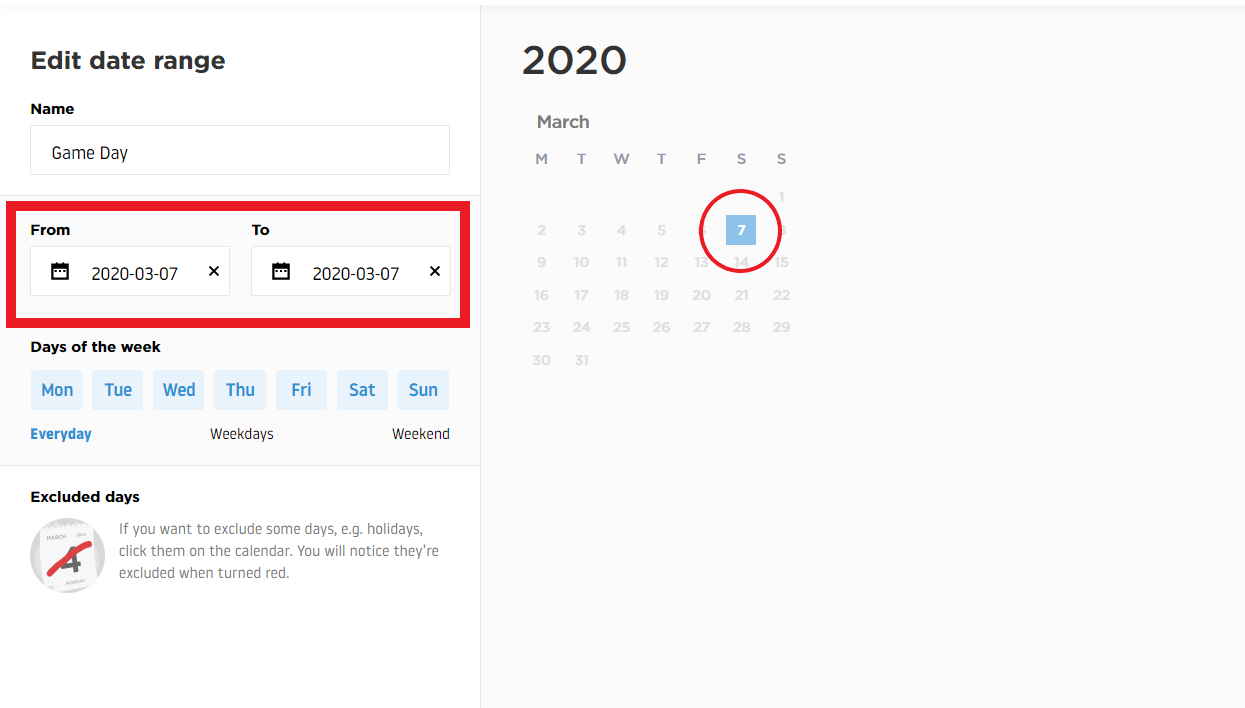
With Traffic Stats, we will generate two Area Analysis reports for a football stadium in Germany. The reports will cover the same area but have different date ranges: one for a match day (February 29, 2020) and the other for a non-match day (March 7, 2020).
To create two reports with the same area, you have two options:
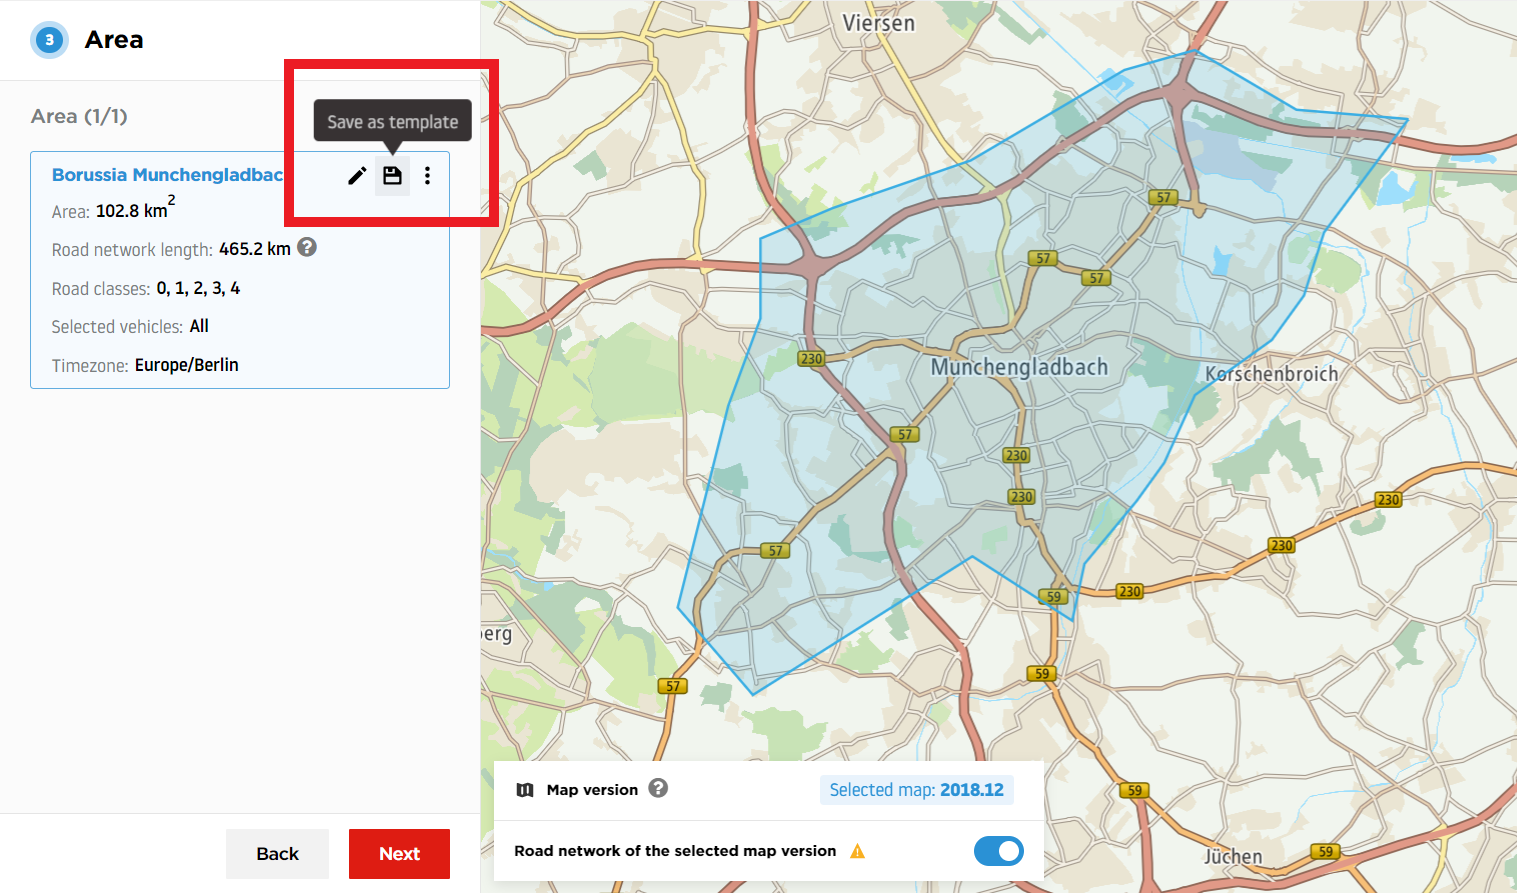
- After defining the area in the first report, save it as a template (Figure 1).
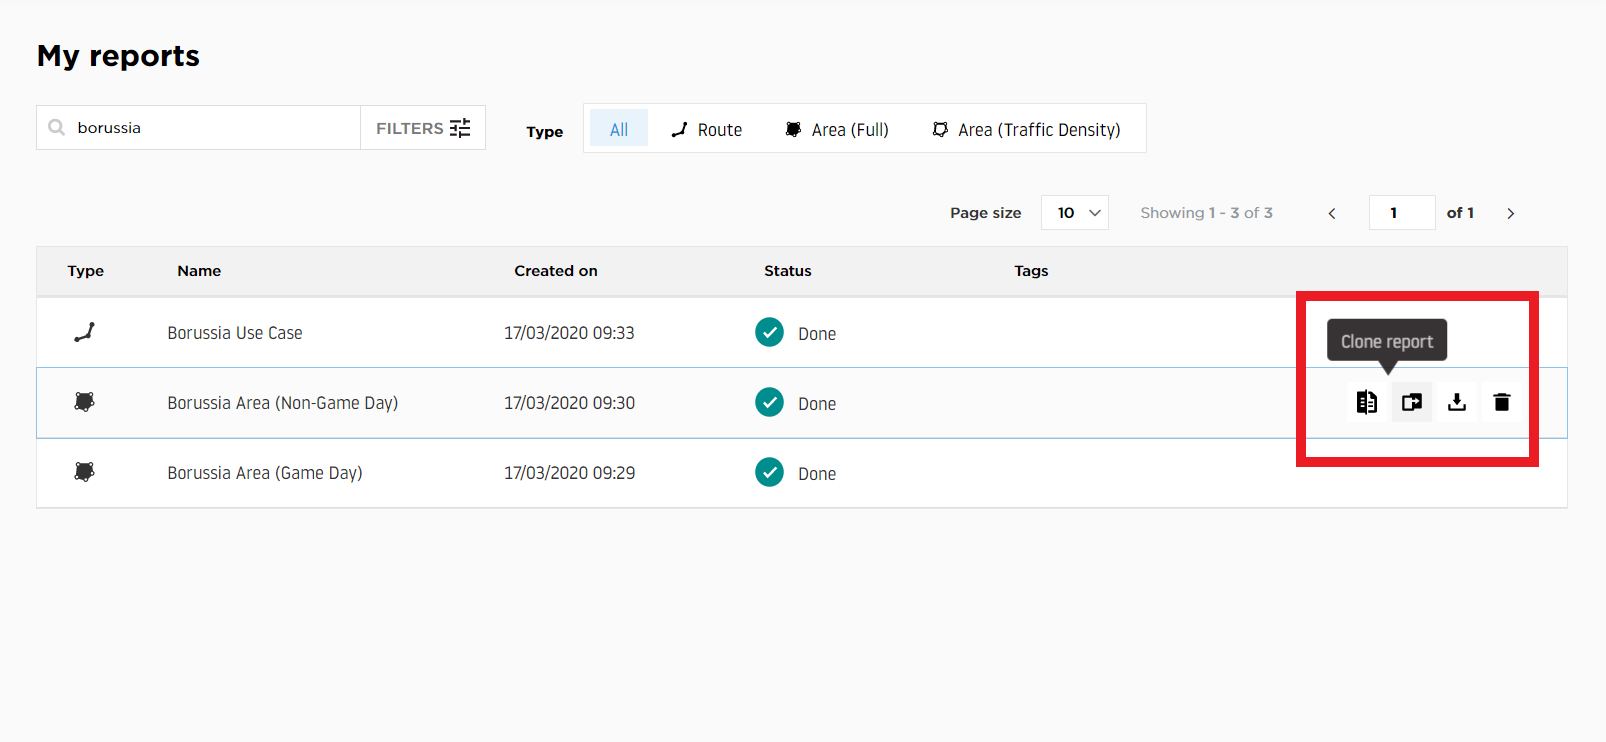
- Finalize the first report, and once the results are available in the My Reports section, clone the report (Figure 2).
Both reports analyze a single day: one for a match day and the other for a non-match day (Figures 3 and 4).
Reading the results
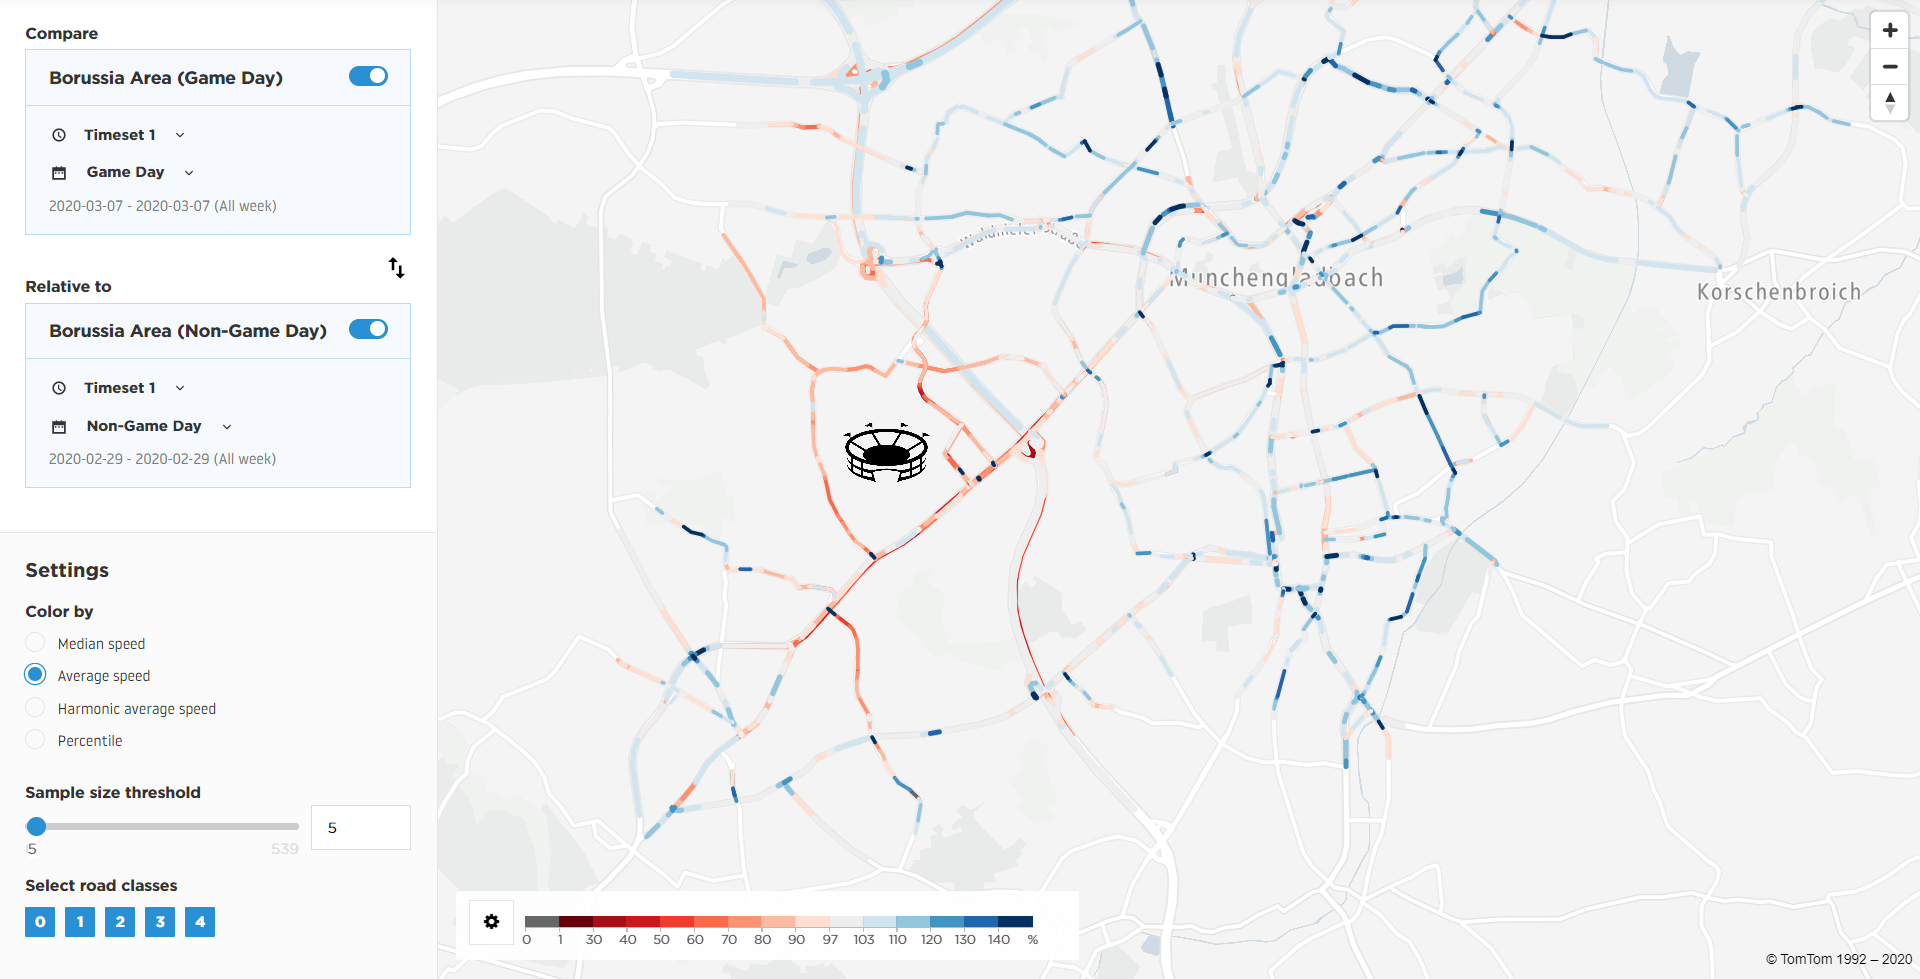
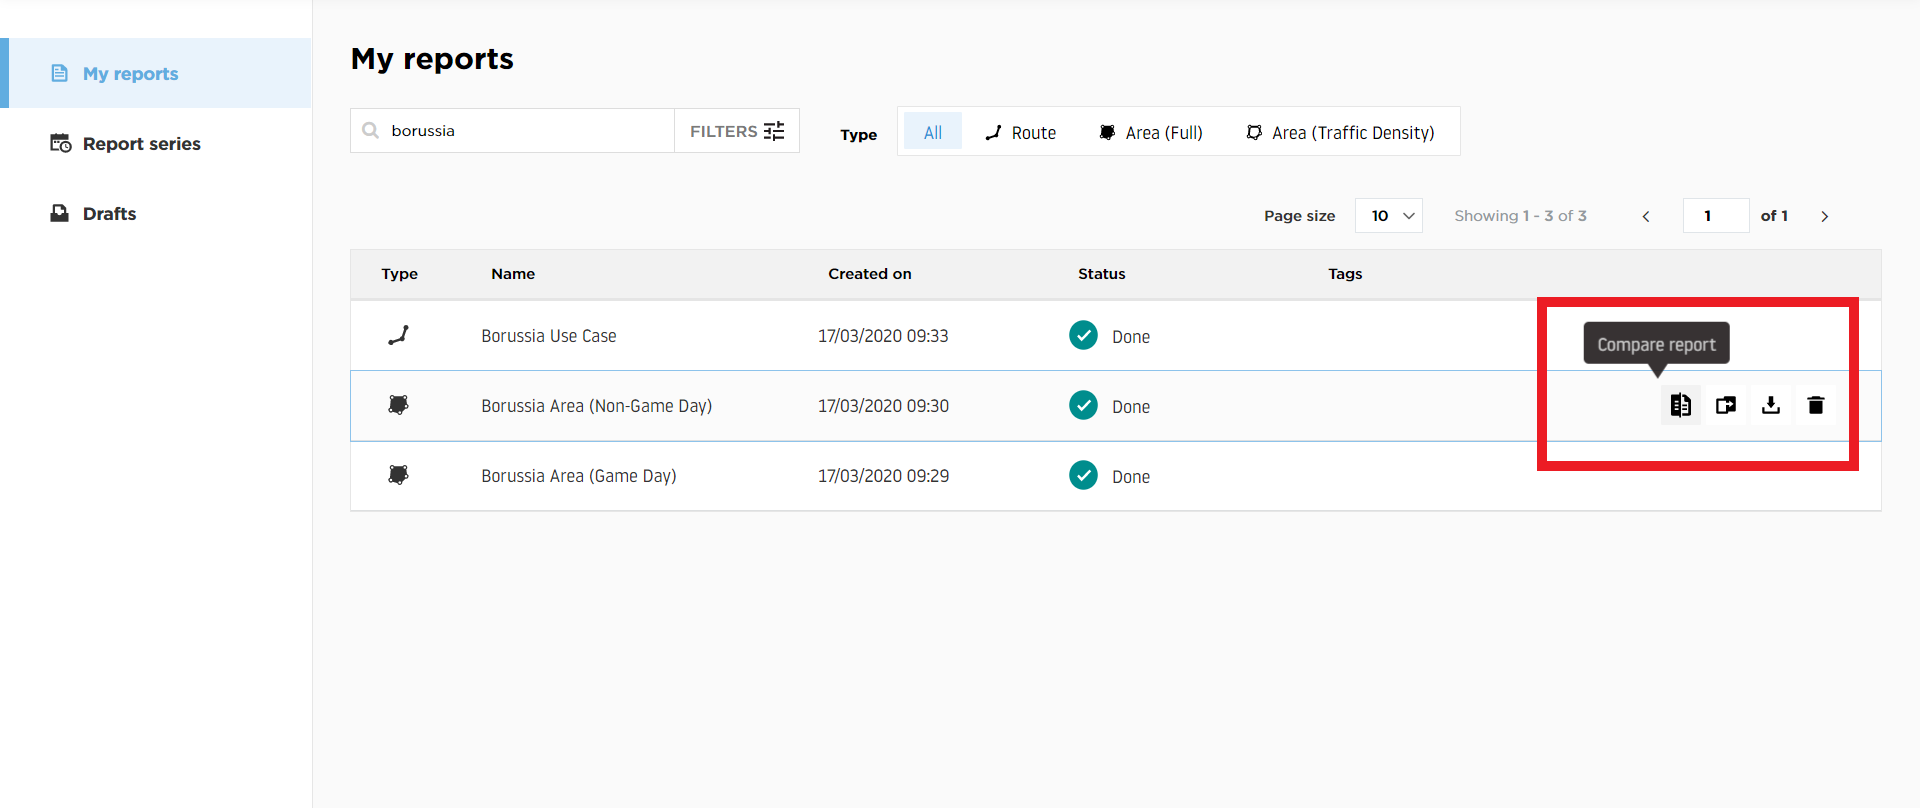
Once the two reports are complete and available in the My Reports section, use the Compare Report feature. This feature is available for all Area Analyses with the same area definition (Figure 5). It allows you to overlay the results from the two reports and visually identify which roads perform better or worse.
Conclusion
The report comparison clearly shows that on a match day, the streets around the stadium perform poorly in terms of average speed and travel time (Figure 6).
By downloading the data from both reports, you can easily identify pain points and bottlenecks. Based on event and traffic management initiatives, you can develop clear traffic guidelines, including suggestions for alternative access routes, load balancing across multiple parking lots and incentives for varying arrival times.