O/D Analysis - DXB Dubai airport (COVID-19 quarantine)

Question
How was the volume of trips at Dubai International Airport (DXB) affected by the COVID-19 quarantine measures?
How-to explanation
In highly attractive areas, such as DXB Airport, the origin of trips is less relevant compared to the destination. With the COVID-19 crisis directly impacting the tourism industry, the volume of trips to airports worldwide decreased significantly.
Therefore, our focus region will be a single polygon: DXB International Airport. To analyze the progression of quarantine measures, we will conduct a monthly comparison between January and April 2020 (Figure 1).
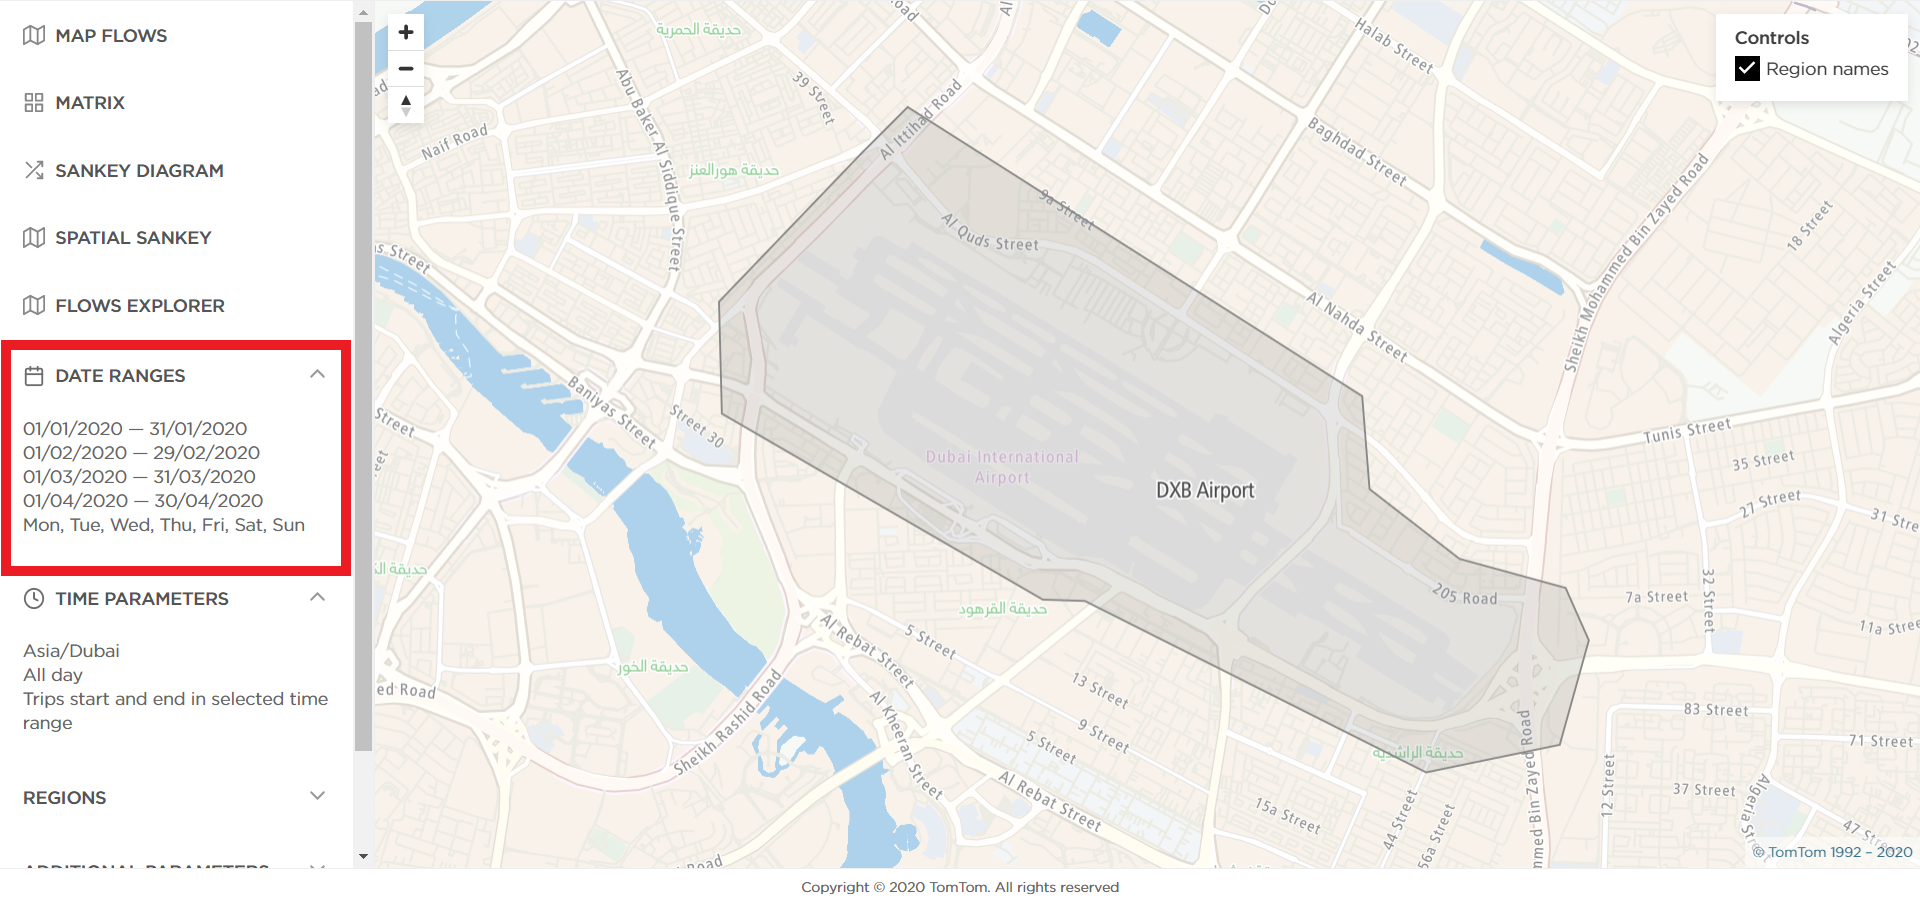
Reading the results
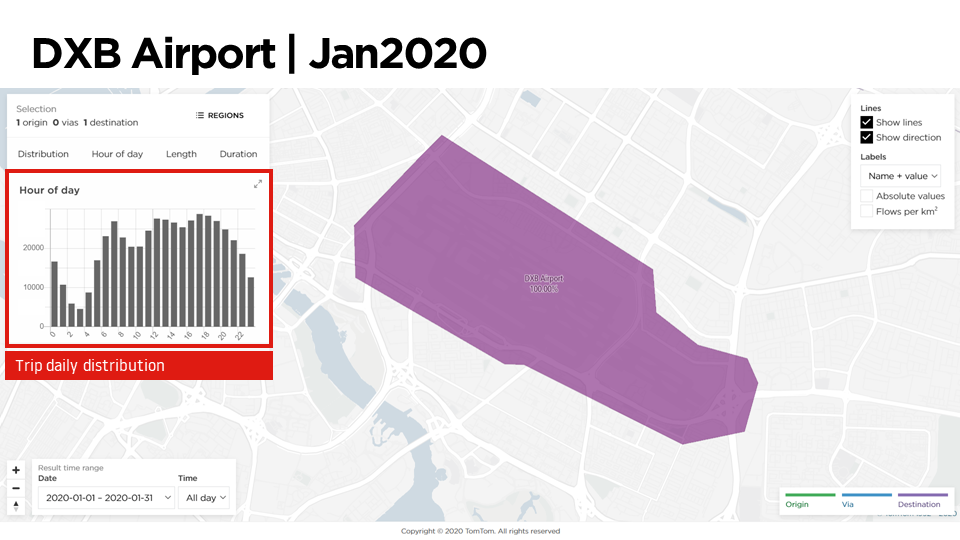
In O/D Analysis reports with a single polygon, the most insightful visualization is the "Flows Explorer," where "External" trips can be defined as "origins" (i.e., all trips that started outside the "DXB Airport" region). By setting "DXB Airport" as the destination, we can gain a clear view of the trip distribution throughout the day (Figure 2).
Progress can be evaluated by comparing data from the following months (Figures 3 to 5).

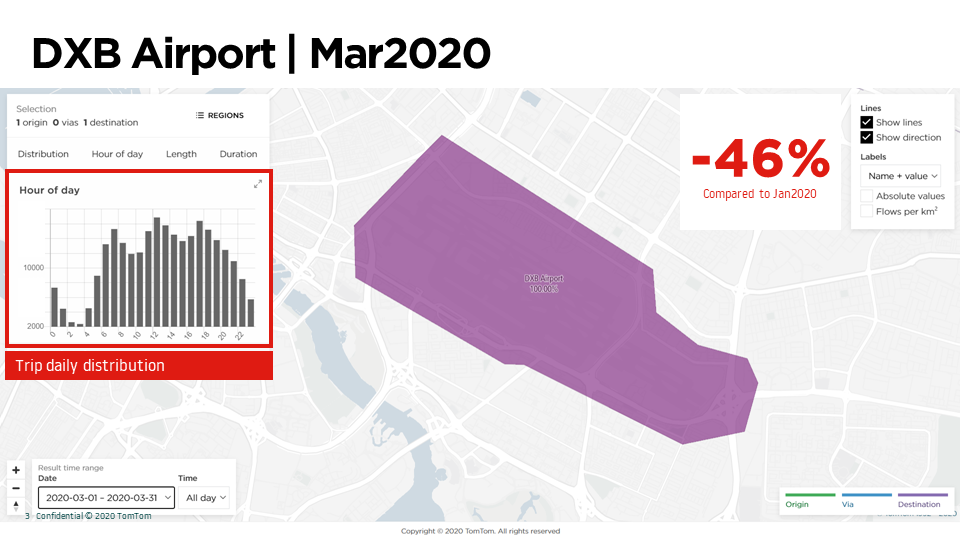
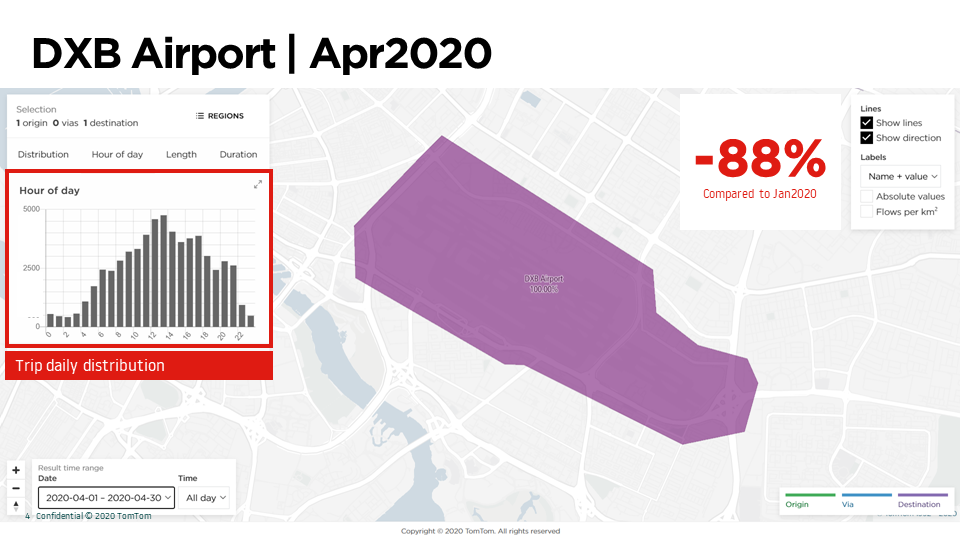
Conclusion
Since the beginning of the quarantine measures in Dubai, UAE, the volume of trips to Dubai International Airport decreased significantly. Using TomTom's O/D Analysis data, we can observe how this decrease progressed month by month, culminating in an 88% reduction in trips when comparing April to January of this year. To make the analysis even more comprehensive, we could extend it to include data for May and June to understand whether the volume of trips is recovering to pre-coronavirus levels.
TomTom's O/D Analysis is a rich, comprehensive solution. In just minutes, its GPS-based trip analytics provide in-depth insights across wide areas and flexible time periods. This approach is far more efficient and yields higher-quality results compared to manual questionnaires or hardware-based data collection methods (e.g., sensor cameras with limited area coverage).