O/D Analysis - Road vs. ferry in Sweden

Question
For trips from Lysekil, Sweden, heading east or south, what is the preferred route? Is it the ferry between Finnsbo and Skår or the road north of the Färlev Fjord?
Do drivers take the longer road route to avoid potential ferry waiting times and busier hours?
How-to explanation
In the analysis's region definition, Lysekil was the primary origin area.
The destination was strategically positioned to capture trips that would justify using the ferry, as it offers no advantage to travelers heading toward northern Sweden.
Two via regions were defined accordingly: one at the ferry access point and another along the northbound road, near the junction leading to the main highway.
Reading the results
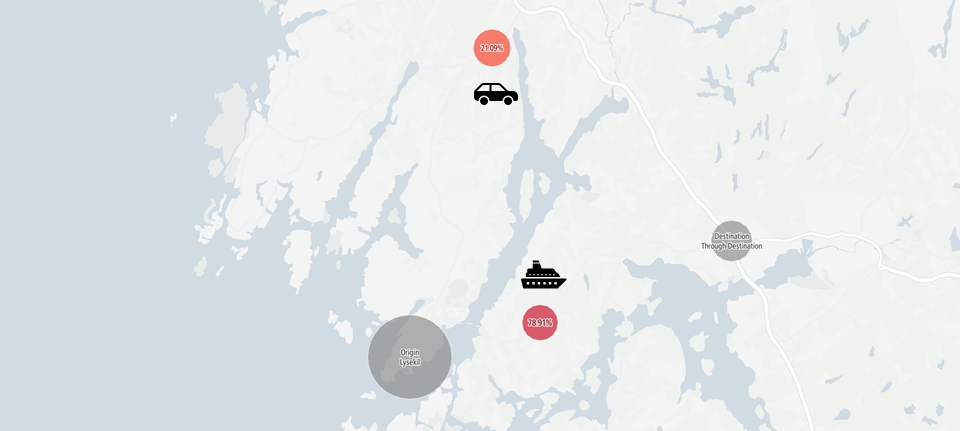
The Map Flows visualization is highly representative. On average, approximately 70% of trips use the ferry, despite potential waiting times (Figure 1).
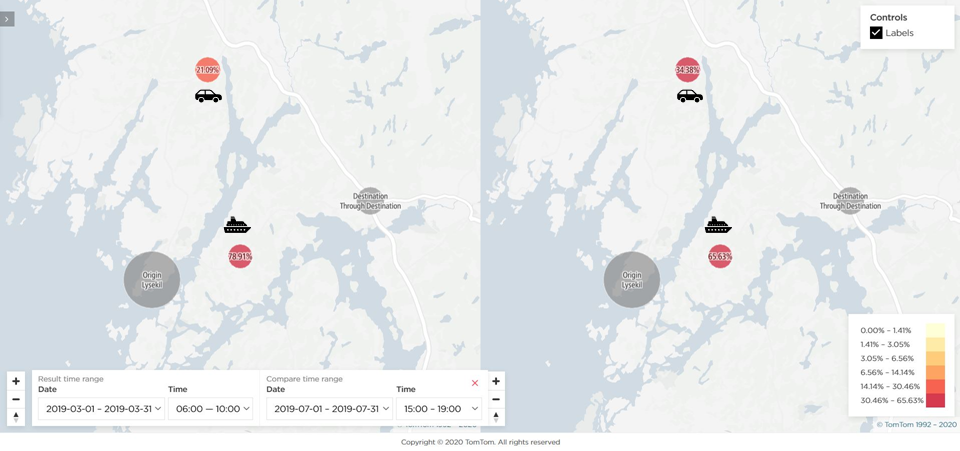
It is important to note that seasonal differences can have a significant impact. When comparing the results from March 2019 to July 2019, ferry usage decreases by 10% (Figure 2).
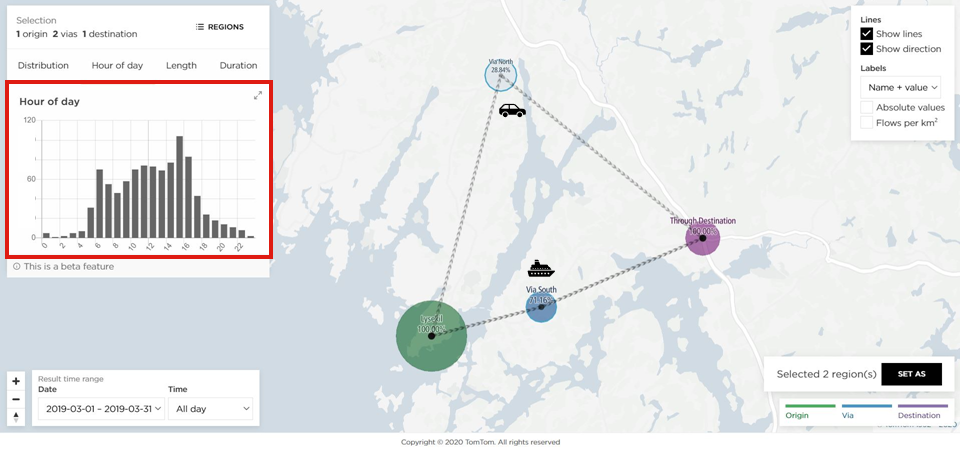
Using the Flows Explorer visualization, we can delve deeper into the analysis by examining the trip distribution throughout the day (Figure 3). The horizontal axis represents the 24-hour time distribution, and the vertical axis shows the trip volume for each hour. This view provides quick insights into the busiest hours and potential actions to promote alternative usage or access strategies.
Conclusion
One might assume that drivers prefer to take a longer road trip to avoid the hassle and waiting time of a ferry. However, a quick O/D Analysis reveals that the vast majority (almost two-thirds) of all trips heading east or south in Sweden choose the ferry.
The TomTom O/D Analysis offers a rich, comprehensive solution with an attractive cost-to-value ratio. In just minutes, the GPS-based trip analytics provide an in-depth analysis covering large areas and flexible time periods. This approach is far more efficient and yields better results than manual questionnaires or hardware-based data collection methods (e.g., sensor cameras with limited area coverage).