TomTom’s Top Five: A Recap of our Most-Read Blogs in 2020
&w=256&q=90) Shannon Stroud
Shannon Stroud
For the entire world, a lot of things changed in 2020 – including the way we move. Regardless how the world moved in 2020, developers still needed to keep their maps fresh – and we tried our best to provide the resources you need to do so. This year, our readers favored tutorial based blogs to add map data to their applications. Here’s a peek of what they really loved reading this year:
A look back at your favorite blogs in 2020
For the entire world, a lot of things changed in 2020 – including the way we move.
One thing that didn’t change? The need for maps with real-time updates. Regardless how the world moved in 2020, developers still needed to keep their maps fresh – and we tried our best to provide the resources you need to do so.
This year, our readers favored tutorial based blogs to add map data to their applications. Here’s a peek of what they really loved reading this year.
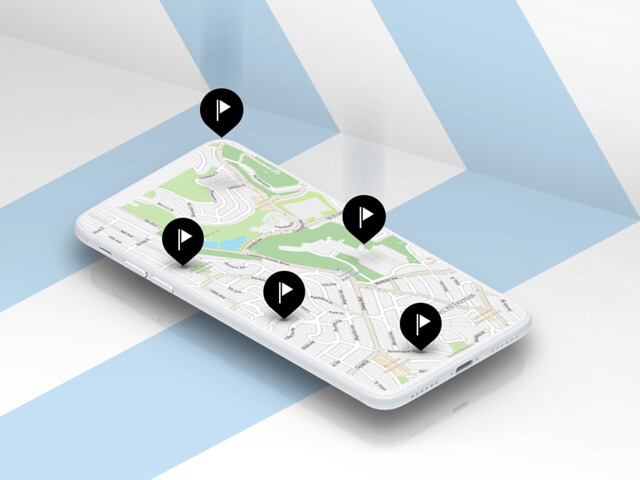
Displaying Multiple Locations Using TomTom's Maps SDK
It’s no surprise this was users’ most-loved blog of 2020. We published this in 2019 with the hopes of helping new TomTom maps APIs users with adding location to their application or platforms. So, if you are looking for a step-by-step tutorial on how to download the Map SDK for Web, display a map, add markers, add multiple locations points and style your map – then start with this tutorial.
This is a great article not only for new TomTom API users, but also beginner developers, as it walks you through how our Maps SDK can make it super easy to add location to your application. The best part is, we’ve got you covered with snippets of code to that you can copy and paste, and of course, screenshots of the results you should be getting.
Read it Now
Need more tutorials on how to get started? We recommend a few of our beginner tutorials to help you start building:
How to Add Traffic APIs to your Location-Based App
So, you’ve added a map to your app filled with data points, POIs, and directions, but now you’re ready to provide next- level road insights to your users. What’s next? Let’s add a traffic layer to make things more interesting.
The Traffic API is one of the building blocks for you to craft a better user experience with real-time traffic data. In this article, we will dive into how TomTom’s Traffic API works and how we can leverage the Traffic suite of web services (which are based on the real-time traffic data from TomTom Traffic) to retrieve detailed traffic information about an area. This data can be used in your web and mobile applications and can provide users with the most up-to-date traffic information. We will be making use of some JavaScript with ReactJS, as well as bash scripting in the examples.
Read it Now
Not interested in reading the full tutorial? Check out our YouTube video to see how the Traffic API can add value to your map:
Autocomplete and Suggestions with the Search API
TomTom’s Search API with Autocomplete enables you to provide more meaningful results to your application’s users.
The Autocomplete feature in our Search API is an extremely valuable addition to the rest of our APIs. In the short example, we show users how easy it can be to provide continuous search result to your application so that your users can narrow their focus and get more specific results.
Read it Now
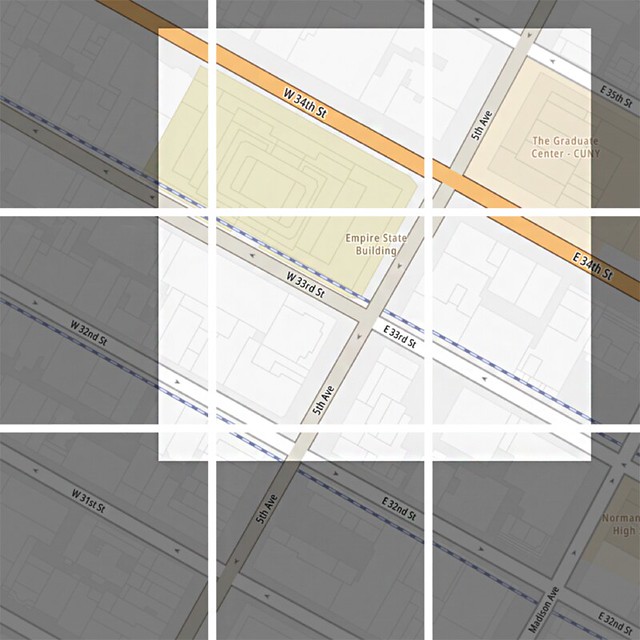
Understanding Map Tile Grids and Zoom Levels
In this blog, we ask an age-old question: “How do you take a round object and display it on a flat surface?” Welcome to the world of map making!
Map makers and cartographers have been exploring this question for centuries – but the good news is that each day we make improvements to creating and displaying an accurate map. TomTom's location services employ a Spherical Mercator projection of the earth's surface to create the underlying map representation used by the services. The map data is further delineated by zoom levels and tile grids that provide the exact visual representation you need to display a map on a web site, mobile map or other devices. In this article, we'll explain:
How maps are designed
How map data is represented in the TomTom Map Display API in tiles
How zoom levels affect what information appears on map tiles
Read it Now
Using GeoJSON Geometry Data to Draw Borders with TomTom Maps
Geographic Information System (GIS) data can come in a lot of forms, which can lead to confusion in how to represent data. For example, what would you call the borders of a certain county? Would you call it a border, coordinates, or an outline? Would you use longitude and latitude, or some other coordinate system, like distance from a given user? Mix that with the fact that there are multiple map APIs and other applications that will want to deal with geographical data, and you’re likely to end up with a lot of unnecessary format-parsing code.
Fortunately, to solve this problem, a standard has emerged. Specifically, the standard we're talking about today is GeoJSON. GeoJSON is a standard that was initially created in 2008 by the Internet Engineering Task Force, which is a volunteer-staffed, non-profit, open standards operation, with the most recent version, RFC 7946, being made in 2016.
In this article we’ll look at the GeoJSON format, then use a GeoJSON data set to draw regional borders on a map with TomTom JavaScript Maps SDK for Web.
(If you want to know how TomTom settles border disputes, read this blog: “TomToms Geopolitical Views: Culturally Sensitive Map Development”.)
Read it Now
Alright, there you have it – our five most-read blogs from 2020. Of course, once you finish this list, make sure to check out these 2020 honorable mentions:
The Benefits of Geocoding and Structuring your Address Data: Learn how to easily clean up your address data without difficult tools.
What is Geofencing? Read how virtual boundaries on a map can track assets and enable to connect your users to the things that matter most to them.
How to Schedule Routing for Truck Drivers: Learn how to add a route scheduler using Fuzzy Search and Geocoding.
What were some of your favorite or most helpful blogs from this year? Share with us in the comments or in our forum, and don’t forget to connect with us on Twitter, YouTube, and Reddit.
Happy mapping!
* Required field. By submitting your contact details to TomTom, you agree that we can contact you about marketing offers, newsletters, or to invite you to webinars and events. We could further personalize the content that you receive via cookies. You can unsubscribe at any time by the link included in our emails. Review our privacy policy.