Using TomTom Data to Improve Delivery Routes
)

TomTom’s historical traffic data helps data scientists analyze the best route for delivery drivers. Learn how to use the Search API, Routing API, Python, and your favorite data science tools to find start and destination point coordinates, access route information, and visualize the best route.
Imagine a commercial bakery delivering to dozens of stores daily along fixed routes. The grocery stores expect to receive their goods on time, while the bakery wants to optimize its delivery routes. After all, when drivers arrive at their destinations more quickly, the bakery saves money on fuel, wages, and vehicles.
Route efficiency enables the bakery to expand its customer base. However, with continuously shifting traffic, construction, and road conditions changing, finding the optimal route can be incredibly challenging. This is precisely the type of problem that a data scientist can solve.
Building a tool to find the best route requires the data scientist to obtain – you guessed it -- data. Luckily, TomTom’s wealth of historical traffic data can help pinpoint the average best route for any given time of day. A data scientist can combine this historical data with TomTom’s Routing API and Search API to create an easy-to-use app and help the bakery plan its ideal delivery routes.
This Python tutorial will use the Routing API to retrieve travel routes. The Search API will come in handy for obtaining the starting and destination point coordinates. We’ll use the two APIs to create a route adviser app for the drivers based on the shortest route.
Prerequisites
You’ll need a TomTom API key to follow this tutorial. Sign up for a freemium developer account to obtain your key with thousands of daily requests. You can immediately use your account for commercial apps, then pay as you grow.
You will also need access to a notebook-based editor like Jupyter Notebook or Google Colab.
Using the Search API
The Search API helps us find a location’s exact coordinates.
First, get the Search API. Next, go to the API Explorer tab to view the endpoints. We can get our coordinates using the Fuzzy Search endpoint. We’ll pass the location in the query parameter and set the response format (ext) to JSON.
Our endpoint URL is:
https://api.tomtom.com/search/2/search/Los%20Angeles.json?minFuzzyLevel=1&maxFuzzyLevel=2&view=Unified&relatedPois=off&key=*****Experiment with entering the parameters, clicking the EXECUTE button and observing the responses. We’ll dissect the responses as we proceed through the tutorial.
Making a Routing API Endpoint
First, get the Routing API. You can read about the API on the Documentation tab.
Next, go to the API Explorer tab to find the endpoints to receive parameters. We'll use the first endpoint, Calculate Route, with a GET method. When you click the down arrow, you’ll see the parameters’ names and descriptions.
Enter your location’s coordinates in the locations parameter, then set the contentType to JSON, maxAlternatives to 5, and instructionsType to text. Pass the departure time in the departAt parameter. You can also use other parameters if you wish.
The endpoint URL looks like this:
https://api.tomtom.com/routing/1/calculateRoute/34.05224,-118.24334:33.68591,-117.82472/json?maxAlternatives=5&instructionsType=text&departAt=2022-02-10T08:00:00&key=****Getting Started with Data
Start by importing the modules below into your notebook. We’ll use pandas for data manipulation, urllib.parse for processing the URLs, requests for getting responses, and the rest for data visualization.
import urllib.parse as urlparse
import pandas as pd
import requests as rq
import matplotlib.pyplot as plt
%matplotlib inline
import seaborn as sns
Next, we set our API key, the two points, and departure time. We’ll pass all the variables except the API key through a user interface such as a form to make our application dynamic. The API accepts the YYYY-mm-ddHH:mm:ss time format.
__API_KEY__ = "<your-api-key>"
departure_point = 'Los Angeles'
delivery_point = 'Irvine'
departure_time = '2022-02-10T08:00:00'
Then, we create a function called search_city_coords to get the city coordinates. We pass in the location name and our key. The application gives these parameters to the endpoint URL. Then, we get the response in JSON format using the requests module.
def search_city_coords(city, key):
    coordinates_base_url = "https://api.tomtom.com/search/2/search/"+urlparse.quote(city)+".json?minFuzzyLevel=1&maxFuzzyLevel=2&view=Unified&relatedPois=off&key="+key
    json_response = rq.get(coordinates_base_url).json()
    latitude = json_response['results'][0]['position']['lat']
    longitude = json_response['results'][0]['position']['lon']
    position = str(latitude)+","+str(longitude)
    return position
You should get a JSON response like the screenshot below when you test the APIs. Don’t worry about the formatting. You can use any JSON formatting tool at your disposal.

The application returns the result with the highest score first in the results object. The object has a position object containing latitude and longitude. We then concatenate and return the values at the end of the function.
Getting Route Information
We use a function called get_routes_info to obtain route information. The application passes in the parameters start (departure point), stop (destination point), departAt (departure time), and key (API key).
We’ll use these parameters in the endpoint URL to retrieve the results. The results will consist of all alternative routes that the drivers can use, so we’ll use iteration to access the routes object’s contents. We’ll then pass the contents to a data frame that the function will return.
def get_routes_info(start, stop, departAt, key):
    base_url = "https://api.tomtom.com/routing/1/calculateRoute/"+start+":"+stop+"/json?maxAlternatives=5&instructionsType=text&departAt="+departAt+"&key="+key
    json_response = rq.get(base_url).json()
    routes_obj = json_response['routes']
    obj_length = len(routes_obj)
    for i in range(obj_length):
        if (i == 0):
            summary_df = pd.DataFrame([routes_obj[0]['summary']])
        else:
            summary_df = summary_df.append((routes_obj[i]['summary']),ignore_index=True)
    return summary_df
Then, run the two functions in a new cell:
departure_point_coords = search_city_coords(departure_point, __API_KEY__)
delivery_point_coords = search_city_coords(delivery_point, __API_KEY__)
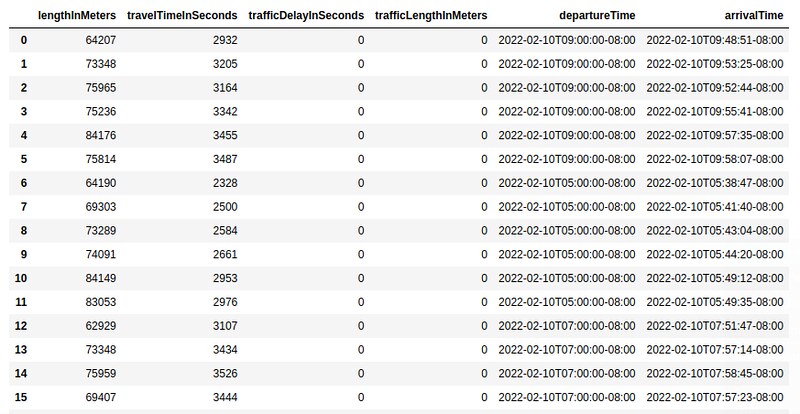
summary_df = get_routes_info(departure_point_coords, delivery_point_coords, departure_time, __API_KEY__)We can access the data frame in another cell. We choose the first six columns because they contain vital information for our tutorial.
summary_df.iloc[: , :6]The data frame should look similar to the screenshot below:

Visualizing Data
We use a Seaborn bar chart to visualize our data. Notice that the first result has the shortest travel time.
plt.figure(figsize=(6,4))
plt.title("Travel time comparison")
sns.barplot(x=summary_df.index, y=summary_df.iloc[: , :6]['travelTimeInSeconds'])
plt.ylabel("Travel time (in seconds)")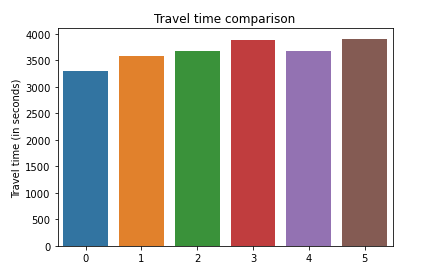
We can get the minimum travel time and index using the Pandas min() and idxmin() functions:
min_travel_time = summary_df['travelTimeInSeconds'].min()
print("Minimum travel time is: ",min_travel_time," seconds")
min_pos = summary_df['travelTimeInSeconds'].idxmin()
Adding Route Instructions
The Routing API also returns a guidance object with step-by-step instructions on which route the drivers should take. See the screenshot below:
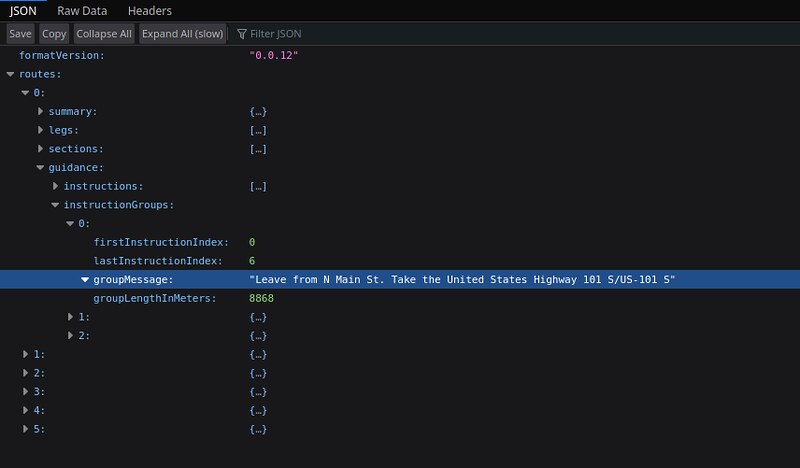
We’ll use the instructionsGroups object to access the instructions from the groupMessage item:
def get_guidance(start, stop, departAt, position, key):
    guide = ''
    base_url = "https://api.tomtom.com/routing/1/calculateRoute/"+start+":"+stop+"/json?maxAlternatives=5&instructionsType=text&departAt="+departAt+"&key="+key
    json_response = rq.get(base_url).json()
    guidance_obj = json_response['routes'][position]['guidance']['instructionGroups']
    obj_length = len(guidance_obj)
    for i in range(obj_length):
        if i==0:
            guide = guidance_obj[0]['groupMessage']
        else:
            guide = guide+". "+ guidance_obj[i]['groupMessage']
    return guide
We iterate over the instructions since there may be more than one, append them to a string, and return them.
We can then access the guidance this way:
shortest_route = get_guidance(departure_point_coords, delivery_point_coords, departure_time,min_pos, __API_KEY__)
print("HELLO THERE, FOLLOW THIS ROUTE FOR A FASTER DELIVERY: ", shortest_route,"

Thank you, and have a safe ride.")
The code will display instructions like this:

Examining Alternate Departure Times
Now, let’s pass in various departure times using a list to get a route with the shortest travel time. In each loop, we get the data frame for that time and append it to the agg_df dataframe.
time_list = ['2022-02-10T09:00:00', '2022-02-10T05:00:00', '2022-02-10T07:00:00', '2022-02-10T11:00:00', '2022-02-10T08:00:00']
agg_df = pd.DataFrame()
# Using a for loop
for time in time_list:
    summary_df2 = get_routes_info(departure_point_coords, delivery_point_coords, time, __API_KEY__)
    agg_df = agg_df.append(summary_df2,ignore_index=True)


agg_df.iloc[: , :6]
The returned data frame will look like the screenshot below:
We can then use a heatmap to visualize the data:
plt.figure(figsize=(15,8))
plt.title("Distance and time travel comparison")
sns.heatmap(data=agg_df.iloc[: , :2], fmt='d', annot=True)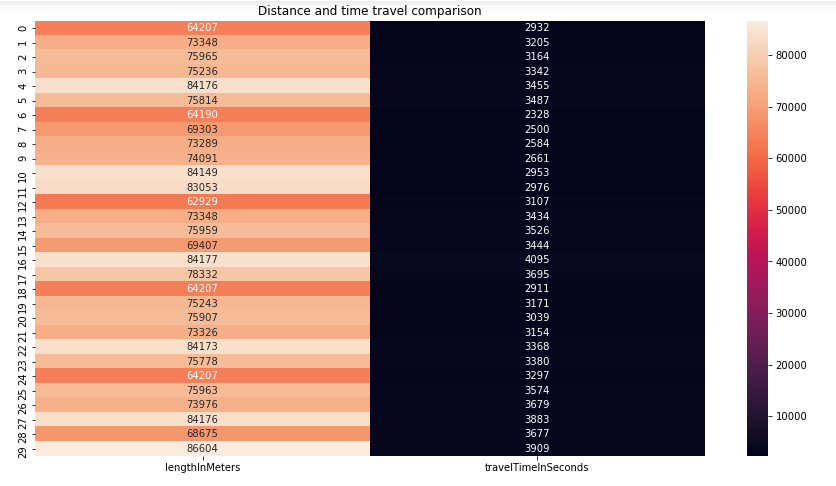
We use this code to find the minimum travel time:
min_travel_time = agg_df['travelTimeInSeconds'].min()
print("Minimum travel time is: ",min_travel_time," seconds")
Then, we use this code to retrieve the guidance:
min_pos = summary_df['travelTimeInSeconds'].idxmin()
shortest_route = get_guidance(departure_point_coords, delivery_point_coords, departure_time,min_pos, __API_KEY__)
print("HELLO THERE, FOLLOW THIS ROUTE FOR A FASTER DELIVERY: ", shortest_route,"

Thank you, and have a safe ride.")
Now that the application has found the fastest route, the bakery can switch its drivers to that route. The drivers and managers will know the general route they can usually take to be most efficient. Other real-time navigation tools can then help the drivers make finer adjustments to respond to unusual daily traffic delays.
Access this tutorial’s code in this GitHub repository.
Best Practices for Using TomTom APIs
To get the best results, you must provide accurate information, such as exact coordinates. You can pass in exact coordinates using a function instead of manually. You can also use your language’s URL escape methods and tools to avoid inaccuracies while feeding the endpoints with data.
Next Steps
We explored how to use the Routing and Search APIs, used them to retrieve data, processed and visualized the data, then finally provided route guidance to the app user. Our app can help the bakery or other businesses find the quickest route based on historical data. They may want to use this information to change the order of grocery stores they visit or split one route between multiple drivers.
You can enhance this application using other Routing API parameters. For example, you can get the route’s current traffic information (traffic), avoid certain road types (avoid), select the travel mode (car, truck, or others), avoid hilly routes that might topple the baked goods (hilliness), and more.
TomTom’s historical traffic data can also help you with other projects, such as building a prediction model. For instance, you may want to predict if a road is too hilly or is excessively winding. Use TomTom’s existing data for that supervised learning task. You simply retrieve, label, process, and predict.
Sign up to start using TomTom maps and data in your applications and data science projects.