Using Merged Styles in TomTom Maps
)
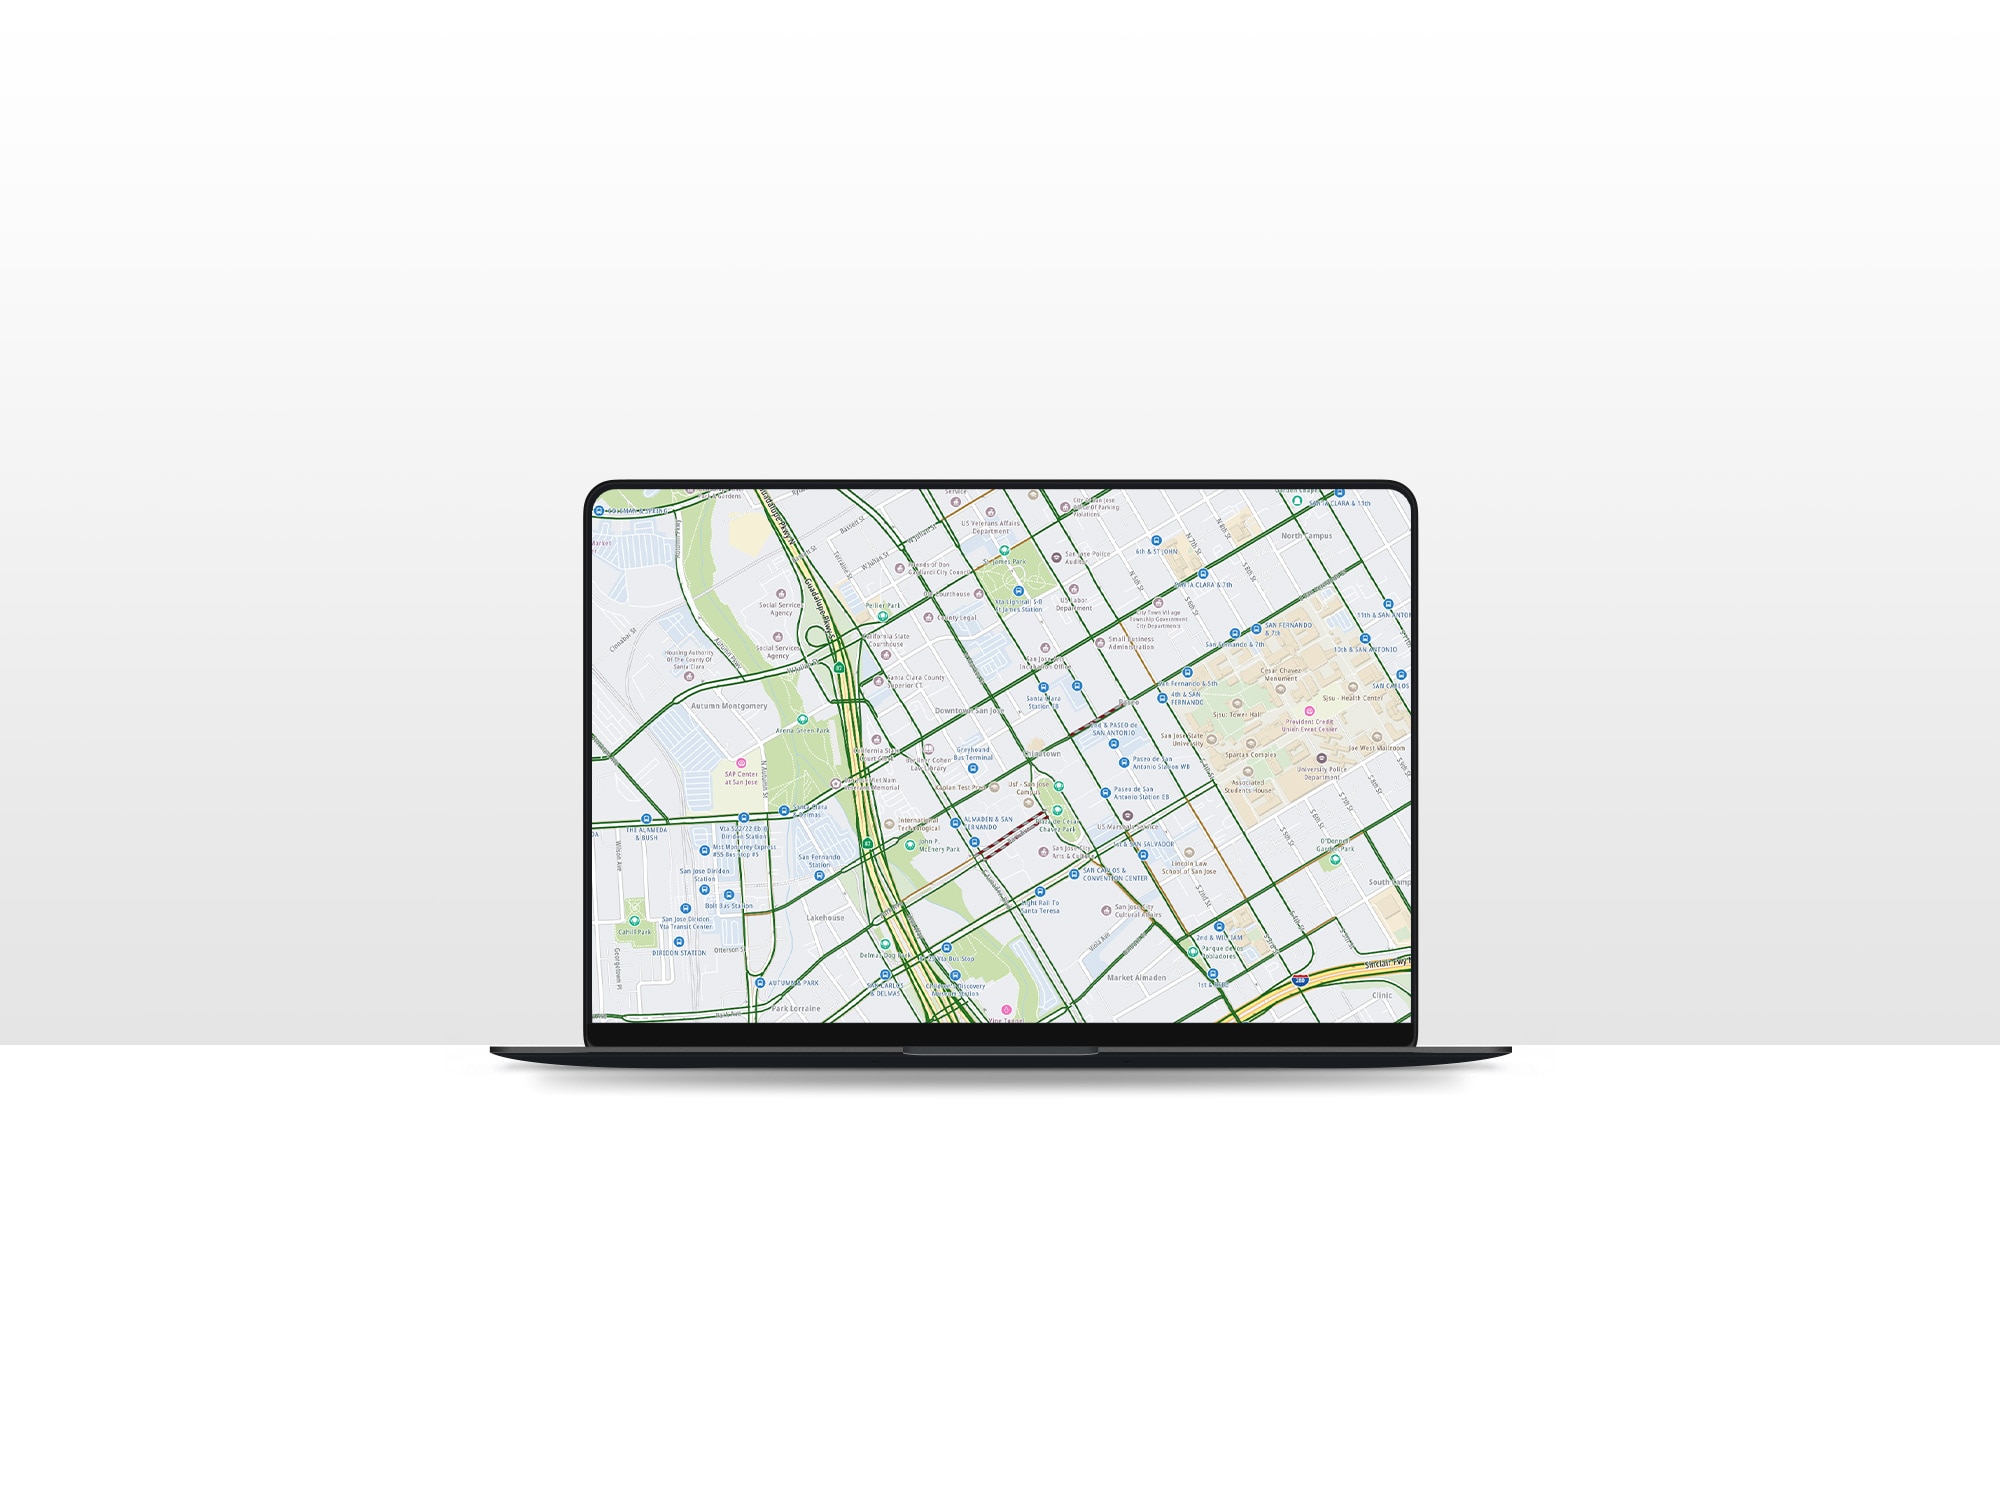
With the release of TomTom Maps SDK for Web v6, you can now edit base map styles and traffic layer styles. We'll show how quick it is to create a map with multiple layers, and how to customize the look for each layer.
TomTom’s Map Styler has long been the easiest way to style our maps. While the default look of TomTom maps is pleasing to the eye, sometimes it’s necessary to adjust the look of a map to match a website’s branding, or just to have a little bit of fun.
With the release of TomTom Maps SDK for Web V6, you can now edit base map styles and traffic layer styles. Plus, you can layer styles together when editing points of interest (POIs). Maps and Map Styler now have a Merged Styles feature, so you can edit all your styles at once and export them as a single merged style.
This blog post shows how quick it is to create a map with multiple layers, and to customize the look for each layer. To demonstrate, let’s change the ocean in the map layer to pink, then apply the same color to a building in the POI layer and traffic flow in the traffic layer.
Once we finish building a map style in the Map Styler, we export the results to a JSON file, and apply the merged style to our map, so we can easily use it in other projects.
Creating Merged Styles with Map Styler
Now that we’ve shared the highlights of the newest release of Map Styler, it’s time to dive in and see it in action.
First, a little bit of housekeeping. If you have an account and an API key, load the TomTom Map Styler. If you don’t have a TomTom developer account, register an account with TomTom. Log into the TomTom Developer Portal and get an API key for the Maps API. Make note of your API key and then use it to acess the TomTom Map Styler when prompted.
In TomTom Map Styler, on the Menu bar, click OPEN.

In the OPEN STYLE window, click Day + Incidents + Flow + POI. This style includes a map layer, the traffic flow layer, and the POI layer.

Customizing Map Style
First, begin by customizing the map style. Let’s change the color of the ocean to pink.
On the map, zoom in on a geographic region that shows some water. It’s best to work with an ocean or sea, but a lake works too. This tutorial uses the harbor area of Vancouver, Canada, but you can pick any comfortable, recognizable location. It’s easier to come up with creative map styles when looking at a familiar area.
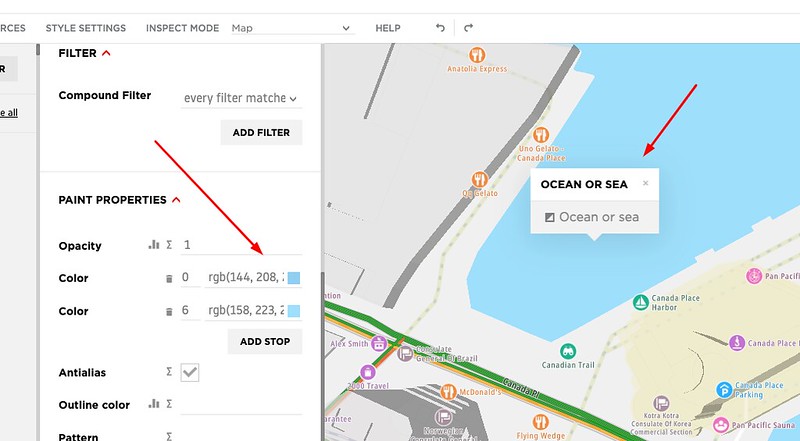
Click the blue color, which represents the body of water.
In the pop-up window, click Ocean or Sea. By default, the “PAINT PROPERTIES” in the middle panel show the ocean color for zoom levels 0 to 6. You can change the zoom level, or add more stops with different colors. Stops define what color is used for a specific zoom level, allowing you to configure color changes as the user zooms in or out.
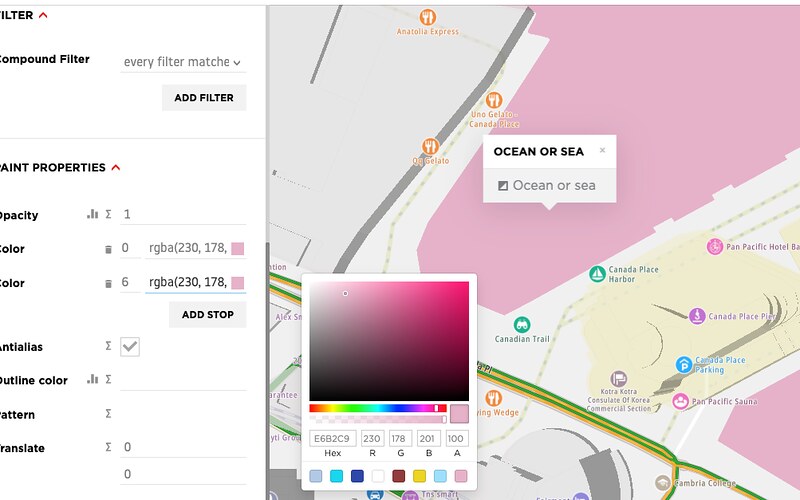
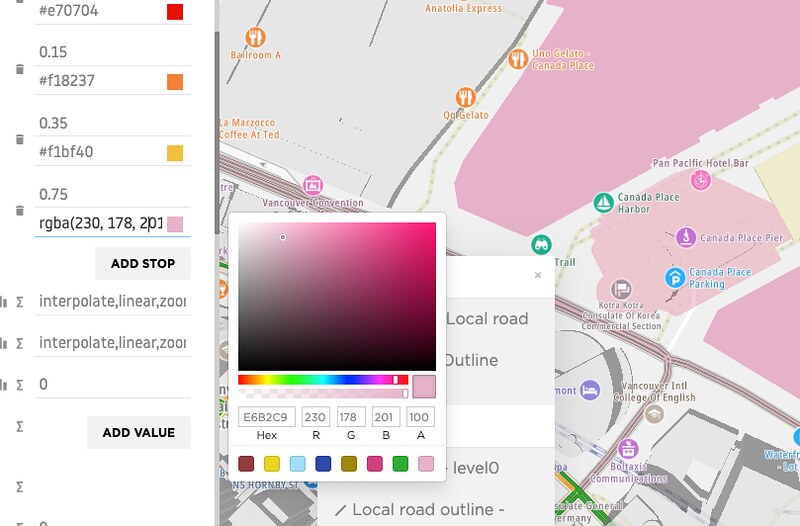
To change the color of the ocean to pink, click the color square and choose a shade of pink from the color palette.
Customizing POI Style
Next, let’s change the style of a point of interest on our map. In this section, we change the color of the Canada Place hotel building to use the same color as the ocean.
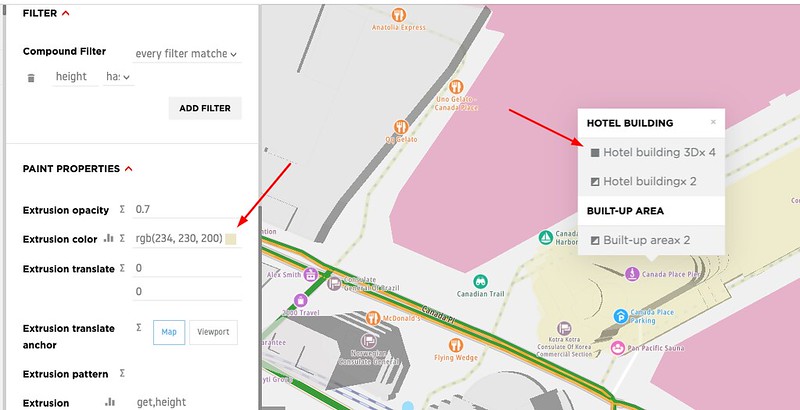
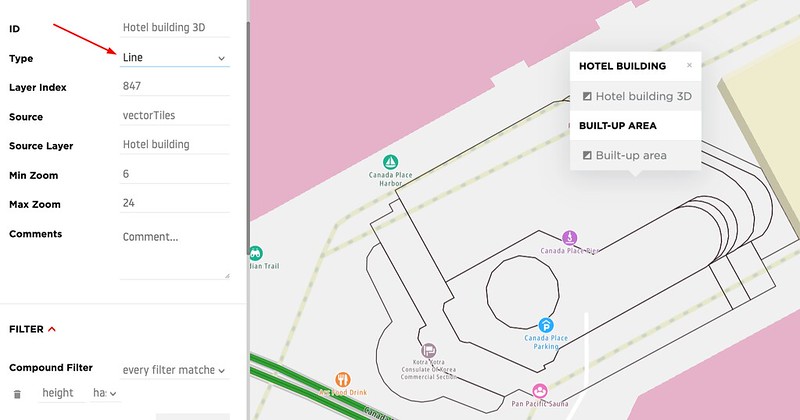
Click on the hotel building in Canada Place, which is currently a light yellow color. Then click the object representing the building. In this case, it’s “Hotel building 3Dx 4,” but this varies depending on which POI is selected.
Note that the building is filled with color. To make it look interesting, change the Type to “Line.”
Change the color of the line by copying the RGB value you used for the ocean and pasting it here. To make the line thicker, change the Width to five. Then, change the Blur to one, and set the Gap width to two. This will add some space between the outside line and the inside lines.

Map layers provide geospatial information. Think of map layers the same way you would layers in an image editing or drawer program. You can move a layer up or down, and delete, show, or hide a layer.
Let’s hide the walkway road under the hotel building. To do so, click the road and click Walkway Road in the pop-up window. Then click the three dots in the middle panel and select “Hide.” This hides the walkway from the map.

To further customize the appearance of the building, test out the other styling options. To find out what exactly each field means, hover over the field label. For example, extrusion refers to a 3D shape on a map.

Customizing Traffic Style
Now, let’s change the color of a traffic congestion level to match the ocean and the hotel.
Click the road next to Canada Place and then click Traffic flow Local road. The different colors represent the traffic congestion level.
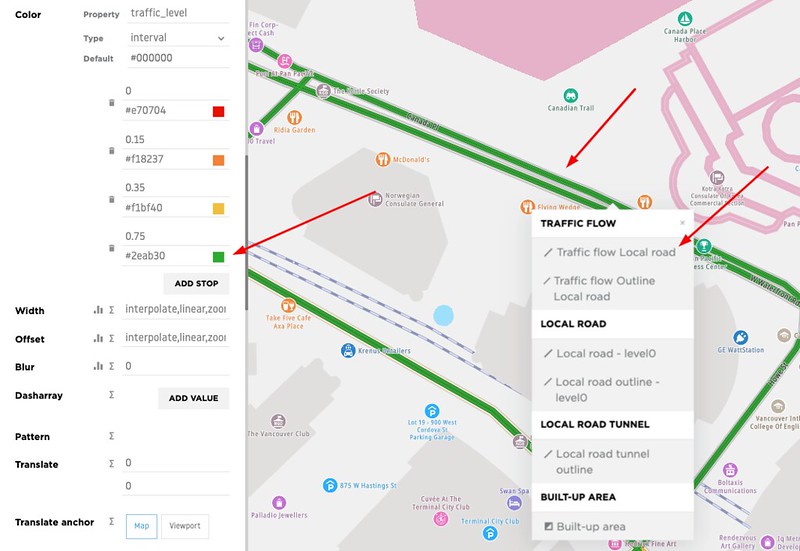
Change the color of the traffic congestion level 0.75 from green to pink by copying the color set earlier and pasting it here.
On the menu bar, click EXPORT, and name the file "mystyle.” This exports a JSON file with the customized style.
Using Merged Styles
Now that we’ve created a customized merged style using Map Styler, it’s time to use it. Apply the customized style to a map using the Maps SDK for Web.
Follow these instructions to create an HTML page with a map showing traffic flow information. Note that there’s no need to add a GeoJSON layer in the example code to use the merged style.
In the index.html file, change the center to [-123.130188, 49.210724], which is Vancouver, Canada. Use the most recent version of the Maps SDK for Web.
  <link rel='stylesheet' type='text/css' href='https://api.tomtom.com/maps-sdk-for
  web/cdn/6.x/6.14.0/maps/maps.css'/><script src="https://api.tomtom.com/maps-sdk
  for-web/cdn/6.x/6.14.0/maps/maps-web.min.js"></script>
Run an HTTP server and open a browser to see the result. A map should still be visible with traffic flow and POI with the default style.
To apply the newly created merged style, copy the downloaded file over to the project folder.
Set the style in the map.style in the index.html file, as shown below:
  var map = tt.map({
             key: '<your-api-key>',
             container: 'map',
             center: [-123.130188, 49.210724],
             zoom: 12,
             style: 'mystyle.json'
         });
Note that the style JSON object doesn’t have to be on the same server as the map file. It can be the URL for the JSON object that conforms to the schema described in the Map Style Specification.
Refresh the browser to see the map with the customized style.
Conclusion
And that’s it! That’s how easy it is to create a merged style using Map Styler V6 and apply it to a live web map.
Consistency is key in UI design. Consistency makes the application feel more intuitive, strengthens a visual brand, and gives users a sense of familiarity. TomTom’s Map Styler makes it easy to apply brand colors to a design. The map is completely customizable, so you can ensure it matches the rest of your application.
In this blog post, we created a merged style to apply the same color to different map layers simultaneously, and applied the merged style to a map. With TomTom’s Map Styler, you can also do the following:
Add, remove, or modify layers
Change the order of the layers
Change the color, opacity, visibility, patterns of all the features, the width of the lines, font size, and the color of the labels
TomTom’s Map Styler encourages map creativity and customizability. Visit Map Style Specification and Map Styler Documentation for more detailed information about TomTom’s Map Styler.