Add a layer between map layers
Overview of the tutorial
This tutorial shows how to insert a layer behind traffic flow information.
Prerequisites
To start using the latest version of the Maps SDK for Web, you need the following:
- The Maps library can be used in three ways:
- Downloaded from NPM: https://www.npmjs.com/package/@tomtom-international/web-sdk-maps.
- With a CDN: https://api.tomtom.com/maps-sdk-for-web/cdn/6.x/<version>/maps/maps-web.min.js - NOTE: Include the latest version in the URL.
- Downloaded from here: Downloads.
In this tutorial we are using a CDN as an example.
- API Key - If you don't have an API Key visit the How to get a TomTom API Key site and create one.
We recommend that you have npm and Node.js already installed on your computer to quickly spin up a HTTP server to display the page we will create.
Create a HTML file
Now let us create a basic HTML file to display a map with traffic flow information. For this example I created a file named index.html.
Next, copy the following script to your index.html file.
1<!DOCTYPE html>2<html class="use-all-space">3 <head>4 <meta http-equiv="X-UA-Compatible" content="IE=Edge" />5 <meta charset="UTF-8" />6 <title>Demo app</title>7 <meta8 name="viewport"9 content="width=device-width,initial-scale=1,maximum-scale=1,user-scalable=no"10 />11 <link12 rel="stylesheet"13 type="text/css"14 href="https://api.tomtom.com/maps-sdk-for-web/cdn/6.x/<version>/maps/maps.css"15 />16 <script src="https://api.tomtom.com/maps-sdk-for-web/cdn/6.x/<version>/maps/maps-web.min.js"></script>17 <style>18 #map {19 width: 800px;20 height: 600px;21 }22 </style>23 </head>24 <body>25 <div id="map" class="map"></div>26 <script>27 var map = tt.map({28 key: "<YOUR-API-KEY>",29 container: "map",30 center: [-0.12634, 51.50276],31 zoom: 10,32 })3334 map.on("load", function () {35 map.showTrafficFlow()36 })37 </script>38 </body>39</html>
Let's go over the important lines
First, we import all the necessary assets, in this case the JavaScript SDK and its styles.
1<!-- Include SDK's stylesheet -->2<link3 rel="stylesheet"4 type="text/css"5 href="https://api.tomtom.com/maps-sdk-for-web/cdn/6.x/<version>/maps/maps.css"6/>7<!-- Include JavaScript SDK -->8<script src="https://api.tomtom.com/maps-sdk-for-web/cdn/6.x/<version>/maps/maps-web.min.js"></script>
Then, we can create our new map.
1//...2//Initializes TomTom map with an id set to 'map' and default style, zoom and center position3var map = tt.map({4 key: "<YOUR-API-KEY>",5 container: "map",6 center: [-0.12634, 51.50276],7 zoom: 10,8})9//...
Next, we enable traffic flow information.
1//...2//We need to wait till the map is initialized3map.on("load", function () {4 //Now we enable traffic flow5 map.showTrafficFlow()6})7//...
Remember to replace the placeholder with your real data.
| YOUR-API-KEY | Your TomTom Map API Key generated earlier. |
Run a HTTP server
Navigate to the directory containing our example using a terminal.
For example:
cd sdk-example/~sdk-example$
Install a light-weight HTTP server (you might need to run this command with admin/root privileges):
npm install -g http-server
Then just simply run the following command:
http-server
Note that npm comes bundled with Node.js, so please make sure you have it installed on your machine.
So now it is time to see the results!
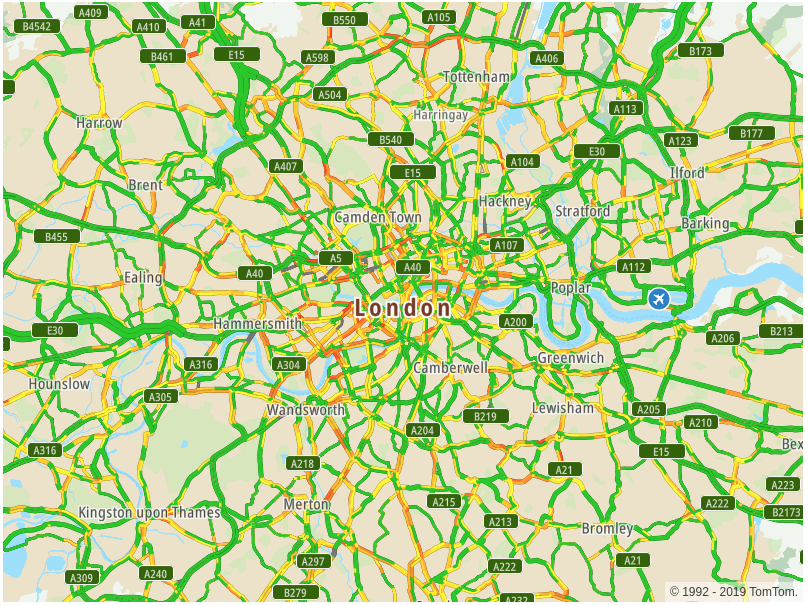
Open a browser and type this URL in the address bar: http://localhost:8080/index.html. You should be able to see a map with traffic flow!

Add a custom GeoJSON layer
This adds a custom layer to a style we use in the 'map.addLayer' method. For example:
1//...2map.on("load", function () {3 //...4 map.addLayer({5 id: "overlay",6 type: "fill",7 source: {8 type: "geojson",9 data: {10 type: "Feature",11 geometry: {12 type: "Polygon",13 coordinates: [14 [15 [-0.2046175878910219, 51.52327158962092],16 [-0.05355557617221507, 51.53523241868879],17 [-0.13045987304786877, 51.46299250930767],18 ],19 ],20 },21 },22 },23 layout: {},24 paint: {25 "fill-color": "#db356c",26 "fill-opacity": 0.5,27 "fill-outline-color": "black",28 },29 })30})31//...
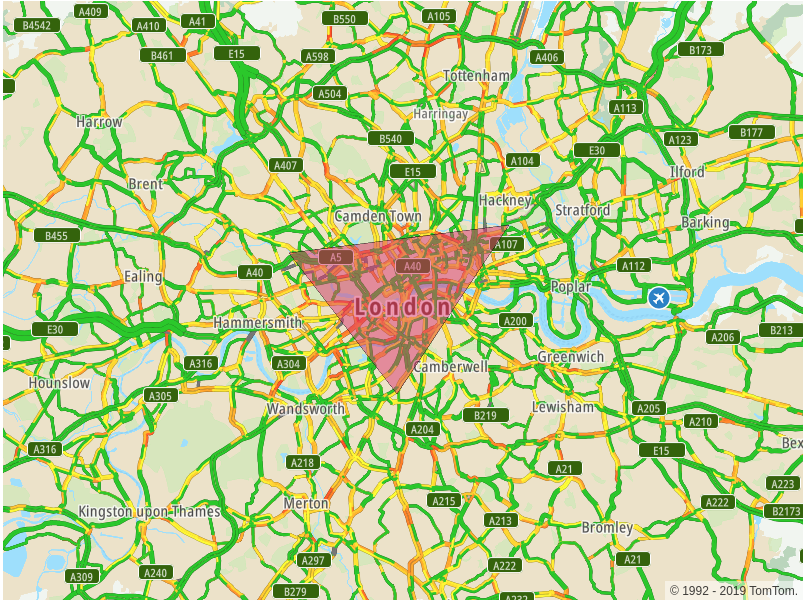
If you do it like this you will notice that a triangle is drawn on top of the map.

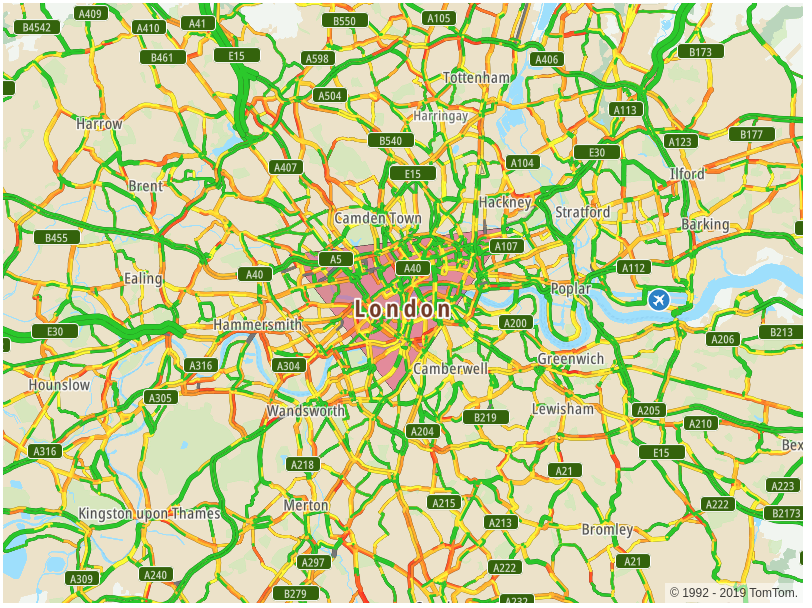
However, we only achieved a partial victory since we want to have this layer to be drawn under traffic flow information. How to do it? Thankfully, the "map.addLayer" method takes another parameter called "beforeLayerId" which should point to a layer's id under which we want to draw our custom layer. How can we find information about the layer and its id under which we want to put our custom layer? Let's start from inspecting the map's current style. You do it by invoking:
map.getStyle()
This method provides your style as a JSON object. You may notice it contains multiple layers. Those layers define what will be rendered and how it will be rendered on your map. Their order matters: Rendering starts from the first layer on the list and ends on the last one which means that layers at the beginning might be covered by those at the end. That's why it is important to find a proper position for our layer. You could do it by browsing the layers provided by the object returned from the "map.getStyle" method.
In the returned array, you need to find the first traffic flow layer and its id. This is the id we have been looking for.

Now we can render our layer on the map in the proper place.
1//...2map.on("load", function () {3 //...4 map.addLayer(5 {6 id: "overlay",7 type: "fill",8 source: {9 type: "geojson",10 data: {11 type: "Feature",12 geometry: {13 type: "Polygon",14 coordinates: [15 [16 [-0.2046175878910219, 51.52327158962092],17 [-0.05355557617221507, 51.53523241868879],18 [-0.13045987304786877, 51.46299250930767],19 ],20 ],21 },22 },23 },24 layout: {},25 paint: {26 "fill-color": "#db356c",27 "fill-opacity": 0.5,28 "fill-outline-color": "black",29 },30 },31 "Traffic flow Outline Parking road"32 )33})34//...
Here is the result:

And here is the full source code:
1<!DOCTYPE html>2<html class="use-all-space">3 <head>4 <meta http-equiv="X-UA-Compatible" content="IE=Edge" />5 <meta charset="UTF-8" />6 <title>Demo app</title>7 <meta8 name="viewport"9 content="width=device-width,initial-scale=1,maximum-scale=1,user-scalable=no"10 />11 <link12 rel="stylesheet"13 type="text/css"14 href="https://api.tomtom.com/maps-sdk-for-web/cdn/6.x/<version>/maps/maps.css"15 />16 <script src="https://api.tomtom.com/maps-sdk-for-web/cdn/6.x/<version>/maps/maps-web.min.js"></script>17 <style>18 #map {19 width: 800px;20 height: 600px;21 }22 </style>23 </head>24 <body>25 <div id="map" class="map"></div>26 <script>27 var map = tt.map({28 key: "<YOUR-API-KEY>",29 container: "map",30 center: [-0.12634, 51.50276],31 zoom: 10,32 })3334 map.on("load", function () {35 map.showTrafficFlow()36 map.addLayer(37 {38 id: "overlay",39 type: "fill",40 source: {41 type: "geojson",42 data: {43 type: "Feature",44 geometry: {45 type: "Polygon",46 coordinates: [47 [48 [-0.2046175878910219, 51.52327158962092],49 [-0.05355557617221507, 51.53523241868879],50 [-0.13045987304786877, 51.46299250930767],51 ],52 ],53 },54 },55 },56 layout: {},57 paint: {58 "fill-color": "#db356c",59 "fill-opacity": 0.5,60 "fill-outline-color": "black",61 },62 },63 "Traffic flow Outline Parking road"64 )65 })66 </script>67 </body>68</html>