Manipulating and Styling Map Layers Beyond the Basics
)
Layers in a map are totally open to manipulation. In this article, we'll take a look at the mechanics of layers and how you can use features of the TomTom Maps SDKs and Map Display API to manipulate layers, add and remove layers, toggle layer visibility, and create custom styling for layers, so you can quickly adapt TomTom maps to the needs of your application.
Layers are an integral feature of displaying details on TomTom maps. Behind the scenes, TomTom maps use layers to display map tiles, markers, routes, and traffic, and most of the time, you don't need to do anything — it's all handled for you.
But layers in a map are totally open to manipulation, and it's not difficult once you understand how they work. This article will take a look at the mechanics of layers and how you can use features of the TomTom Maps SDKs and Maps Display API to manipulate layers, add and remove layers, toggle layer visibility, and create custom styling for layers, so you can quickly adapt TomTom maps to the needs of your application.
Layer Basics
Map layers provide a convenient way to add and remove geospatial information without modifying the underlying map. If you've ever worked in an image editing or drawing program that uses layers, you're already familiar with the concept. Each layer in a drawing or map contains different visual information. Like transparencies, they can be stacked to overlay additional information on top of the basic map.
Rather than redrawing a map tile each time you want to add or remove some details, layers enable TomTom to provide flexible map display information and give you control over which part of the map are displayed and the order in which they're displayed. You can even insert your layers containing data created by your application or imported from third-party data sources and APIs.
Out of the box, TomTom maps include layers containing data such as:
Background map tiles
Labels
Roads
Buildings
Parks
Traffic density
There are many other categories. Within a given map you'll find separate layers containing specific types of map detail such as motorways, secondary roads, connecting roads, toll roads, and so on.
To learn more about the underlying details, start with the article Using Traffic Data with Maps and Routes, which explains how map tiles and layers are composited. If you want to dig down deeper into the underlying layer data available through the TomTom Maps Display API, see the documentation for the Maps Vector Tile endpoint data. You'll find an extensive list of available layers and examples of the layer data returned by the API.
Most of the time, the TomTom Maps SDK handles the details of map layers for you. Depending on the type of map you're displaying, the Maps SDK even provides data "tiers" that include bundles of preconfigured layer data. For example, when you call the TrafficFlowTilesTier or the TrafficFlowIncidentsTier, the SDK manages all of the layer display details for traffic or incidents on your behalf.
In some scenarios you might want to manipulate map layers on your own. For example, as mentioned earlier, you might insert layers displaying data from your own sources, in addition from the map data provided by TomTom. This could include a layer of custom markers showing the locations of vehicles in your fleet. Or you might show heat maps based on external data.
Once you have your map layers in place, you might also want the ability to turn them on or off interactively. The TomTom Maps SDK for Web Changing Layers Visibility functional example provides a great code example that demonstrates parsing all of the layers in a map and providing controls to toggle them on or off.
You could also allow the layers themselves to have customizable styles through styling. Map styles exist not just to enhance aesthetic features but also to improve the user experience. If the data is too granular or the lines too thin, you can configure different zoom levels. Or you can adjust colors and styles to favor people who are color-blind.
We'll show an example of using the Map Styler utility (developer API key required) later, and you can read the article Create Custom Map Styles with TomTom's Map Styler for additional details.
Adding a Traffic Layer
Let's take a look at some examples of how you can manipulate layers in TomTom maps. Note that, for simplicity, we're using a map based on the TomTom Maps SDK for Web.
As mentioned earlier, one of the simplest examples of adding optional layers to a map occurs when you add traffic flow and traffic events. Let's start with a map of Central Park in New York City.
const map = tt.map({

    key: '<<MY_TOMTOM_KEY>>',

    container: 'map',

    zoom: 12,

    center: [-73.9712, 40.7831], //Central Park, Manhattan, NY

});
Next we’ll provide a center for our map and a zoom, to make Central Park visible:

Now let's call the SDK function for adding TrafficFlowTilesTier traffic data:
map.on('load', function() {

     map.addTier(new tt.TrafficFlowTilesTier(config));

});
Here, the SDK handled all of the layer manipulation for traffic flow-related tiles and layers:
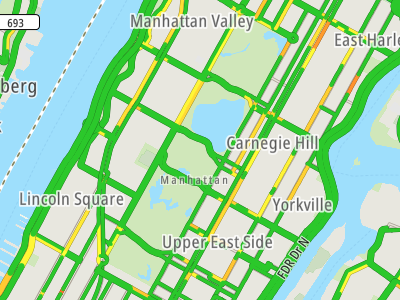
As you can see, the green color means light traffic, while yellow and orange-colored segments indicate streets and avenues with more vehicles. Notice how you didn’t have to worry about the data: the traffic flow tiles from TomTom Web SDK handled it all for you.
Insert a Layer
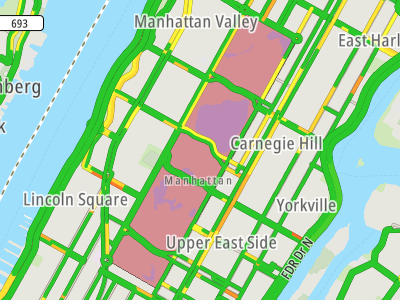
Now, let’s say you want to highlight the Central Park area within your map. You can easily do this by adding a new layer with a semi-transparent polygon on it, to avoid blocking the view of the underlying map features.
In the following code snippet, we’ll use the map.addLayer() function from the Maps SDK with a series of parameters to draw the polygon. We need to provide:
The layer ID
The type of polygon (a filled-in rectangle)
A collection of point coordinates (containing the latitude and longitude for the four outer corners of the Central Park)
The color and opacity of the rectangle fill
Here's an excerpt of the code we'd use:
map.addLayer({

    'id': 'overlay',

    'type': 'fill',

    'source': {

        'type': 'geojson',

        'data': {

            'type': 'Feature',

            'geometry': {

                'type': 'Polygon',

                'coordinates': [[

                    [-73.9582, 40.8007],

                    [-73.9491, 40.7968],

                    [-73.9730, 40.7642],

                    [-73.9819, 40.7681],

                    [-73.9582, 40.8007],

                    ]]

            }

        }

    },

    'layout': {},

    'paint': {

        'fill-color': '#db356c',

        'fill-opacity': 0.5,

        'fill-outline-color': 'black'

        }

});
Now the Central Park area highlighted:

This technique can be used to easily include new polygon layers in any map. Dive deeper on this topic in the article Using GeoJSON Geometry Data to Draw Borders with TomTom Maps.
Manipulating Layer Order
We added a new layer containing a polygon to the map, but the default behavior of addLayer() is to add the newest layer on top of all other layers. We made it a semi-transparent rectangle, but it’s still hiding streets and avenues beneath it. What if we wanted to move the polygon layer behind the traffic density layers?
Fortunately, the addLayer() method takes an additional before parameter, which lets you specify the ID of the layer under (or behind) which your new layer should be placed.
In this case we want to place the polygon layer under the first layer of the traffic flow layers, which is "Vector Traffic Outline One Side Parking road".
So instead of just adding the layer to the top of the layer stack, we can specify this layer ID as the second parameter of the addLayer() method:
map.addLayer({

    'id': 'overlay',

    'type': 'fill',

    'source': {...},

    'layout': {},

    'paint': {...}

}, 'Vector Traffic Outline One Side Parking road');
And here’s the result:
How did we know which layer to specify? See the Add a layer between map layers tutorial for one method of figuring out the layer ID specific to a group of layers returned by a TomTom API call.
If you need to get more specific, it may require further exploration of the layers included in your map. The map.getStyle().layers call returns a collection of available layer objects that you can parse through. This may take some experimentation. See the Changing Layers Visibility functional example for a code example, and the Maps Vector Tile endpoint data will give you a good idea of the likely available layer IDs.
The order in which you add layers or data tiers to your map also dictates the layer ordering, so as you develop your application, rather than trying to figure out where to insert a layer within an existing stack, you could insert a layer on top (possibly in a hidden state), then add any features that should appear on top of your layer.
Note that you can also moveLayer() and removeLayer().
Styling Maps
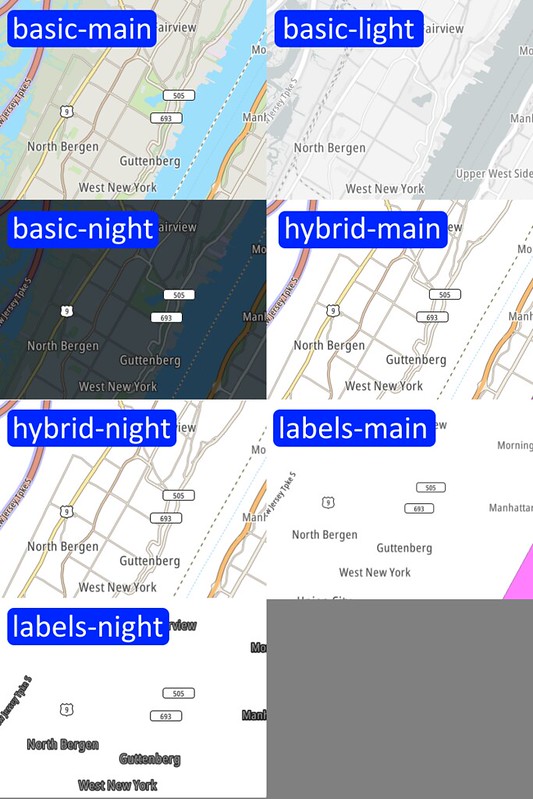
When it comes to styling maps, there are two strategies.
Through the developer portal, you can access the Map Styler tool to pre-configure the appearance of maps across multiple applications and platforms by changing the color schema, data, and other shapes to your preferences, then load these styles into your map.
You can also provide styling programmatically by using the TomTom Maps SDK. Here’s how to use JavaScript to change the default style of your map to one of the predefined styles. You can set it through the map.style option, specifying one of the available map styles:
const map = tt.map({

    key: ‘<<MY_TOMTOM_KEY>>’,

    container: 'map',

    zoom: 12,

    center: [-73.9712, 40.7831], //Central Park, Manhattan, NY

    style: 'tomtom://vector/1/basic-main',

});
You can also set the style through the map.setStyle() method.
Layer Visibility
Finally, you can easily toggle the visibility of a layer by using the map.setLayoutProperty() method, specifying the layer ID, layout property, and property value.
Here's an example of function that takes the layer ID and sets the visibility to either "visible" or "none" (not visible):
function changeLayerVisibility(layerId, visible) {

    map.setLayoutProperty(layerId, 'visibility', visible ? 'visible' : 'none');

}
You can see this code in action in the Changing Layers Visibility functional example, and it might be a handy technique for inserting invisible layers into a layer stack when it's easiest, then turning the layer "on" when you need it.
Learn more in our Video Tutorial
Watch our developer advocates, Jose and Olivia, as they play around with the TomTom Map Styler and go over how to change colors and layers, and how to create custom map themes for your apps.
Next Steps
That covers most of the layer manipulation and styling functions. As you can see, it's easy to manipulate layers and the Maps SDK for Web provides methods to add, move, remove, and change visibility of layers.
If you're using the Maps SDK for Android or Maps SDK for iOS, you still have extensive control over layer ordering and manipulation, though the syntax is different. See the respective SDK documentation and examples for details.
Follow the links below to help you work more effectively with layers when using the TomTom Maps SDK: