Traffic Tutorial
Purpose
This tutorial application shows how to use the TomTom Maps SDK for Web and its traffic capabilities like the Traffic Flow Tiles Tier, the Traffic Incident Tiers, and the Traffic Incident Details service. The main screen of the application looks like this:
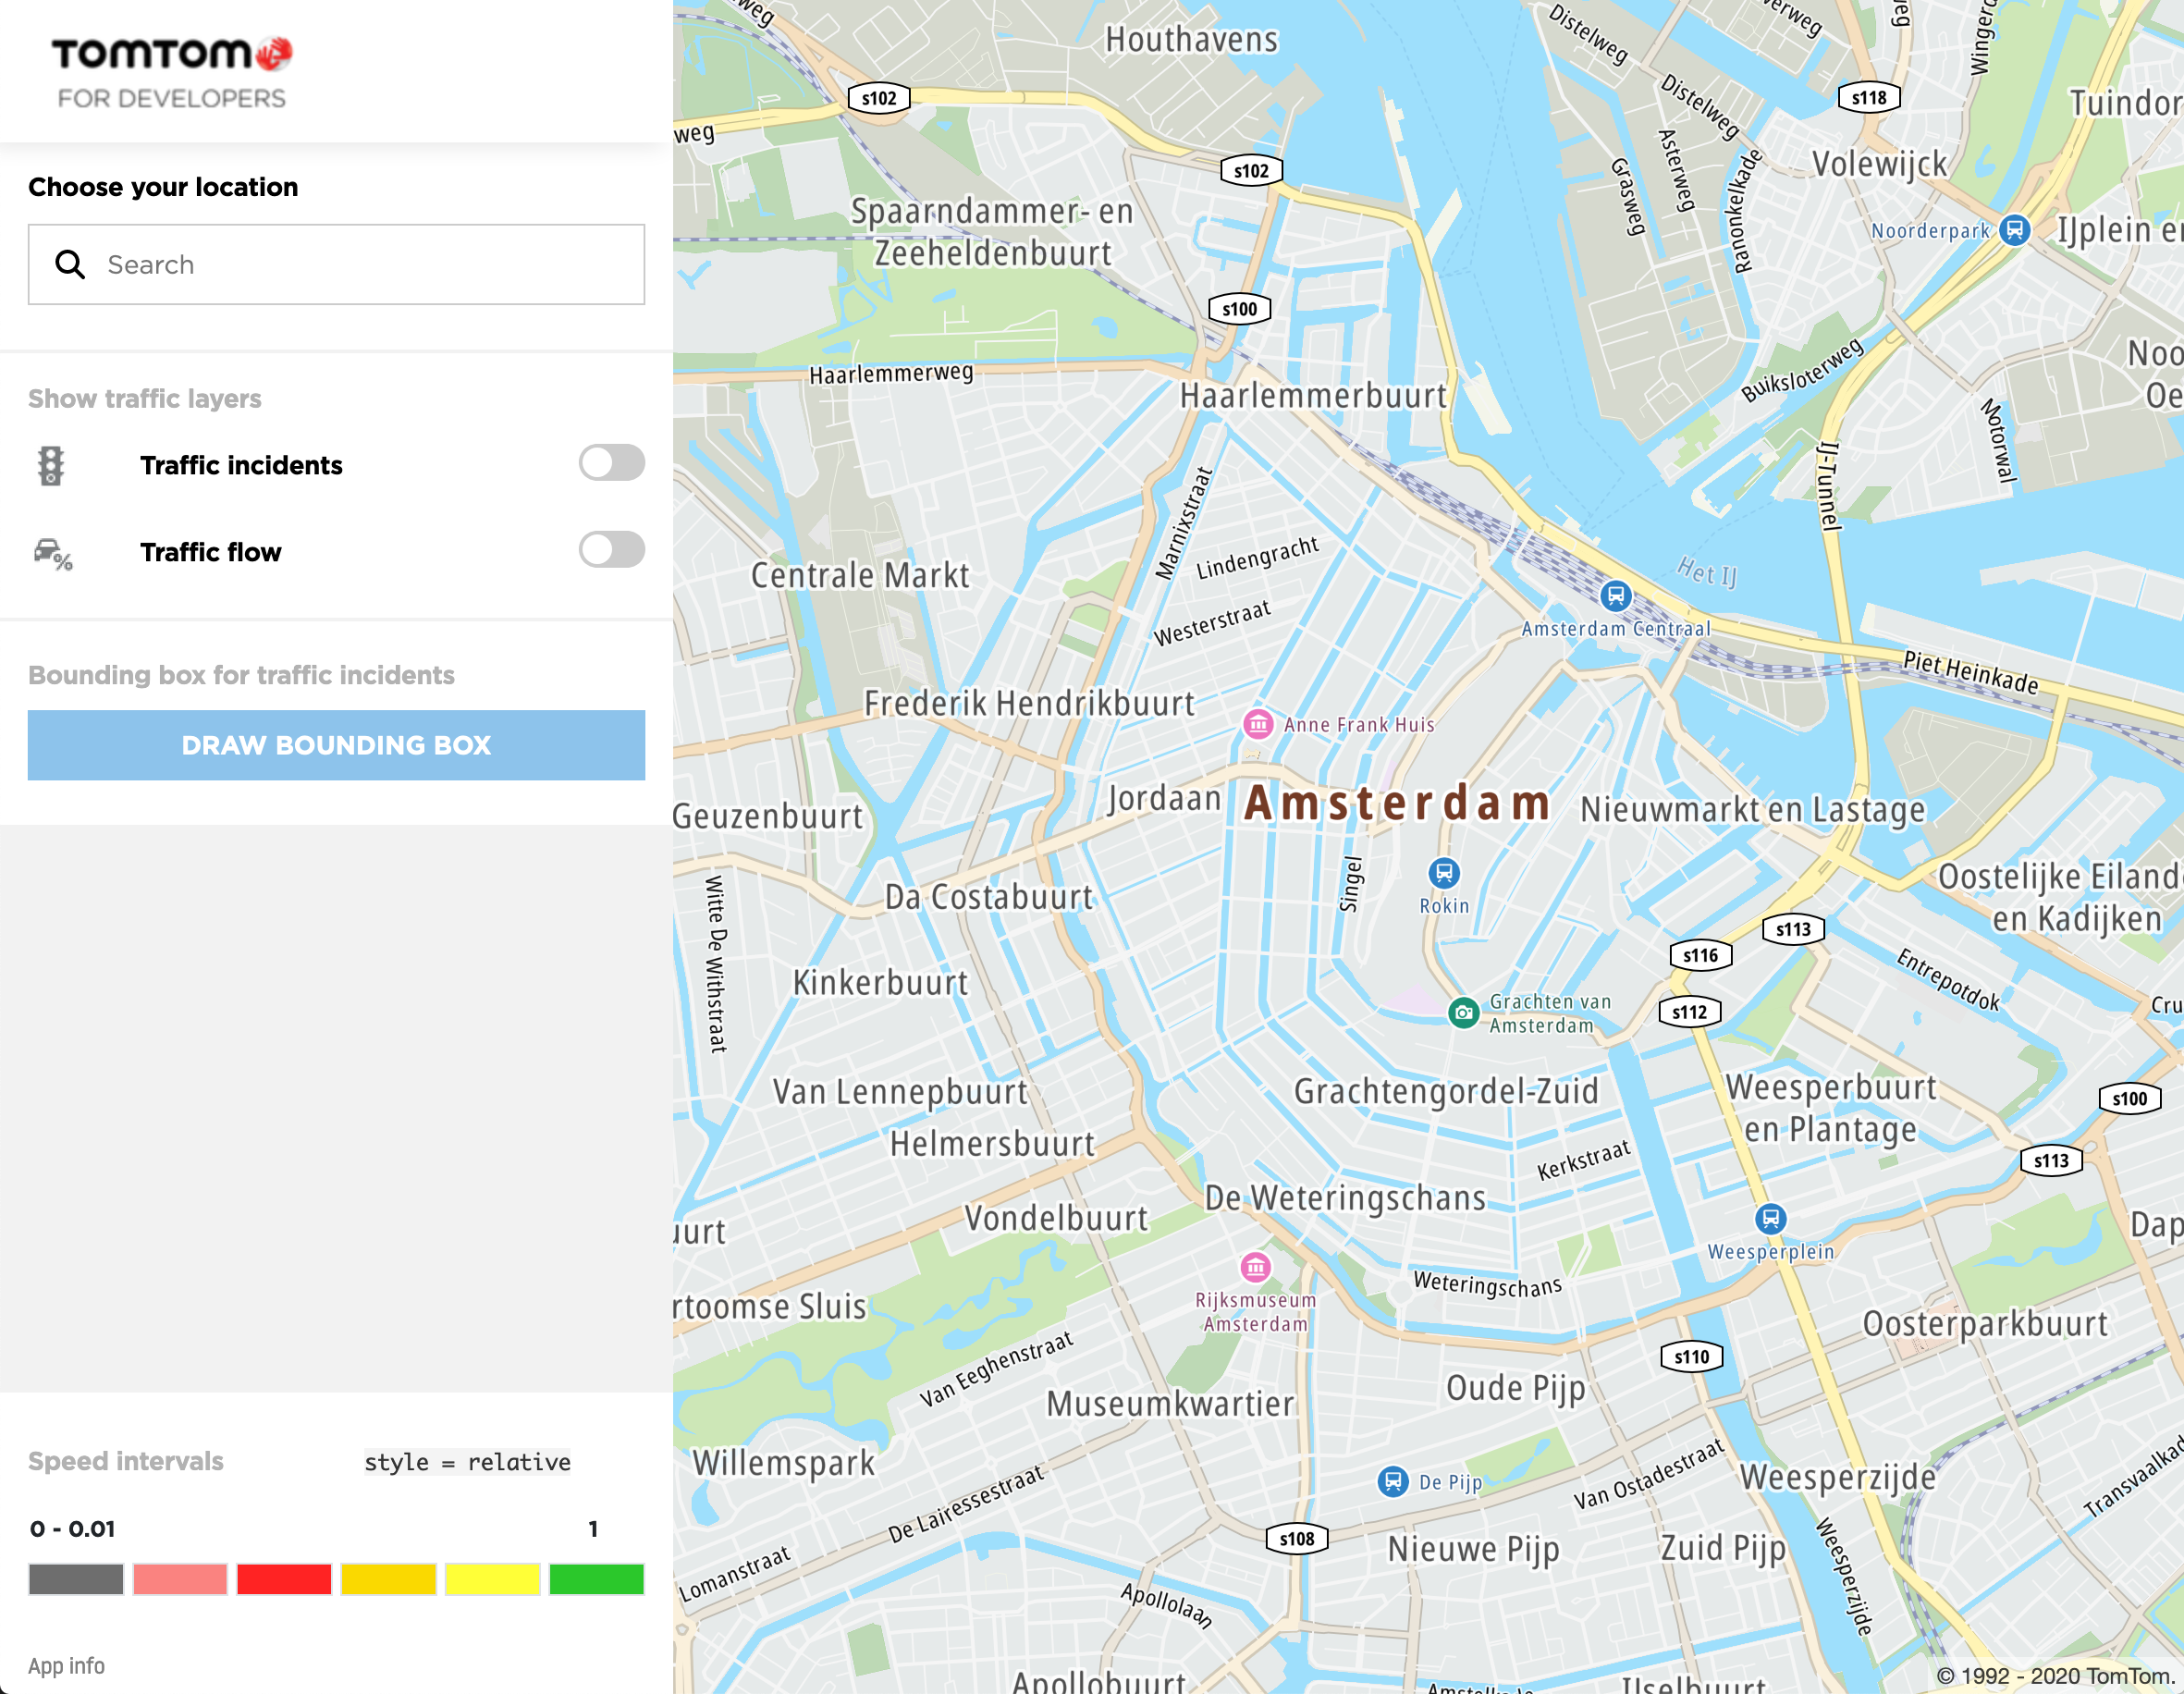
The application UI is based on the Bootstrap library. It divides the view into two main columns: the map and a sidebar. These contain options like:
- A search box field that is implemented by using a convenient SearchBox Plugin.
- Checkboxes for showing traffic incidents and flow by using the TrafficIncidentTier and TrafficFlowTilesTier
- And the most important feature that enables you to draw a bounding box and directly call the Incident Details service.
Prerequisites
- Clone a GitHub repository with the source code of the Traffic Tutorial application
- If you don't have an API key visit a How to get a TomTom API key site and create one.
- Copy and paste the API key in the “YOUR_API_KEY” placeholder in the first line in traffic.js file.
SearchBox Plugin
The SearchBox Plugin is a convenient way to implement searching functionality inside your application. In this Traffic Tutorial application, the HTML part for this section looks like this:
1<div class="row row-border">2 <div class="col pt-3 label">3 <span>Choose your location</span>4 <div id="search-panel-container" class="row">5 <div id="search-panel" class="container-fluid pb-4"></div>6 </div>7 </div>8</div>
As the tutorial UI is based on Bootstrap, the search option (like the other options) is implemented
as a combination of rows and columns. The search-panel ID will be used inside JavaScript code to
create the HTML content of the search box after initializing and configuring its instance.
1var apiKey = "YOUR_API_KEY"2var searchBoxInstance34var commonSearchBoxOptions = {5 key: apiKey,6 center: map.getCenter(),7}89function initApplication() {10 searchBoxInstance = new tt.plugins.SearchBox(tt.services, {11 minNumberOfCharacters: 0,12 labels: {13 placeholder: "Search",14 },15 noResultsMessage: "No results found.",16 searchOptions: commonSearchBoxOptions,17 autocompleteOptions: commonSearchBoxOptions,18 })1920 searchBoxInstance.on("tomtom.searchbox.resultselected", onSearchBoxResult)21 document22 .getElementById("search-panel")23 .append(searchBoxInstance.getSearchBoxHTML())24 map.on("moveend", updateSearchBoxOptions)25}2627function updateSearchBoxOptions() {28 var updatedOptions = Object.assign(commonSearchBoxOptions, {29 center: map.getCenter(),30 })31 searchBoxInstance.updateOptions({32 minNumberOfCharacters: 0,33 searchOptions: updatedOptions,34 autocompleteOptions: updatedOptions,35 })36}3738function onSearchBoxResult(result) {39 map.flyTo({40 center: result.data.result.position,41 speed: 3,42 })43}4445initApplication()
After initializing the searchBoxInstance variable with the tt.plugins.SearchBox method, the
search box inner-html can be appended to the search-panel element. Because the applications allow
the user to move the map, there is a need to react on the moveend map event and update the search
area center each time when the map stops moving. By doing that, the user can get more precise
results. When the search result is selected the onSearchBoxResult method is called, and the map
changes its position to the center point of the new result.
Traffic Flow Tiles Tier
The TrafficFlowTilesTier class is a convenient class used to show traffic flow information with a
few lines of code. The usage is simple and boils down to creating an instance of
the TrafficFlowTilesTier class with proper options described in
the documentation (
like the style or a traffic flow refresh time) and adding it to the map as shown in the following
JavaScript code:
1var styleBase = "tomtom://vector/1/"2var styleS1 = "s1"3var styleRelative = "relative"4var refreshTimeInMillis = 3000056var trafficFlowTilesTier = new tt.TrafficFlowTilesTier({7 key: apiKey,8 style: styleBase + styleRelative,9 refresh: refreshTimeInMillis,10})1112function toggleTrafficFlowTilesTier() {13 if (document.getElementById("flow-toggle").checked) {14 map.addTier(trafficFlowTilesTier)15 } else {16 map.removeTier(trafficFlowTilesTier.getId())17 }18}19document20 .getElementById("flow-toggle")21 .addEventListener("change", toggleTrafficFlowTilesTier)
Here is the HTML for this section:
1<div class="row align-items-center pt-2">2 <div class="col-sm-2">3 <img class="traffic-icon" src="img/traffic-flow.png" alt="" />4 </div>5 <div class="col pt-2">6 <label for="flow-toggle" class="traffic-text">Traffic flow</label>7 </div>8 <div class="col-sm-3 pt-2 text-right">9 <label class="switch">10 <input id="flow-toggle" type="checkbox" />11 <span class="toggle round"></span>12 </label>13 </div>14</div>
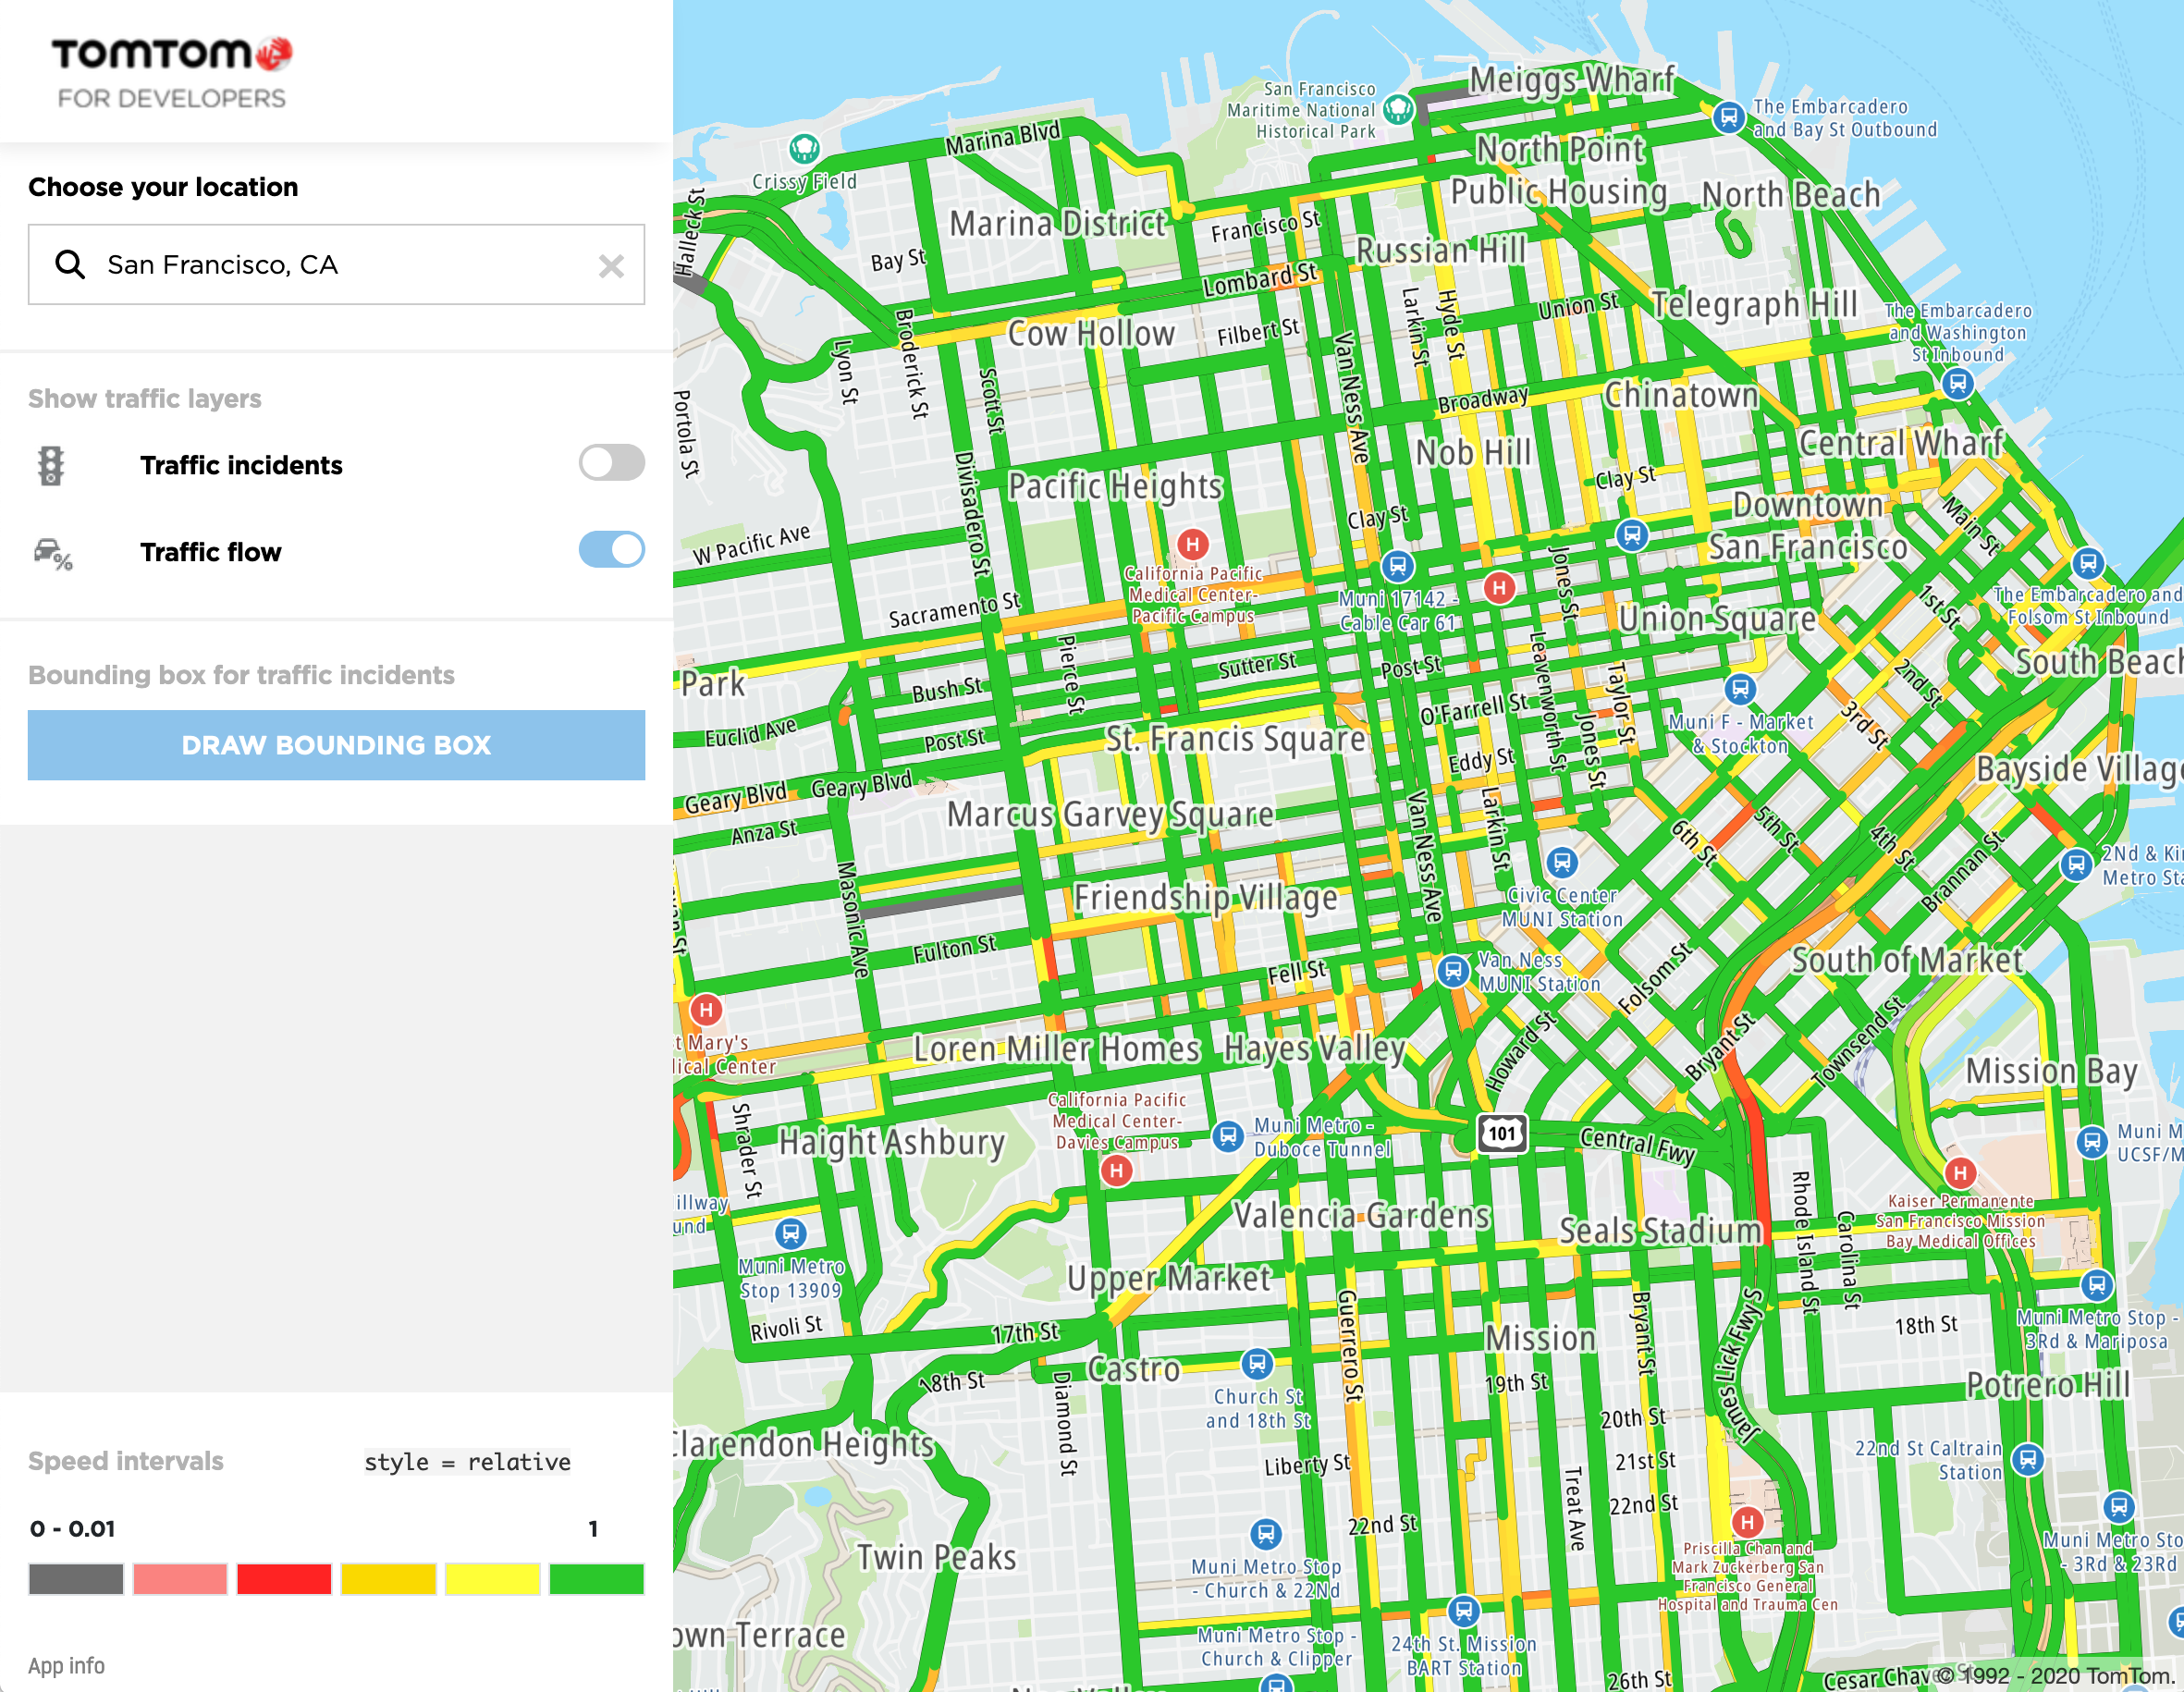
When the user selects the ‘flow-toggle’ checkbox, traffic flow tiles should be visible on the map as shown on the following screen:
Traffic Incident Tier
The TrafficIncidentTier class is a convenient class used to display real time traffic incidents on
the map without forcing the developer to directly access the IncidentDetails service. The usage of
this class is very similar to the TrafficFlowTilesTier class. The developer needs to create a new
instance of the TrafficIncidentTier class with proper options (like a style or traffic refresh
time) as described in
the documentation. The traffic incidents will become visible by adding it to the map as shown in the following
JavaScript code example:
1var trafficIncidentCheckbox = document.getElementById("incidents-toggle")2var styleBase = "tomtom://vector/1/"3var styleS1 = "s1"4var styleRelative = "relative"5var refreshTimeInMillis = 3000067var trafficIncidentsTier = new tt.TrafficIncidentTier({8 key: apiKey,9 incidentDetails: {10 style: styleS1,11 },12 incidentTiles: {13 style: styleBase + styleS1,14 },15 refresh: refreshTimeInMillis,16})1718function showTrafficIncidentsTier() {19 trafficIncidentCheckbox.checked = true20 map.addTier(trafficIncidentsTier)21}2223function hideTrafficIncidentsTier() {24 trafficIncidentCheckbox.checked = false25 map.removeTier(trafficIncidentsTier.getId())26 clearIncidentList()27 removeBoundingBox()28}2930function toggleTrafficIncidentsTier() {31 if (trafficIncidentCheckbox.checked) {32 showTrafficIncidentsTier()33 } else {34 hideTrafficIncidentsTier()35 }36}3738trafficIncidentCheckbox.addEventListener("change", toggleTrafficIncidentsTier)
Here is the HTML for this section:
1<div class="row align-items-center pt-2">2 <div class="col-sm-2">3 <img class="traffic-icon" src="img/traffic_lights.png" alt="" />4 </div>5 <div class="col pt-2">6 <label for="incidents-toggle" class="traffic-text">Traffic incidents</label>7 </div>8 <div class="col-sm-3 pt-2 text-right">9 <label class="switch">10 <input id="incidents-toggle" type="checkbox" />11 <span class="toggle round"></span>12 </label>13 </div>14</div>
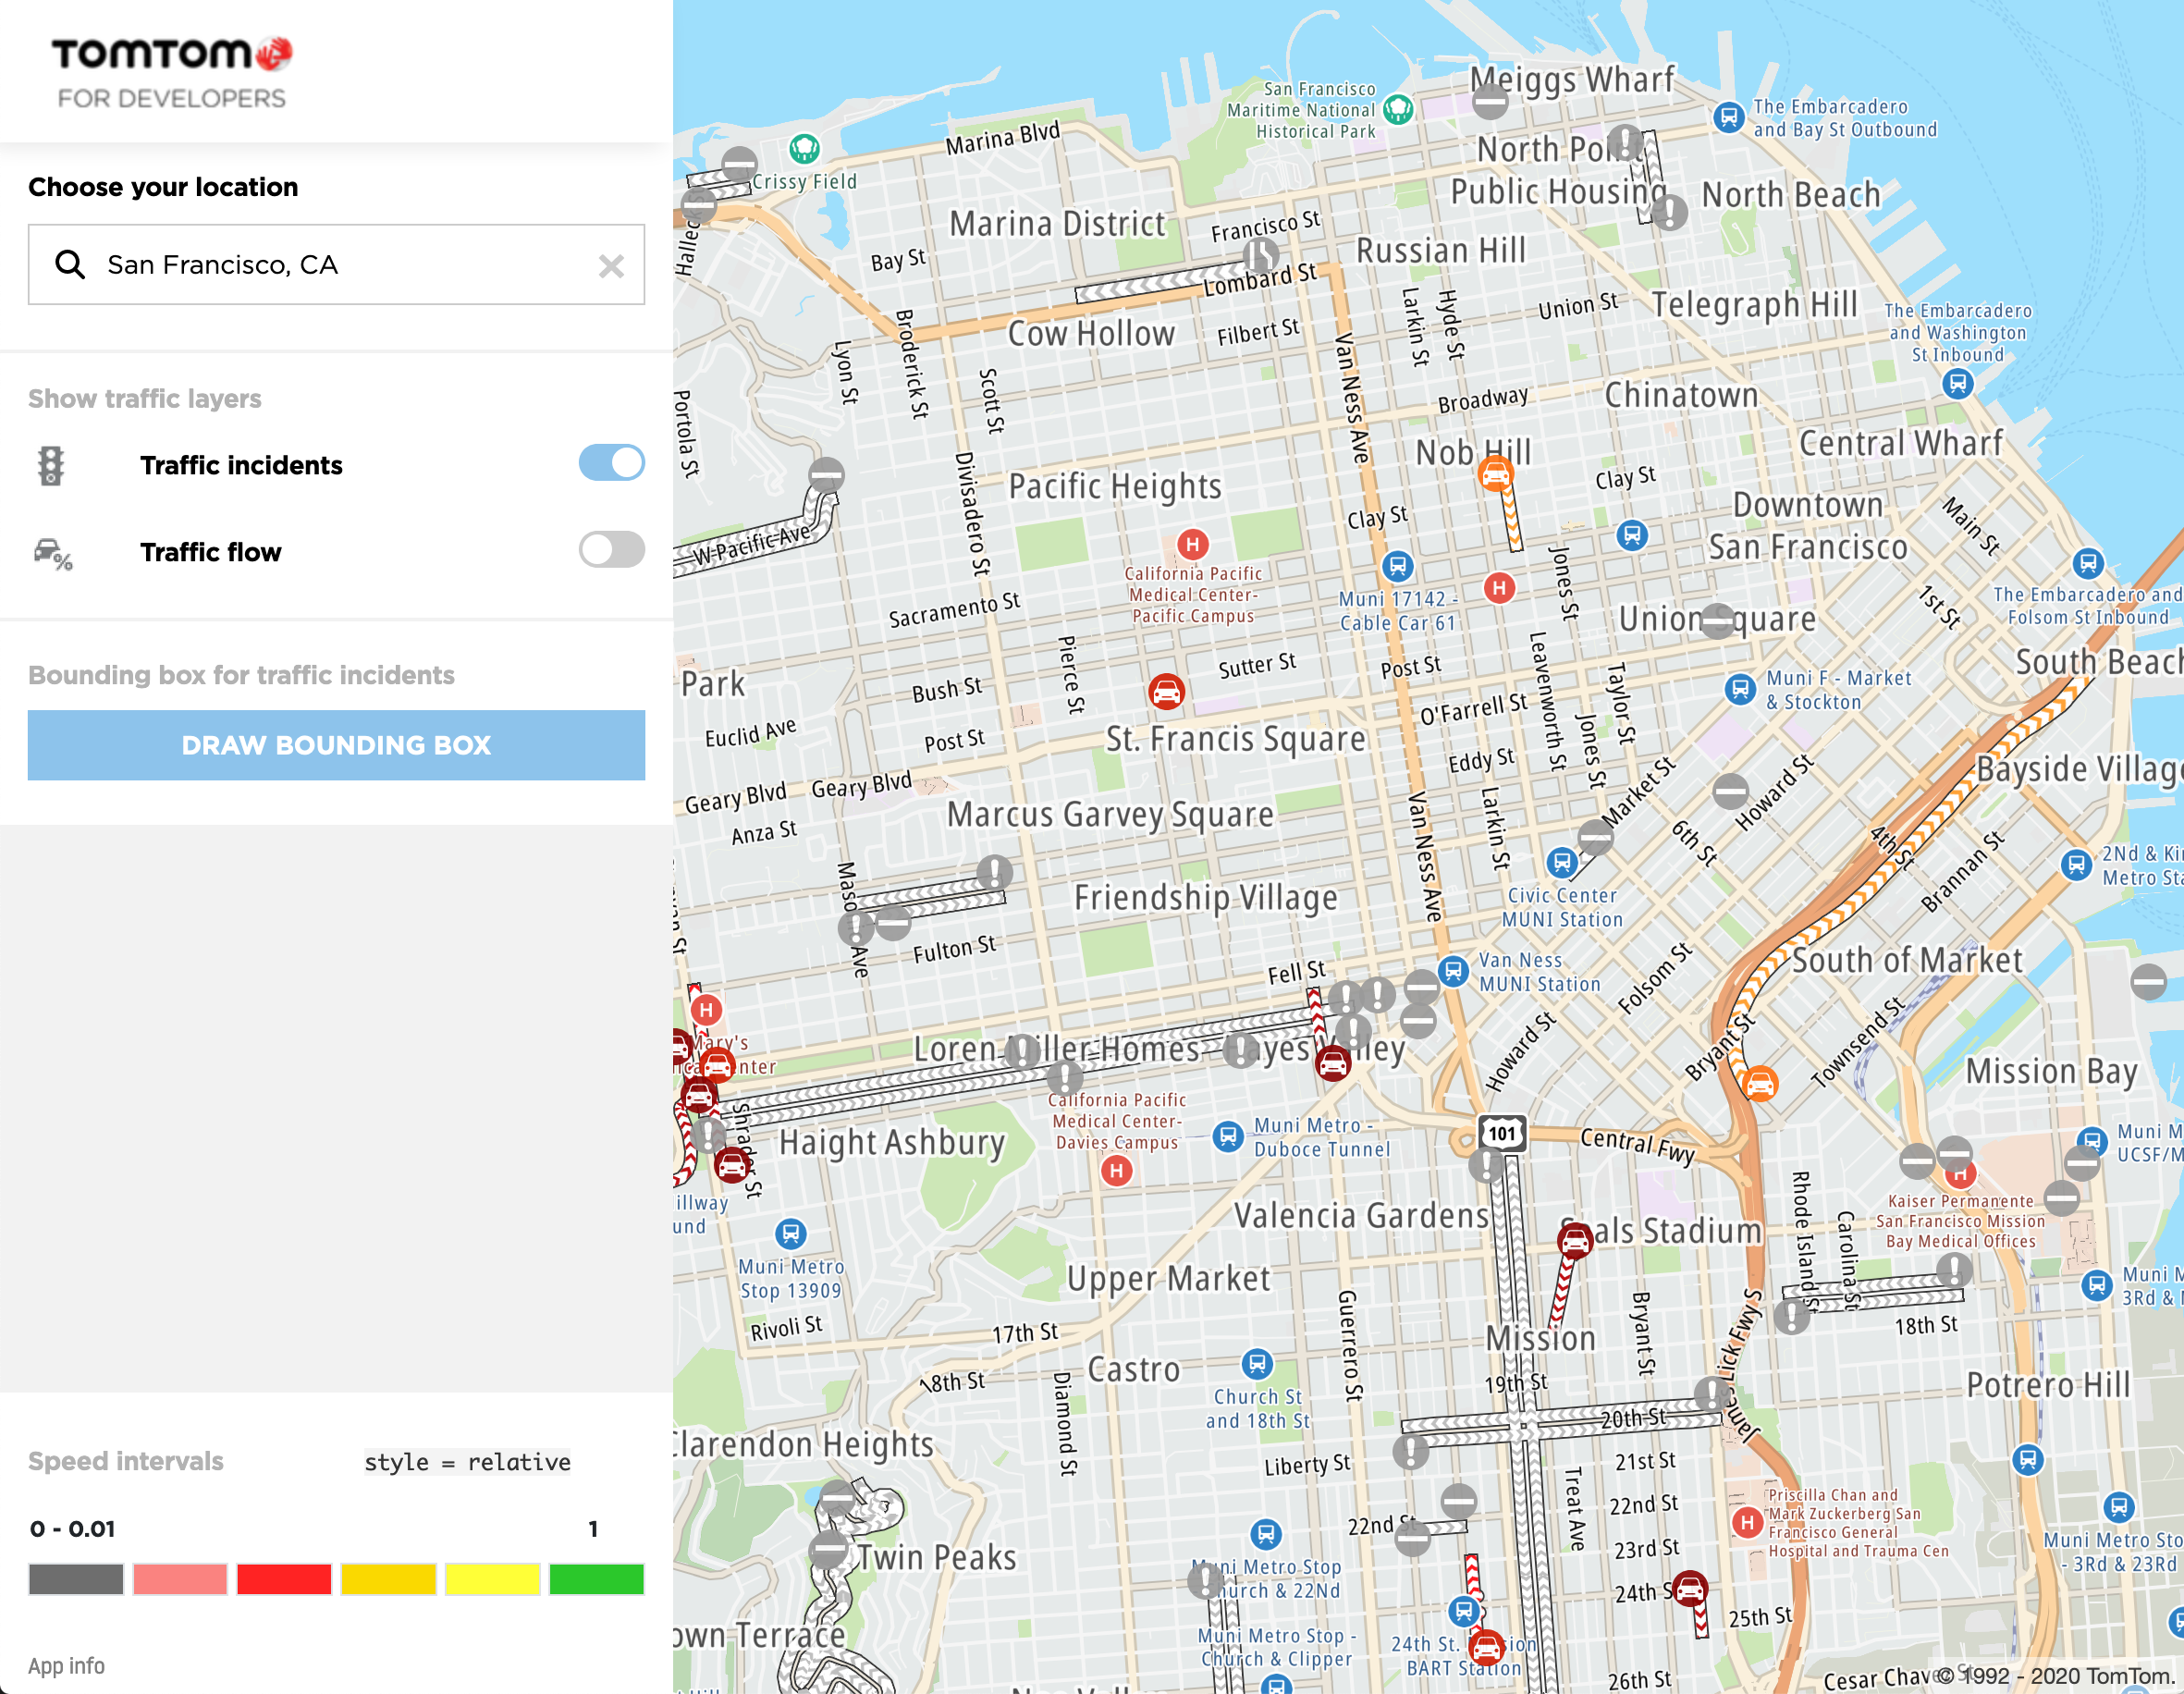
When the user will select the ‘incidents-toggle’ checkbox, traffic incidents should be visible on the map as shown on the following screen:
This tutorial only shows the basic usage of the TrafficIncidentTier class. If you are interested
in the more advanced features of this class, see one of
the functional examples.
Incident Details Service
The tt.services.incidentDetails service provides current traffic incidents in a given region (
bounding box), on a given zoom with a given style by using
the Traffic Incidents Details API.
In this section we’ll learn how to display a traffic incidents by using the Incident Details service and the bounding box parameter. Let’s take a look at the HTML part of the Bounding Box button:
1<div class="py-3 row row-border">2 <div class="col">3 <span class="show-traffic-layers">Bounding box for traffic incidents</span>4 <button5 id="bounding-box-button"6 type="button"7 class="btn btn-primary btn-block my-2"8 >9 DRAW BOUNDING BOX10 </button>11 </div>12</div>13<div id="incident-list-wrapper" class="row pt-0">14 <div class="col">15 <div id="incident-list-container" class="shadow p-0">16 <div id="incident-list" class="list-group"></div>17 </div>18 </div>19</div>20(…)21<div id="popup-wrapper"></div>
A few IDs from the preceding HTML example are used in the JavaScript code: incident-list
, bounding-box-button and the popup-wrapper. The incident-list ID represents a list group
which will contain traffic incidents after running the API which will be described later.
The popup-wrapper ID is only used to display messages to the user. Let’s check what happens when
the user clicks the “Draw bounding box” button:
1document2 .getElementById("bounding-box-button").addEventListener("click", enableBoundingBoxDraw)34function enableBoundingBoxDraw() {5 removeBoundingBox()6 clearIncidentList()7 drawBoundingBoxButtonPressed = true8 showInfoPopup("Click and drag to draw a bounding box")9}1011function getPopupWrapper() {12 return document.getElementById("popup-wrapper")13}1415function showPopup(element) {16 element.style.opacity = "0.9"17}1819function showInfoPopup(message) {20 var popupElementDiv = getPopupWrapper()21 popupElementDiv.innerHTML = getPopupInnerHTML("popup-info", message)22 showPopup(popupElementDiv)23}2425function showErrorPopup(message) {26 var popupElementDiv = getPopupWrapper()27 popupElementDiv.innerHTML = getPopupInnerHTML("popup-error", message)28 showPopup(popupElementDiv)29}3031function hidePopup(delayInMilis) {32 var element = getPopupWrapper()33 if (delayInMilis == 0) {34 element.style.opacity = "0"35 } else {36 setTimeout(function () {37 element.style.opacity = "0"38 }, delayInMilis)39 }40}4142function getPopupInnerHTML(popupClass, popupMessage) {43 return `<div class="container ${popupClass} popup"> <div class="row"> <div class="col py-2"> <div class="row align-items-center pt-1"> <div class="col-sm-1"> <img src="img/error-symbol.png" alt=""/> </div><div id="popup-message" class="col"> ${popupMessage} </div></div></div></div></div>`44}4546function removeBoundingBox() {47 if (map.getSource(sourceID)) {48 map.removeLayer(layerFillID)49 map.removeLayer(layerOutlineID)50 map.removeSource(sourceID)51 }52}5354function clearIncidentList() {55 incidentListContainer.innerHTML = ""56}
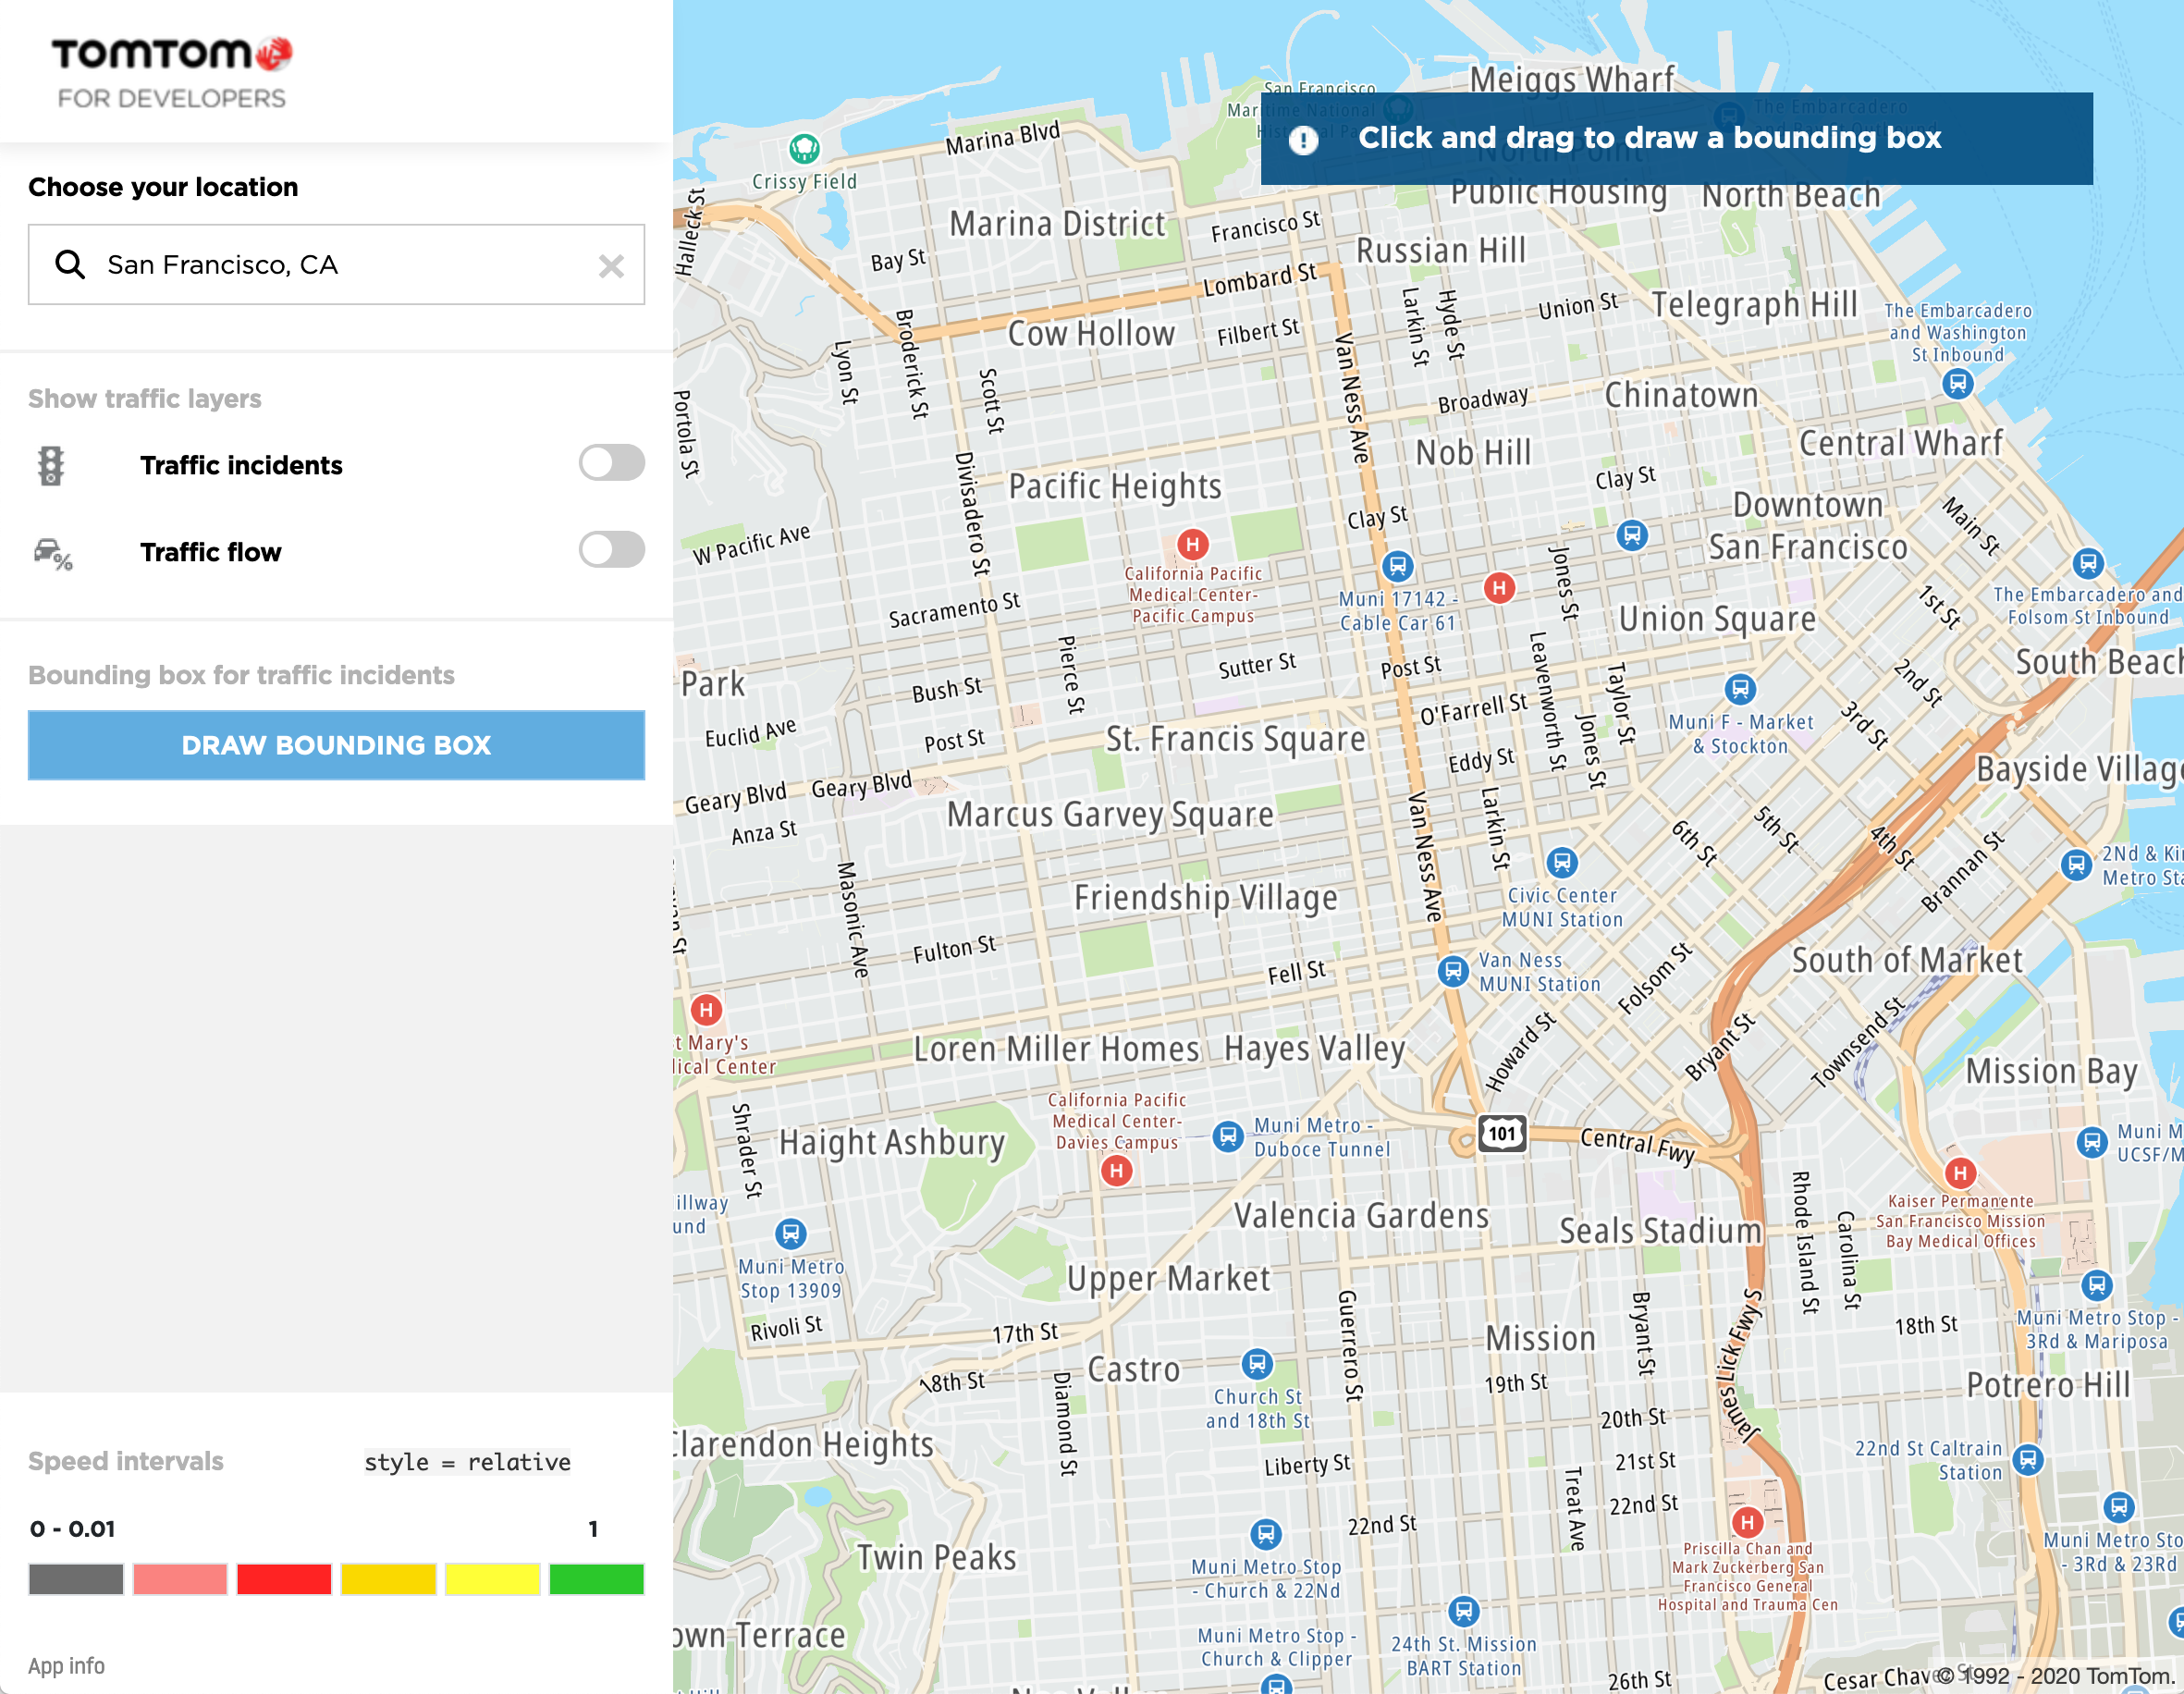
The enableBoundingBoxDraw event listener is added to the bounding box button. The event function:
- Sets the
drawBoundingBoxButtonPressedvariable. - Removes an existing GeoJSON Layer (the fill and border of the bounding box) together with its GeoJSON source.
- Clears the traffic incident.
- Shows a message to the user that they can start drawing a bounding box, just like on the following screen:
Now the user can select an area of the map and draw a rectangle that represents the bounding box parameter passed to the Incident Details service. In order to draw the rectangle, a mouse event needs to be overwritten as shown in the following code example:
1var startCornerLngLat2var endCornerLngLat3var mousePressed4var drawBoundingBoxButtonPressed5var layerFillID = "layerFillID"6var layerOutlineID = "layerOutlineID"7var sourceID = "sourceID"8var popupHideDelayInMilis = 4000910map.on("mousedown", onMouseDown)11map.on("mousemove", onMouseMove)12map.on("mouseup", onMouseUp)1314function onMouseDown(eventDetails) {15 if (drawBoundingBoxButtonPressed) {16 eventDetails.preventDefault()17 mousePressed = true18 startCornerLngLat = eventDetails.lngLat19 removeBoundingBox()20 map.addSource(21 sourceID,22 getPolygonSource(startCornerLngLat, startCornerLngLat)23 )24 map.addLayer({25 id: layerFillID,26 type: "fill",27 source: sourceID,28 layout: {},29 paint: {30 "fill-color": "#666",31 "fill-opacity": 0.1,32 },33 })34 map.addLayer({35 id: layerOutlineID,36 type: "line",37 source: sourceID,38 layout: {},39 paint: {40 "line-width": 4,41 "line-color": "#424242",42 "line-dasharray": [2, 1],43 "line-blur": 0.5,44 },45 })46 }47}4849function onMouseMove(eventDetails) {50 if (mousePressed) {51 endCornerLngLat = eventDetails.lngLat52 updateRectangleData(startCornerLngLat, endCornerLngLat)53 }54}5556function onMouseUp(eventDetails) {57 mousePressed = false58 hidePopup(0)59 if (drawBoundingBoxButtonPressed) {60 endCornerLngLat = eventDetails.lngLat61 if (bothLngLatAreDifferent(startCornerLngLat, endCornerLngLat)) {62 updateRectangleData(startCornerLngLat, endCornerLngLat)63 clearIncidentList()64 displayTrafficIncidents(65 getLngLatBoundsForIncidentDetailsCall(66 startCornerLngLat,67 endCornerLngLat68 )69 )70 showTrafficIncidentsTier()71 } else {72 showErrorPopup("Try to select bigger bounding box.")73 hidePopup(popupHideDelayInMilis)74 }75 }76 drawBoundingBoxButtonPressed = false77}78function getPolygonSourceData(startCornerLngLat, endCornerLngLat) {79 return {80 type: "Feature",81 geometry: {82 type: "Polygon",83 coordinates: [84 [85 [startCornerLngLat.lng, startCornerLngLat.lat],86 [startCornerLngLat.lng, endCornerLngLat.lat],87 [endCornerLngLat.lng, endCornerLngLat.lat],88 [endCornerLngLat.lng, startCornerLngLat.lat],89 [startCornerLngLat.lng, startCornerLngLat.lat],90 ],91 ],92 },93 }94}9596function getPolygonSource(startCornerLngLat, endCornerLngLat) {97 return {98 type: "geojson",99 data: getPolygonSourceData(startCornerLngLat, endCornerLngLat),100 }101}102103function updateRectangleData(startCornerLngLat, endCornerLngLat) {104 map105 .getSource(sourceID)106 .setData(getPolygonSourceData(startCornerLngLat, endCornerLngLat))107}108109function bothLngLatAreDifferent(lngLat1, lngLat2) {110 return lngLat1.lat !== lngLat2.lat && lngLat1.lng !== lngLat2.lng111}112113function getLngLatBoundsForIncidentDetailsCall(114 startCornerLngLat,115 endCornerLngLat116) {117 var bottomLeftCorner = new tt.LngLat(118 startCornerLngLat.lng < endCornerLngLat.lng119 ? startCornerLngLat.lng120 : endCornerLngLat.lng,121 startCornerLngLat.lat < endCornerLngLat.lat122 ? startCornerLngLat.lat123 : endCornerLngLat.lat124 )125 var topRightCorner = new tt.LngLat(126 startCornerLngLat.lng > endCornerLngLat.lng127 ? startCornerLngLat.lng128 : endCornerLngLat.lng,129 startCornerLngLat.lat > endCornerLngLat.lat130 ? startCornerLngLat.lat131 : endCornerLngLat.lat132 )133 return tt.LngLatBounds.convert([134 bottomLeftCorner.toArray(),135 topRightCorner.toArray(),136 ])137}
Inside the onMouseDown event (only when “Draw bounding box” button has been pressed) the GeoJSON
source and layers are added to the map.
The developer assigns the first mouse press position to the startCornerLngLat variable.
The mousePressed variable is set to true so that during the onMouseMove event the developer can
check whether the user is still holding the mouse button. If yes, it updates the bounding box
rectangle data using the new coordinate taken from eventDetails.lngLat variable.
When the user releases the mouse button, all necessary data (like the bounding box size) is gathered. One last thing needs to be done. The Incident Details API endpoint describes the bounding box requirements here.
One of the requirements
is: “The first coordinate pair is for the lower-left corner and the second pair for the upper-right corner.”. Therefore, the developer needs to adjust the bounding box so that it meets that requirement by
calling the getLngLatBoundsForIncidentDetailsCall function.
Now the developer can perform the tt.services.incidentDetails call by calling
the displayTrafficIncidents function. See the following code example:
1var incidentListContainer = document.getElementById("incident-list")23function displayTrafficIncidents(boundingBox) {4 var iconsMapping = [5 "danger",6 "accident",7 "fog",8 "danger",9 "rain",10 "ice",11 "incident",12 "laneclosed",13 "roadclosed",14 "roadworks",15 "wind",16 "flooding",17 "detour",18 "",19 ]20 var delayMagnitudeMapping = [21 "unknown",22 "minor",23 "moderate",24 "major",25 "undefined",26 ]2728 tt.services29 .incidentDetails({30 key: apiKey,31 boundingBox: boundingBox,32 style: styleS1,33 zoomLevel: parseInt(map.getZoom()),34 }).go().then(function (results) {35 if (results.tm.poi.length === 0) {36 showErrorPopup("There are no traffic incidents in this area.")37 hidePopup(popupHideDelayInMilis)38 } else {39 results.tm.poi.forEach(function (incident) {40 var buttonListItem = createButtonItem(incident.p)4142 if (isCluster(incident)) {43 buttonListItem.innerHTML = getButtonClusterContent(44 incident.id,45 incident.cs,46 delayMagnitudeMapping[incident.ty]47 )48 incidentListContainer.appendChild(buttonListItem)49 } else {50 buttonListItem.innerHTML = getButtonIncidentContent(51 incident.d.toUpperCase(),52 iconsMapping[incident.ic],53 delayMagnitudeMapping[incident.ty],54 incident.f,55 incident.t56 )57 incidentListContainer.appendChild(buttonListItem)58 }59 })60 }61 })62}6364function createButtonItem(incidentPosition) {65 var incidentBtn = document.createElement("button")66 incidentBtn.setAttribute("type", "button")67 incidentBtn.classList.add(68 "list-group-item",69 "list-group-item-action",70 "incidendDetailsListItemButton"71 )72 incidentBtn.addEventListener(73 "click",74 function () {75 map.flyTo({76 center: incidentPosition,77 })78 },79 false80 )8182 return incidentBtn83}8485function getButtonIncidentContent(86 description,87 iconCategory,88 delayMagnitude,89 fromAddress,90 toAddress91) {92 return `<div class="row align-items-center pb-2"> <div class="col-sm-2"> <div class="tt-traffic-icon"> <div class="tt-icon-circle-${delayMagnitude} traffic-icon"> <div class="tt-icon-${iconCategory}"></div></div></div></div><div class="col label pl-0"> ${description} </div></div><div class="row"> <div class="col-sm-2"><label class="label">From: </label></div><div class="col"><label class="incident-details-list-normal-text">${fromAddress}</label> </div></div><div class="row"> <div class="col-sm-2"><label class="label">To: </label></div><div class="col"><label class="incident-details-list-normal-text">${toAddress}</label></div></div>`93}9495function getButtonClusterContent(96 description,97 numberOfIncidents,98 delayMagnitude99) {100 return `<div class="row align-items-center pb-2"> <div class="col-sm-2"> <div class="tt-traffic-icon"> <div class="tt-icon-circle-${delayMagnitude} traffic-icon"> <div id="cluster-icon" class="tt-icon-number">${numberOfIncidents}</div></div></div></div><div class="col label pl-0"> ${description} </div></div>`101}102103function isCluster(incident) {104 return incident.id.includes("CLUSTER")105}
As the traffic-incidents.css is used
inside the tutorial, it’s very convenient to introduce icon mapping variables: iconsMapping
and delayMagnitudeMapping so that using the traffic icons will be much easier.
By having the bounding box parameter in place, the developer can perform a call to
the tt.services.incidentDetails service.
- When there are no traffic incidents inside the given bounding box, the error popup message is displayed.
- When there are traffic incidents, depending on the map zoom, the incident may be a cluster containing multiple incidents or a single incident.
Cluster items are created by calling the getButtonClusterContent method and single incident
items are created by calling the getButtonIncidentContent method.
Incidents items are created for each particular result and are added to
the incidentListContainer div element. See the following application screen:
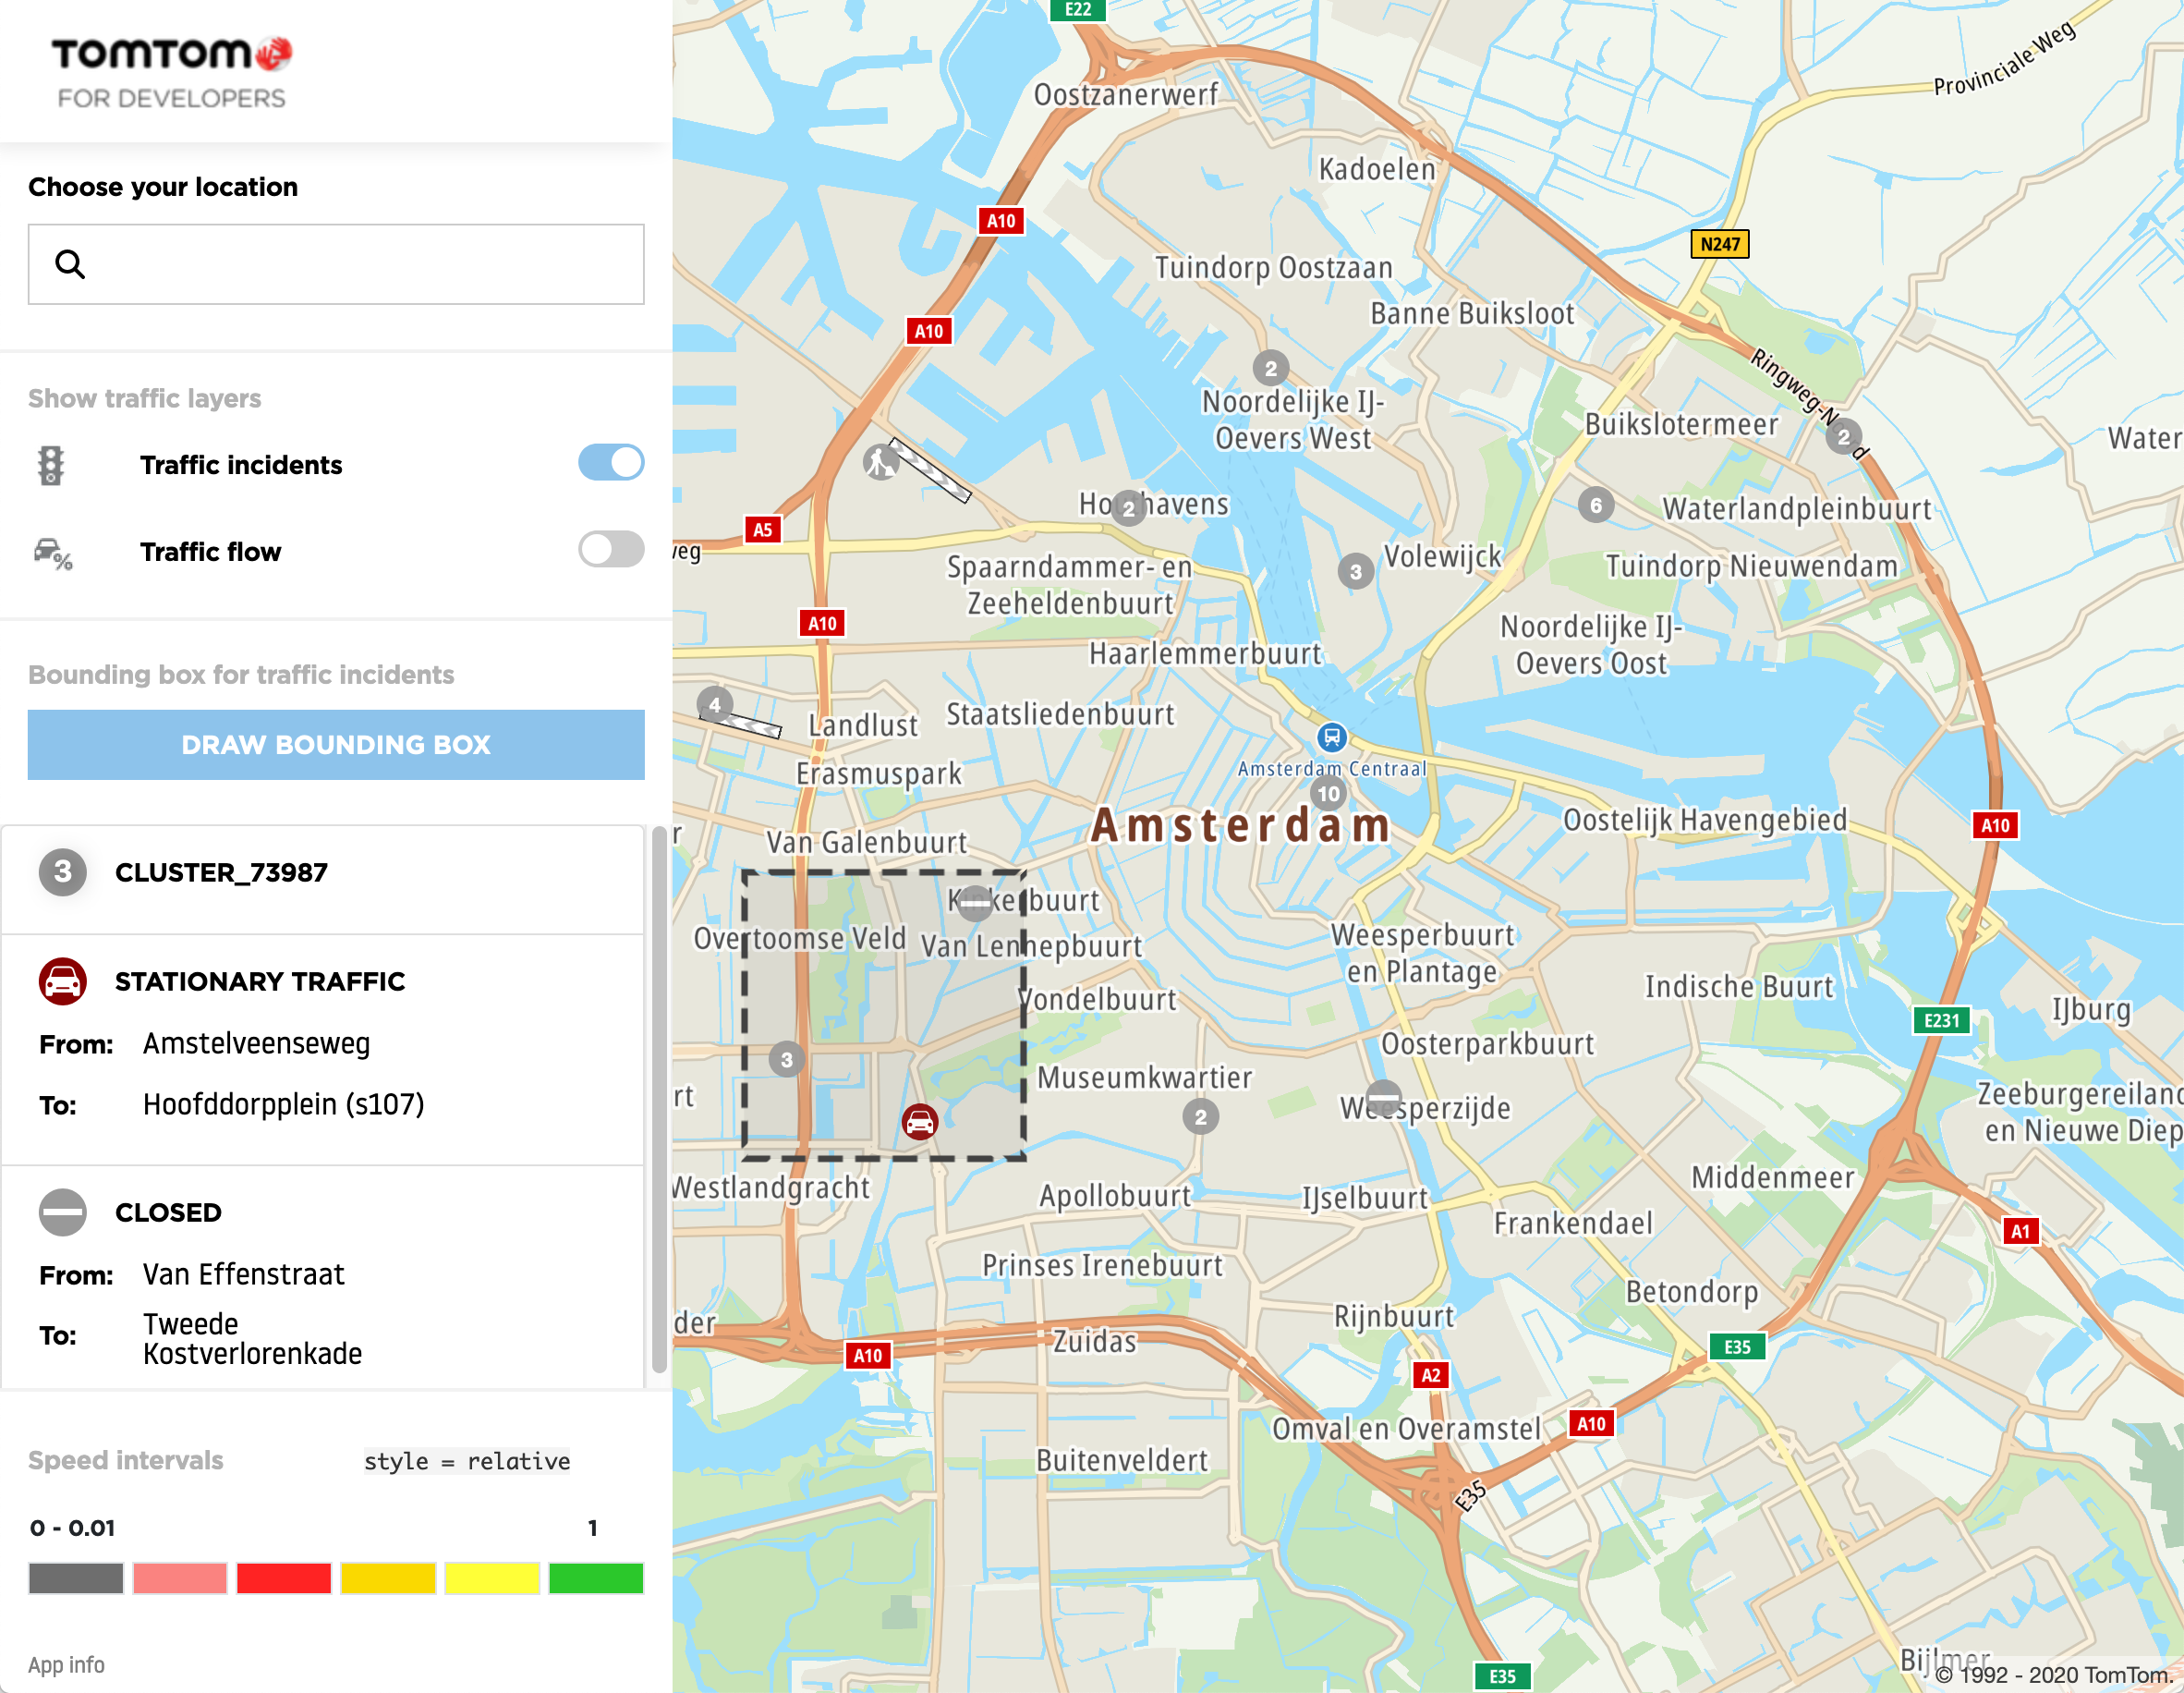
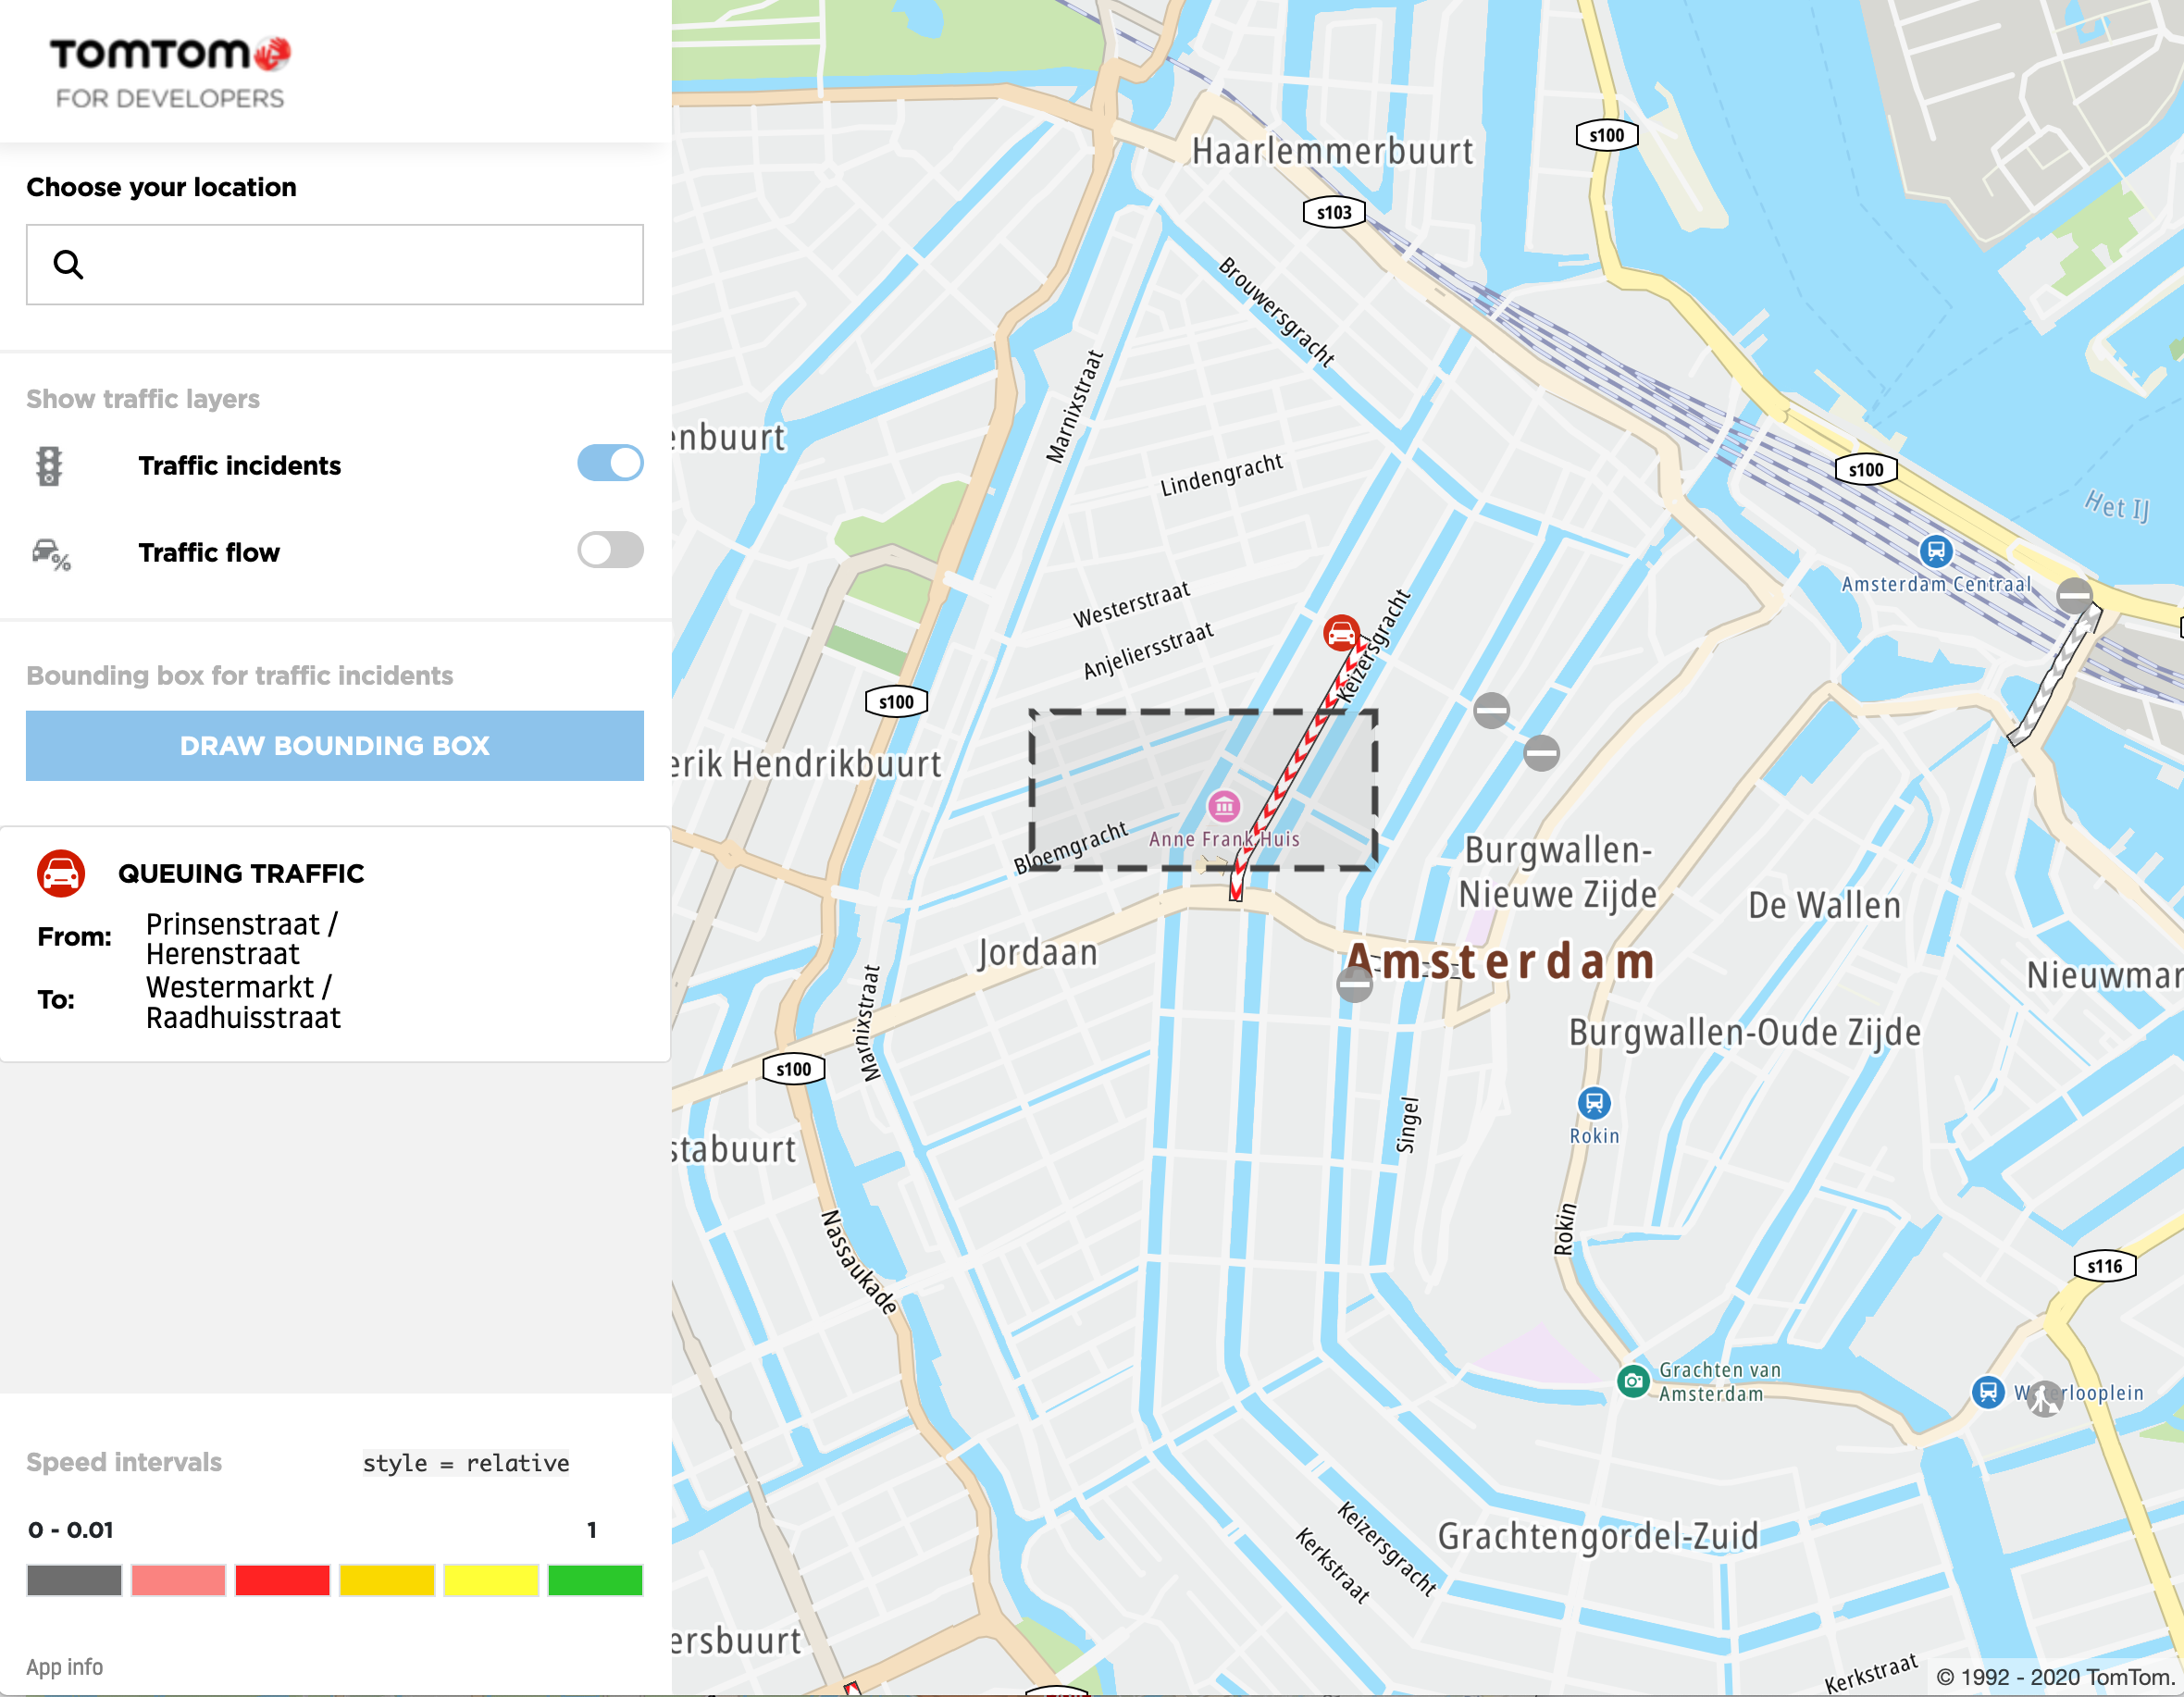
One of the interesting examples to observe is when the user selects the bounding box which seems to be empty, but there are traffic incidents returned in the list like on the following screen:
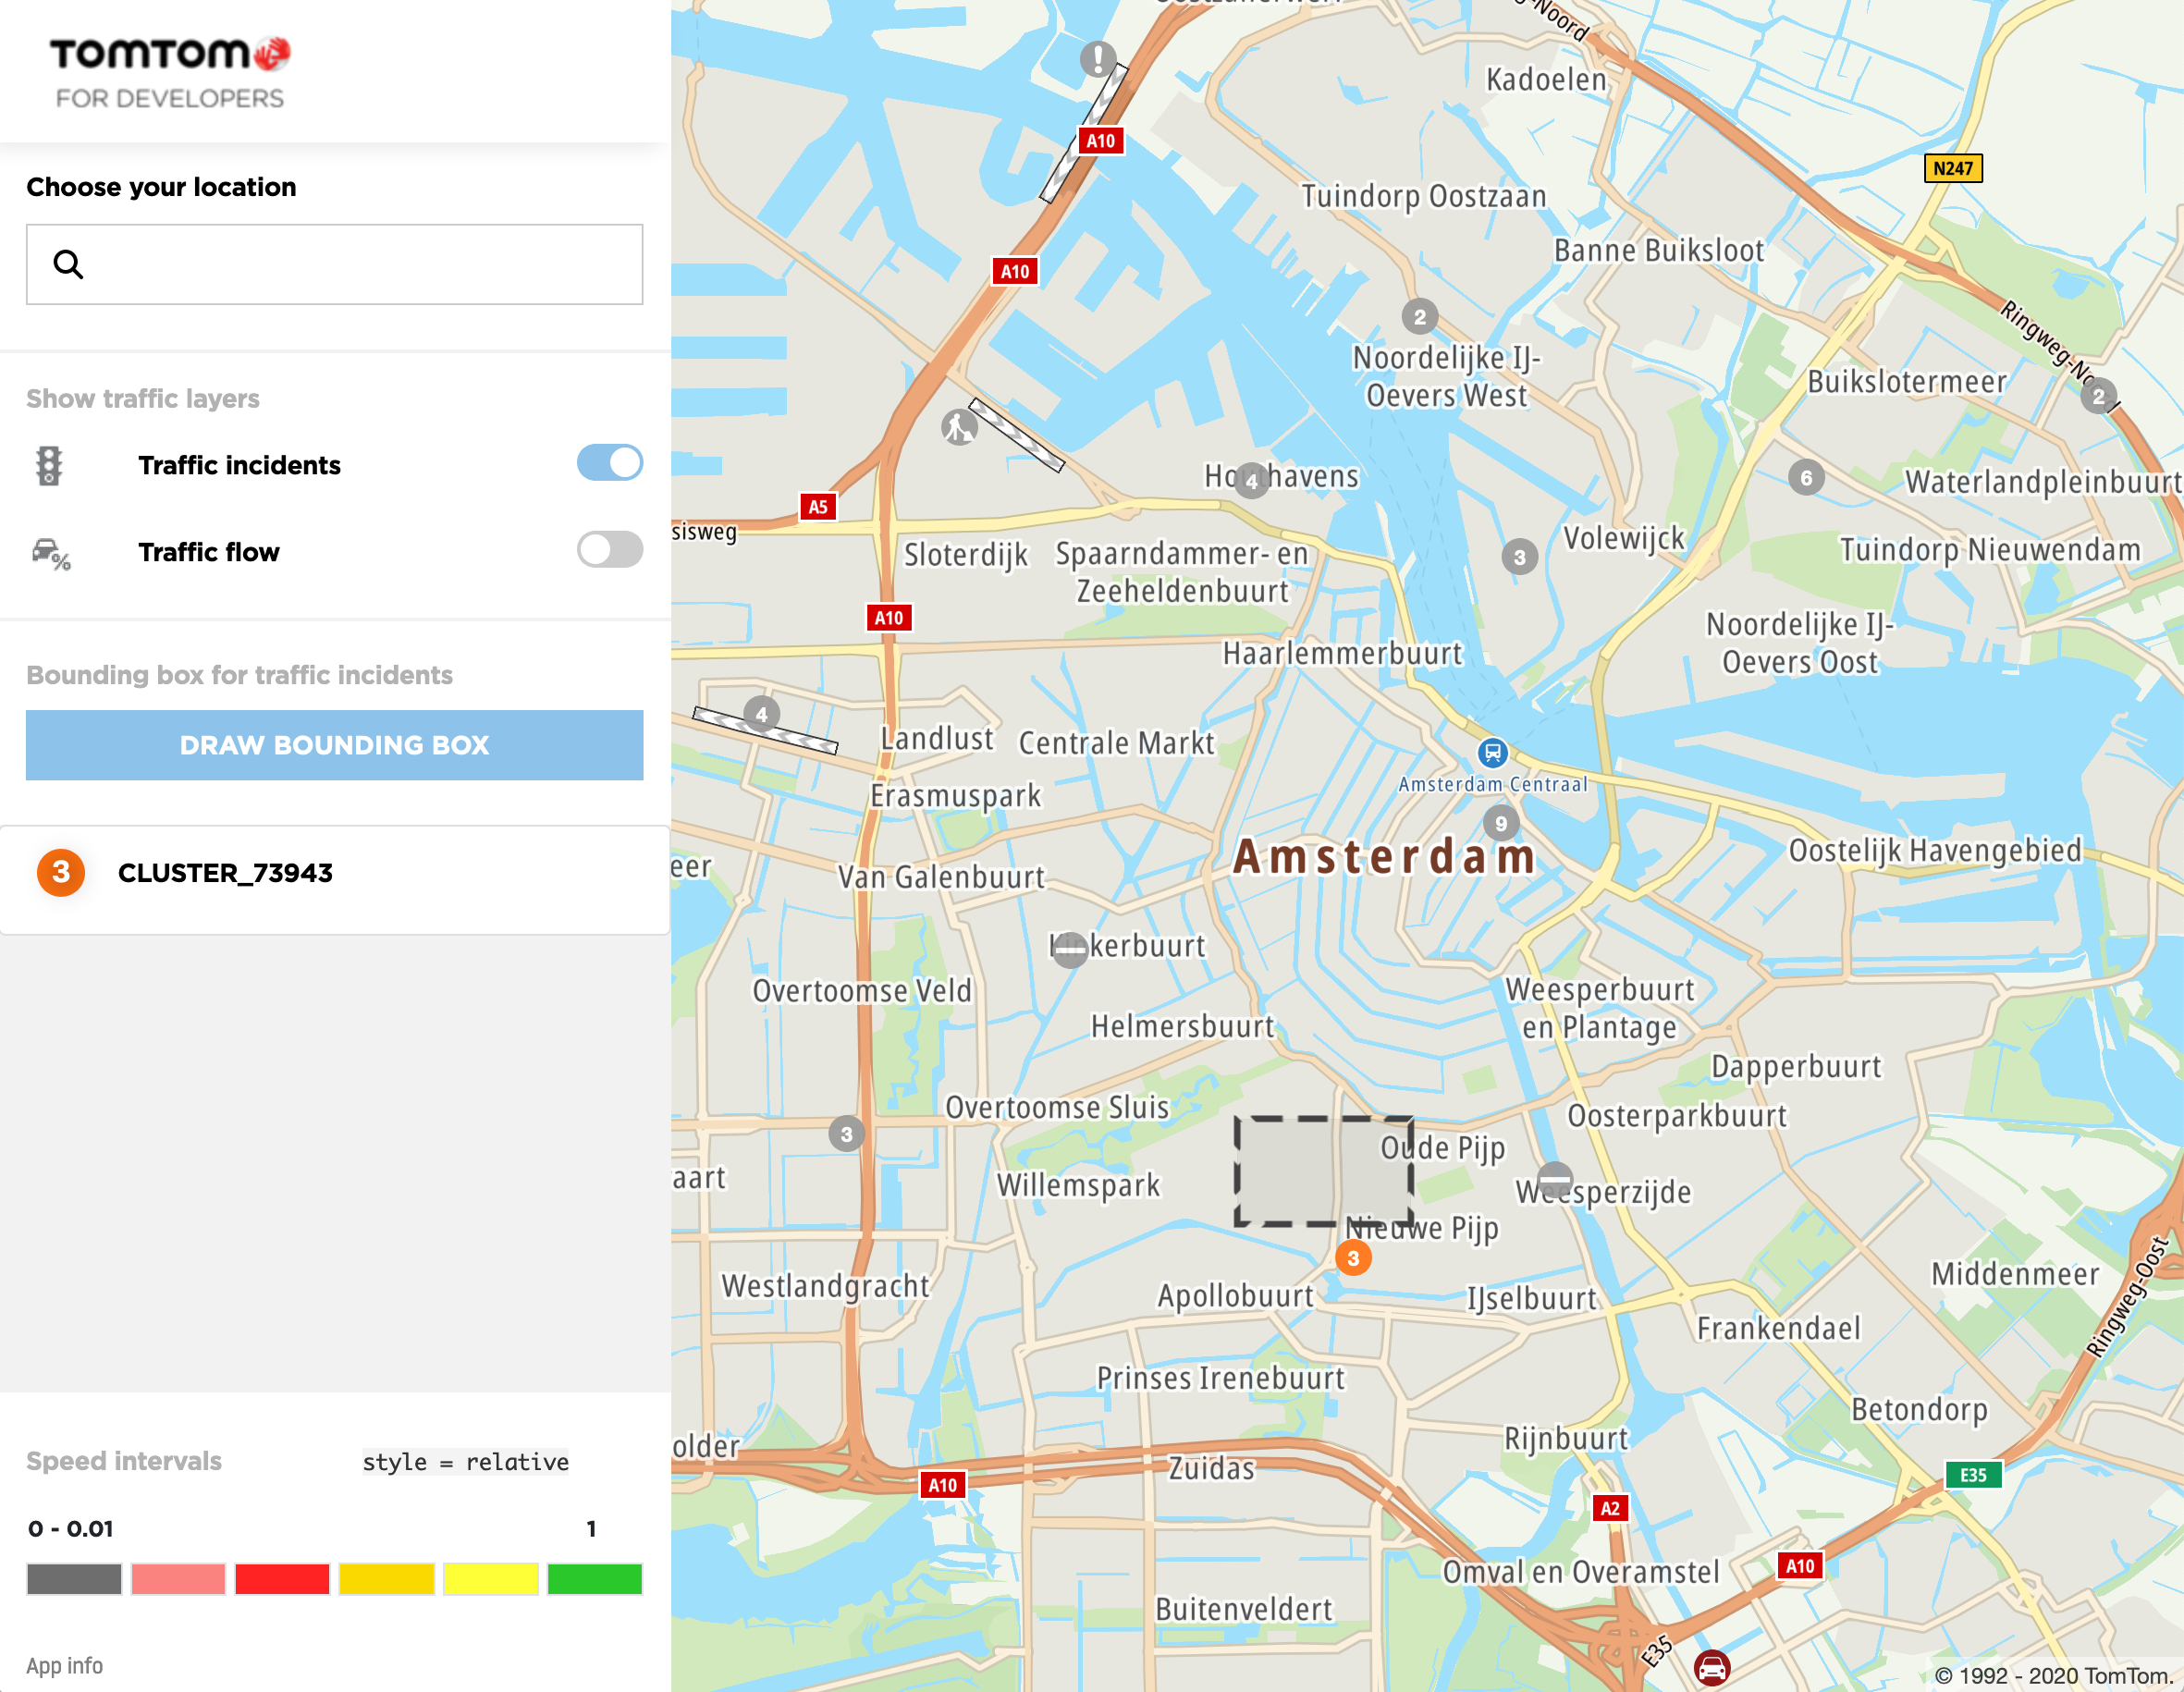
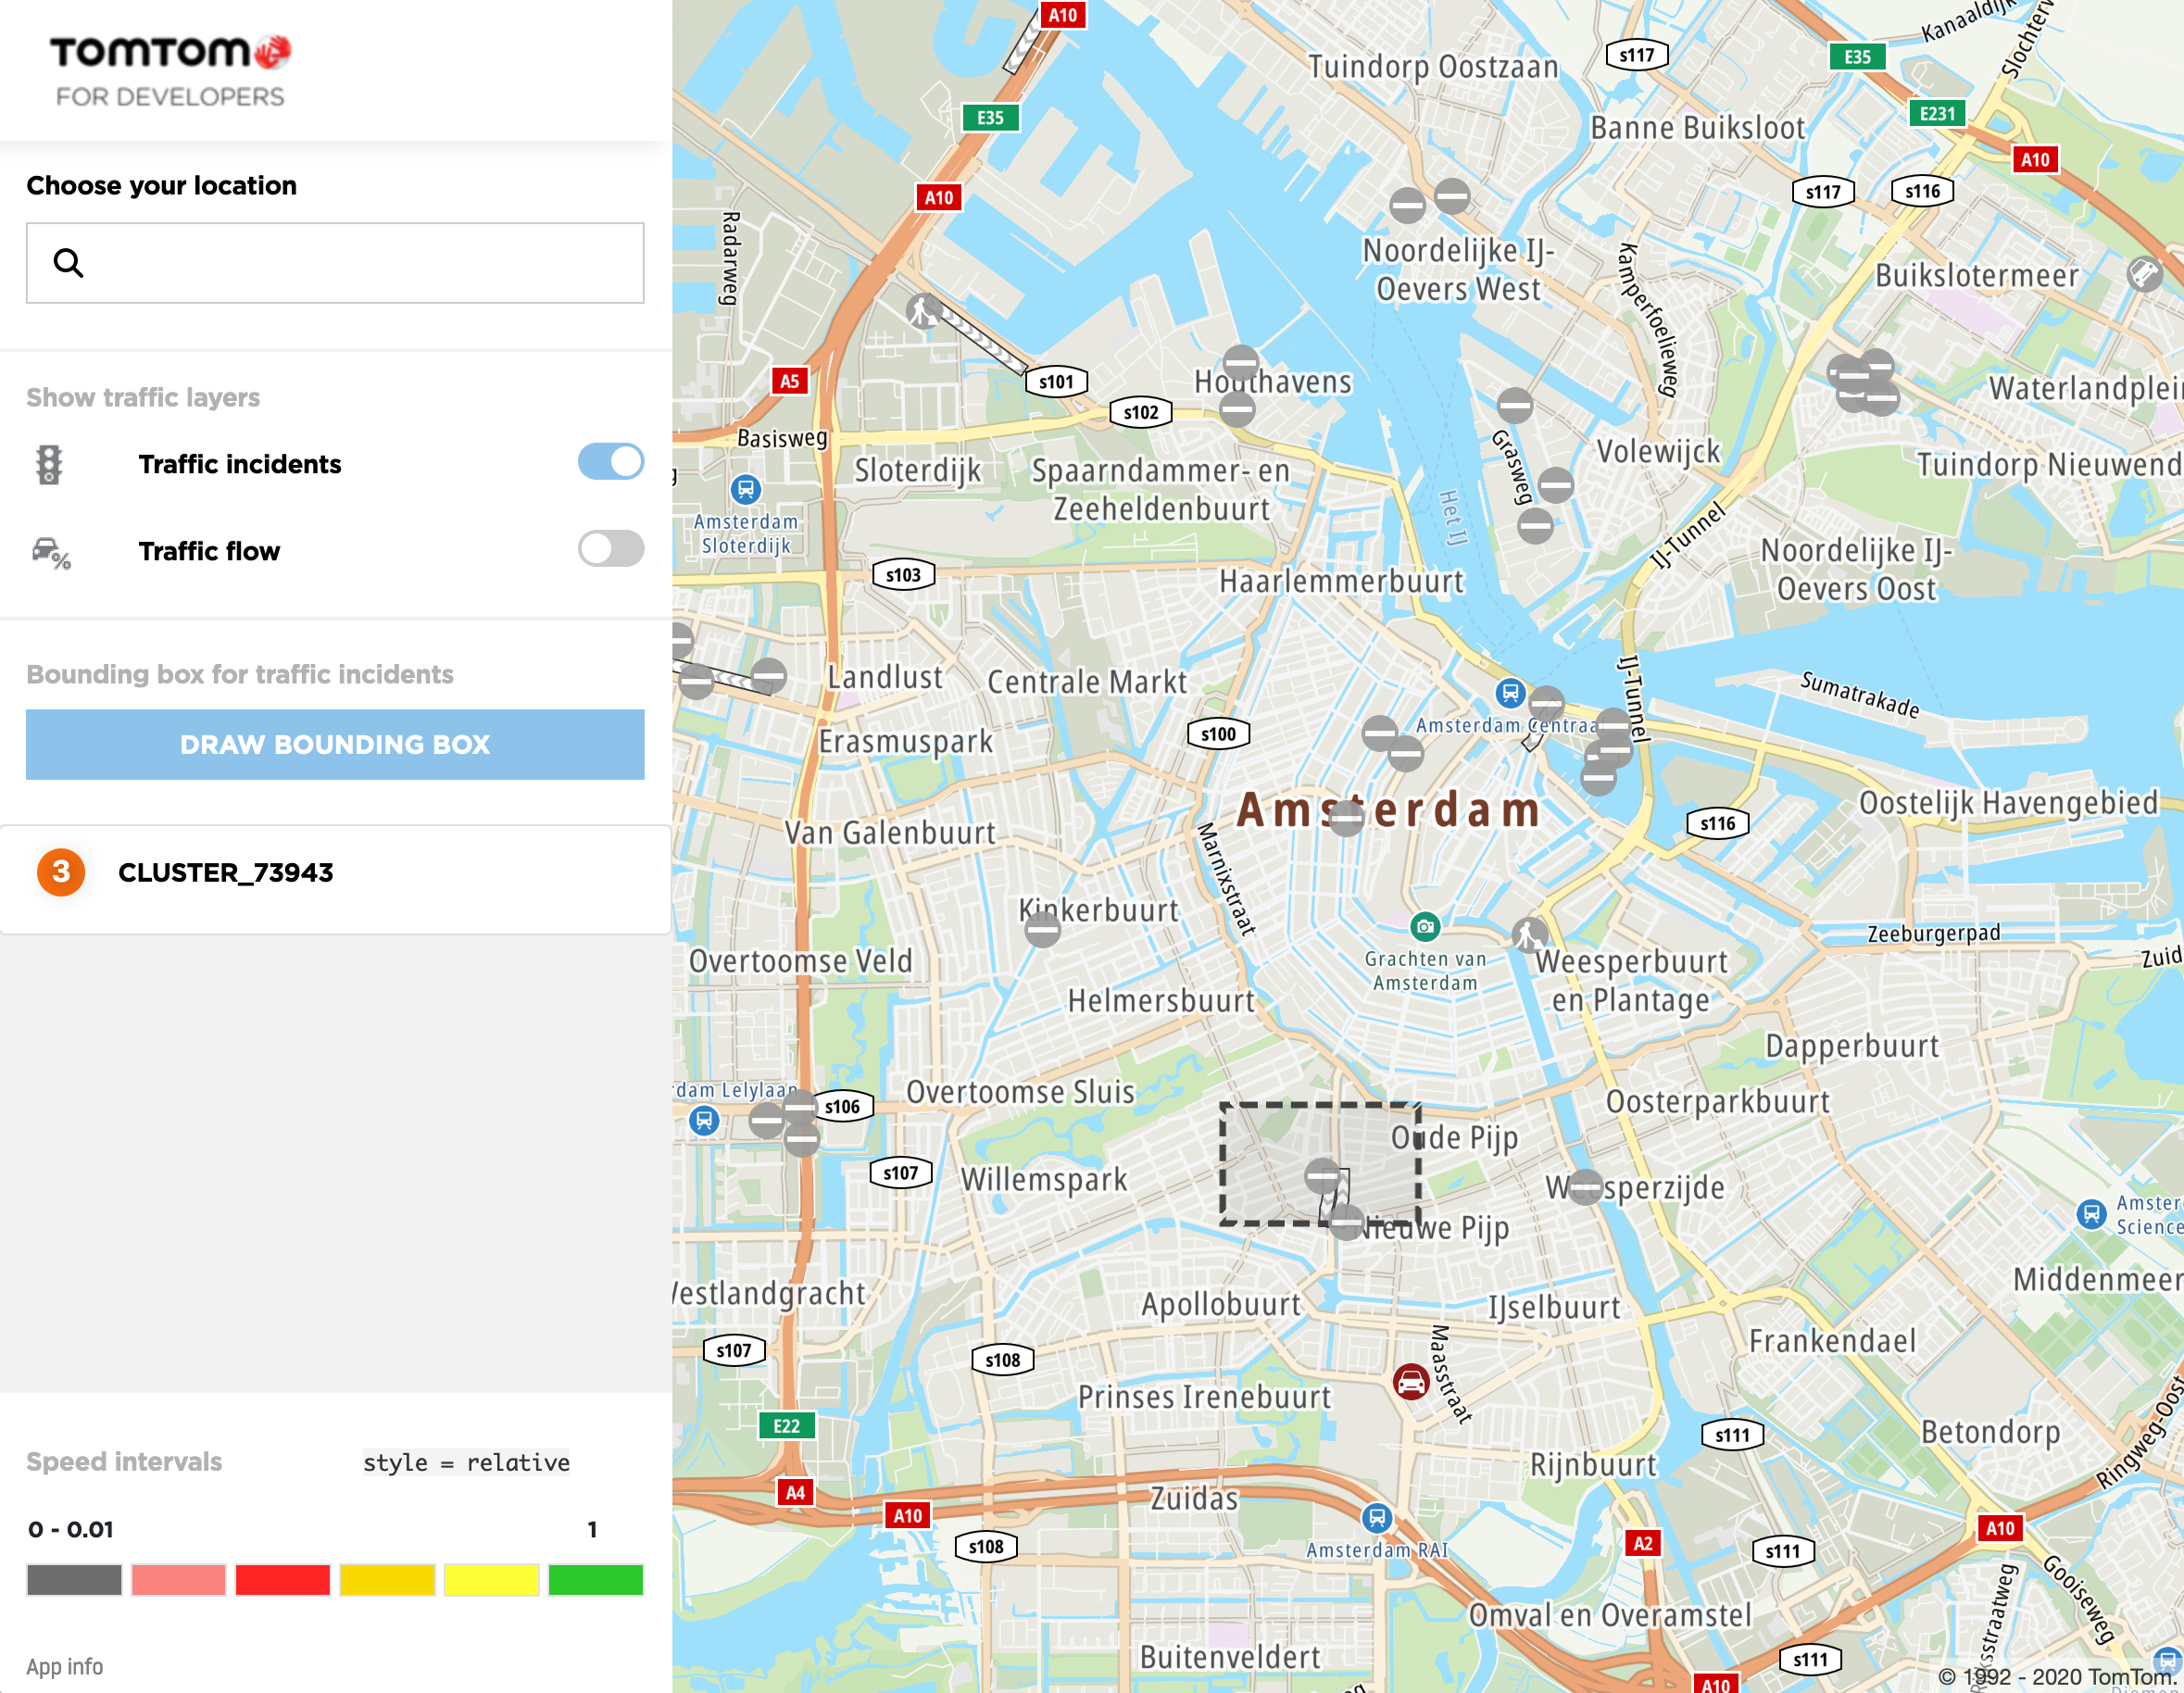
The Incident Details API endpoint returned a cluster of incidents even if the bounding box seems to be outside of the cluster. This is a typical and correct scenario when one of the single incidents which is inside the cluster belongs to the bounding box. After slightly zooming in the map to force the cluster to expand, the user can see that a few single incidents are inside the bounding box, as shown in the following screen:
Another interesting scenario is how the single traffic incident is structured. A traffic incident consists of the POI icon which is a starting point of the incident, and the incident geometry (tube) which might be quite long depending on the incident. As you can see on the following screen, the Incident Details API endpoint returned a single traffic incident although it seems to be outside of the bounding box:
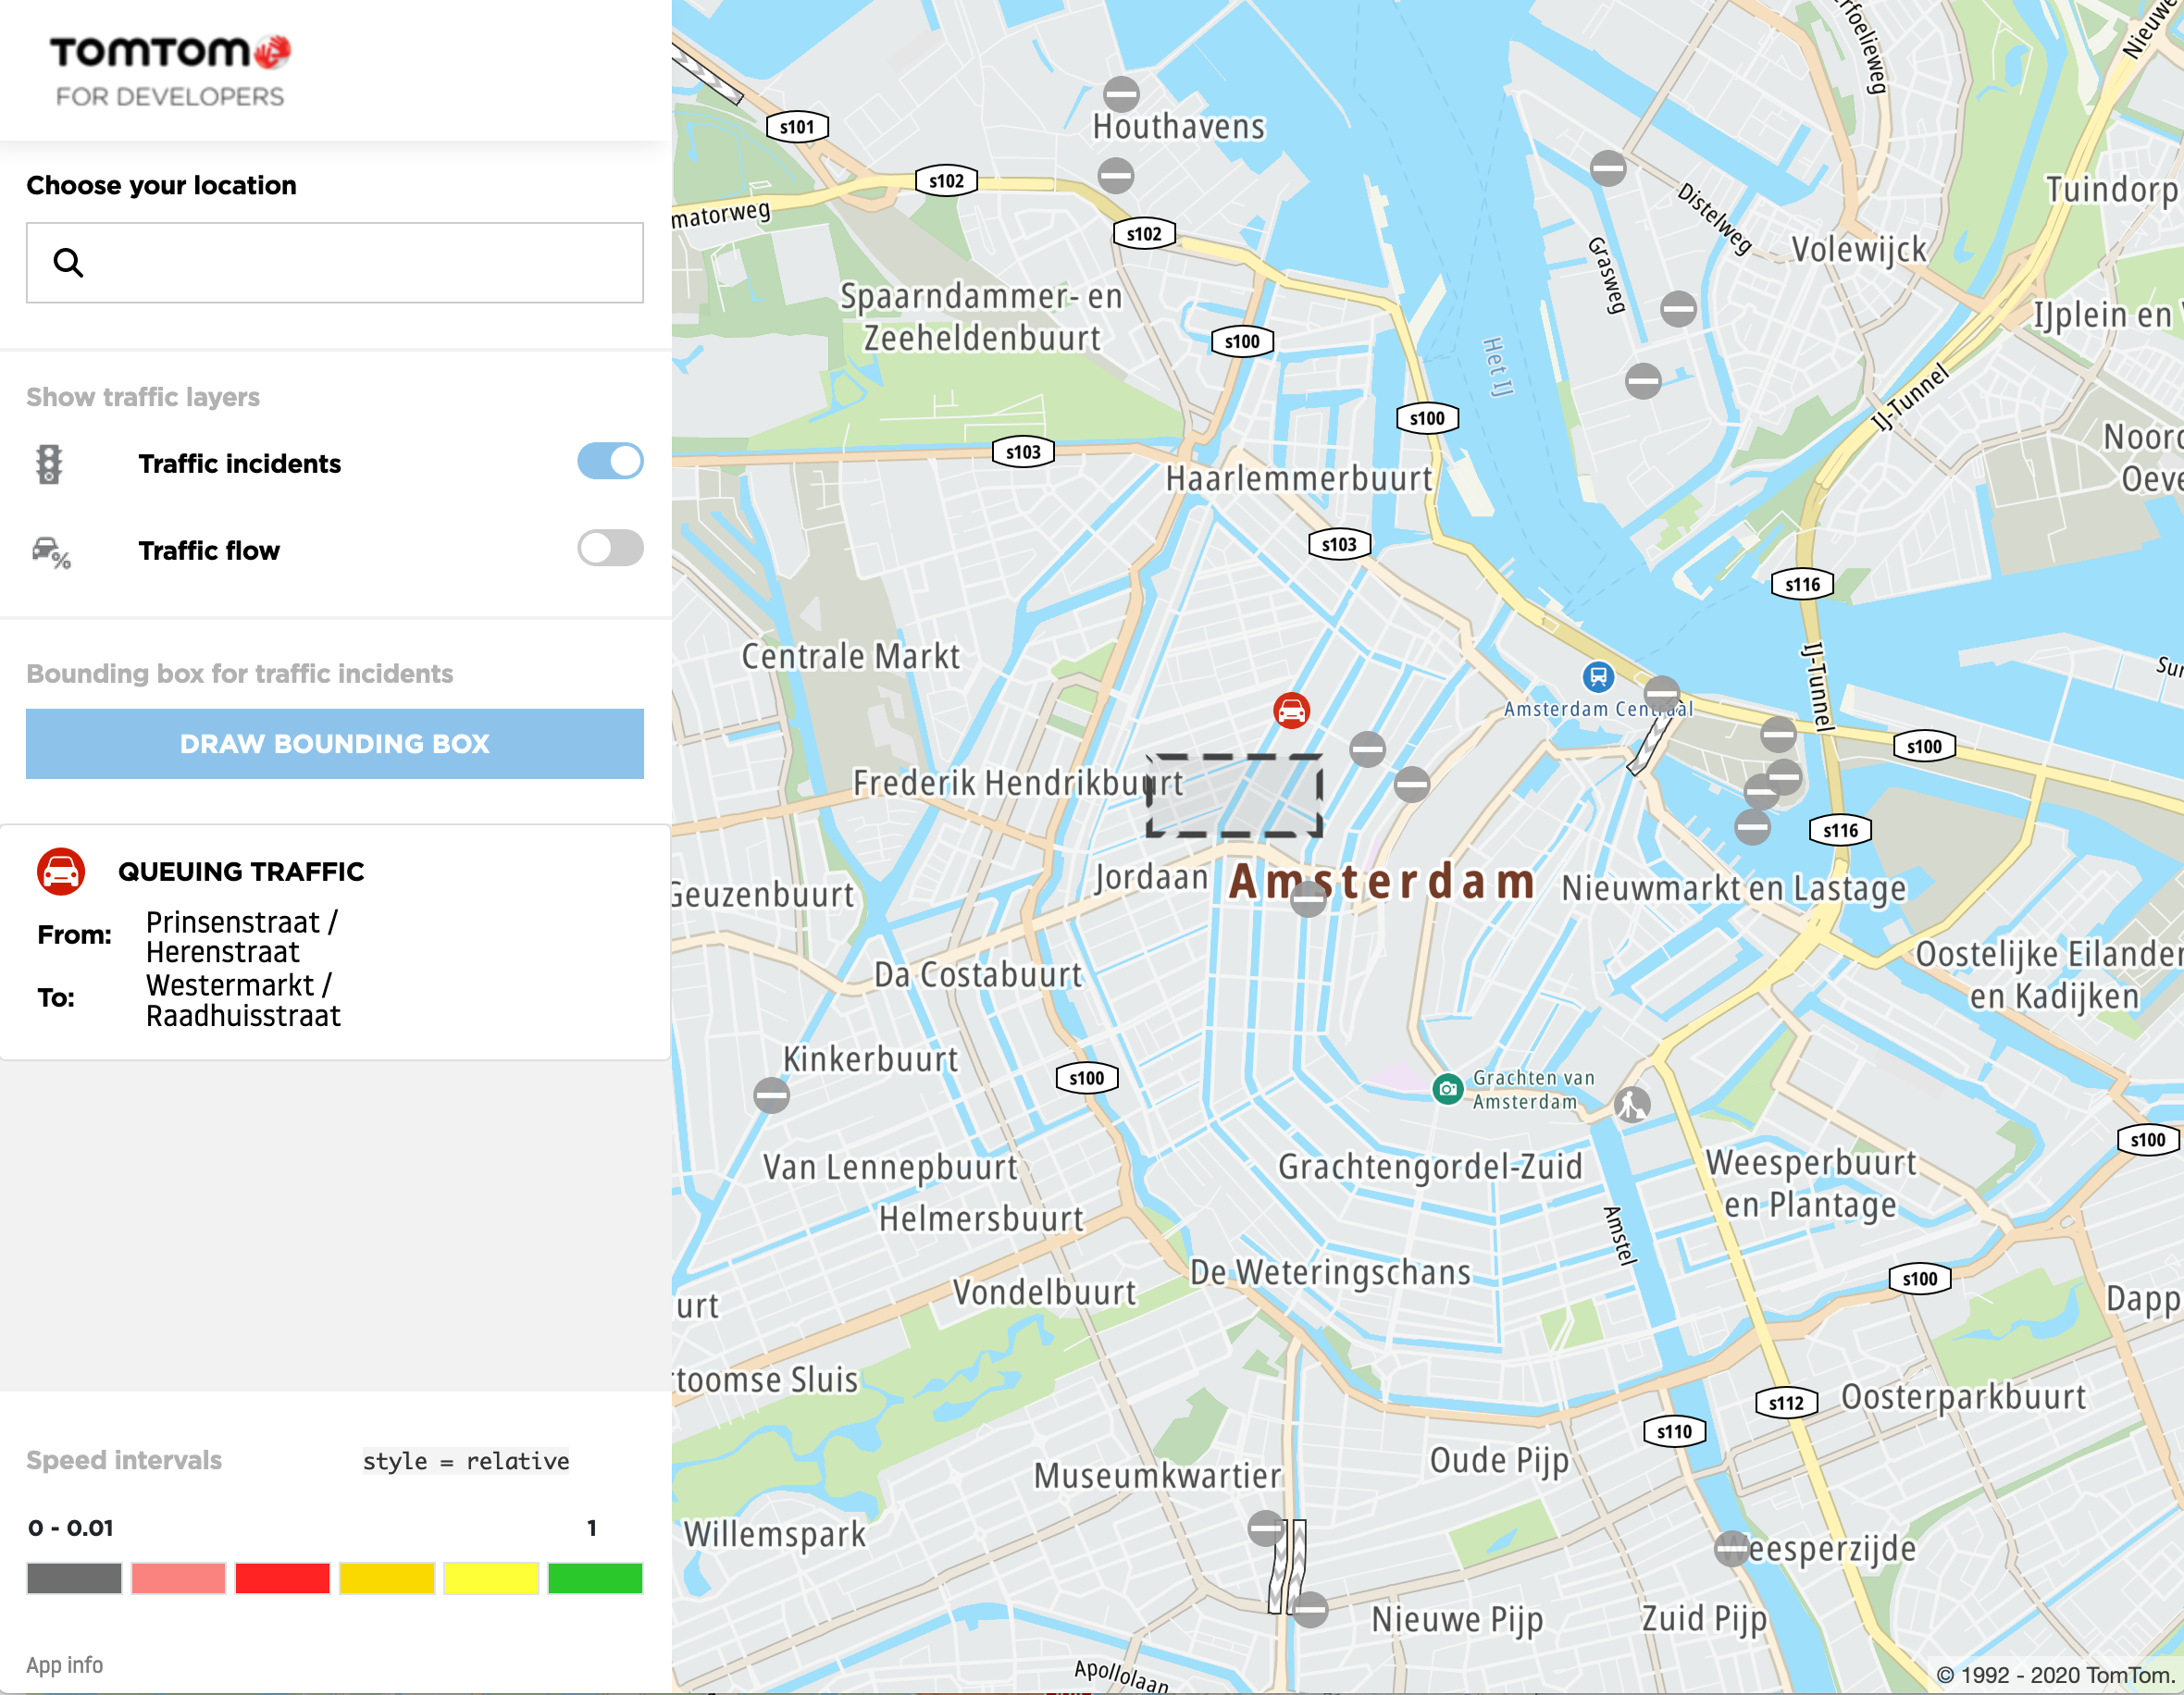
After zooming in the map you can spot that even if the beginning of the traffic incident is ** outside** of the bounding box, the rest of the incident geometry is inside of the bounding box so that it is returned by the incident details service. See the following screen:
The full source code of this tutorial is available on the TomTom GitHub account: https://github.com/tomtom-international/traffic-tutorial-web-sdk. Feel free to fork it, modify it, and learn from it.
Happy coding!