Where to Open a Chinese Restaurant in Amsterdam using TomTom Maps APIs
)
If you're looking to open a restaurant you'll need to take into consideration location and where competitors are. By using surrounding data and demographic data you can create map that helps you visualize the best location to open up your restaurant.
Table of Contents:1. Introduction2. Data Requirements3. View Candidate Neighborhoods on a Map4. Explore the Surroundings5. In-Depth Analysis of One Neighborhood6. Conclusion and Future Work[1. Introduction]
This is the virtual challenge I chose in order to complete an online Data Science course. I had so much fun tackling the challenge using TomTom Maps APIs that I would like to share the project with others!
1.1 The Challenge
Linda has a dream to open a Chinese restaurant and share the joy of great food with others. Now that everything is ready, she chooses Amsterdam to be the place where her dream takes off. Amsterdam is a diverse, exciting place, but its high tourism and population make finding the optimal location challenging.
1.2 The Approach
Linda is planning to open her Chinese restaurant in Amsterdam. I need to collect data from at least two sources to narrow down her selection:
Demographic data (for instance: population density per area in Amsterdam)
Data of the surroundings (for instance: density of similar restaurants nearby)
Since you are here to read about fantastic things you can do with TomTom Maps APIs, I will be much more focused on the second part: Data of the surroundings. If you are interested in the complete story, please read the full story here.
1.3 Business Questions
To find the ideal location for the restaurant, I must first seek answers to these questions.
Question 1: How popular will Chinese food be in the neighborhood?For Linda, it's important to serve traditional Chinese food in same the style in which she learned to first create her dishes. Even though Chinese food is widely loved, it makes sense to double check how existing Chinese restaurants are perceived. I will seek to answer this question using TomTom Maps APIs.
Question 2: Who are the target customers and where do they live?It is going to be a small restaurant (5 to 7 tables) due to the limited investment. The primary income would be takeout and orders made online. From past experience, Linda knows that people who live alone are more likely to buy takeout or use online food ordering apps such as Uber Eats. They are the ideal target customers for her new restaurant. So, I will look for an area with a relatively high density of one-person household. I need demographic information to answer this question.
[2. Data requirements]
My focus point for Linda’s new restaurant is location, location, location… Thus, I need to collect data that can help me answer the questions, which falls into two main categories:
Data of the surroundings (density of similar restaurants nearby)
Demographic data (per area in Amsterdam)
2.1 Data of Surroundings
TomTom Search API: To find all points of interest (POI) per category around a certain location, I will utilize TomTom Search:
2.2 Demographic data
Demographic features that are crucial to learn for this project:
Total Households: Number of households in a neighborhood.
High number of total households guarantees a solid base of potential customers.
Population density: A more densely populated area means more customers for a restaurant. The unit of population density is number of people per square kilometer.
On top of total households, this feature tells us how many households there are within a given area. Since people living nearby are more likely target customers, the more densely populated neighborhood is a more ideal choice.
One-person Households: Number of households with only one-person residing.
One-person households are perfect target customers, as these individuals are more likely to order takeout and avoid cooking alone.
Demographic analysis is definitely essential to start narrowing down neighborhoods in Amsterdam. However, it is not the focus of this article. If you are interested in learning more about this process (including demographic data analysis), please read the full story.
2.3 Conclude demographic analysis
From studying and analyzing demographic data, I chose 10 out of 65 neighborhoods in Amsterdam. Now, I want to display all of these neighborhoods on a map, to give Linda some visuals so she can make her decision more easily!
[3. View candidate neighborhoods on a map]
I use these tools to visualize the information I gathered above:
TomTom Map: map data
Folium: map rendering library
Load the information of the 10 remaining neighborhoods into a dataframe:
In [2]:
# library to handle data in a vectorized manner
import numpy as np
# library to load dataframe
import pandas as pd

# Matplotlib and associated plotting modules
import matplotlib.colors as colors
import matplotlib.pyplot as plt
The CSV file that is loaded below is cleaned up based on analyzing demographic data. In the full story, I explain how to process the data from a larger dataset.
In [3]:
#Load the csv file.
df = pd.read_csv('https://dl.dropboxusercontent.com/s/3781fqm6w2i3gir/Amsterdam_top10.csv')
df
Out [3]:
In [4]:Install and import folium
#pip install folium==0.9.1 #comment it out if folium is already installedIn [5]:
import folium # map rendering library3.1 Use TomTom Search API
Sign up for a developer portal account, and then click “Get your key” on this page to get an API key you can use!
Load the TomTom API
TomTom API offers multiple APIs, including the Search API. There is no need to load each API separately.
In [6]:
import requests
tomtom_api_keys = ["YOUR TOMTOM API KEY"] # 2500 free calls/day
api_key = tomtom_api_keys[0]
Establishing the map
First, I want to define a function using Geocoding feature in Search API to get lat/lon of the center of a city. In this case, I retrieve the center of Amsterdam so that the map is properly aligned in the view.
In [7]:
# Search for city:
def SearchCity(api_key,City,Country):

    url = 'https://api.tomtom.com/search/2/search/'
    url += City + ', ' + Country
    url += '.json?limit=1&idxSet=Geo&key=' + api_key

    result = requests.get(url).json()

    GeoID = result['results'][0]['dataSources']['geometry']['id']
    position = result['results'][0]['position']

    return GeoID,position
In [8]:
# Use the SearchCity function to get the lat/lon of Amsterdam
Amsterdam_position = SearchCity(api_key, "Amsterdam", "Netherlands")
lat_amsterdam = Amsterdam_position[1]['lat']
lon_amsterdam = Amsterdam_position[1]['lon']
print("Center of Amsterdam lat/lon: (", lat_amsterdam, lon_amsterdam, ")")The output should be Center of Amsterdam lat/lon: ( 52.37317 4.89066 ).
Now, let’s instantiate the visual component, the TomTom map itself, so I can begin displaying neighborhoods.
In [9]:
#Define a function to initialize any map using TomTom map.
def init_map(api_key=api_key, latitude=0, longitude=0, zoom=14, layer = "basic", style = "main"):
    """
    The initialise_map function initializes a clean TomTom map
    """

    maps_url = "http://{s}.api.tomtom.com/map/1/tile/"+layer+"/"+style+"/{z}/{x}/{y}.png?tileSize=512&key="
    TomTom_map = folium.Map(
        location = [latitude, longitude],  # on what coordinates [lat, lon] initialise the map
        zoom_start = zoom,  # with what zoom level to initialize the map, from 0 to 22
        tiles = str(maps_url + api_key),
        attr = 'TomTom')

    return TomTom_map
3.2 Visualize one feature on the map
Let's start from visualizing the number of one-person households on the map to get an impression of the 10 candidate neighborhoods.
In [10]:
#Visualize one feature (number of one-person households) to get an impression of the 10 candidate neighborhoods.
TomTom_map = init_map(latitude=lat_amsterdam, longitude=lon_amsterdam, zoom=13, layer = "hybrid")

# add markers to map
for lat, lon, neighborhood, oph in zip(df['Lat'], df['Lon'], df['Neighborhood'], df['One-person Households']):
    label = '{}'.format(neighborhood)
    label = folium.Popup(label, parse_html=True)
    folium.Circle(
        [lat, lon],
        radius=oph/25,
        popup=label,
        color='#FF7F0F', # Orange
        fill=True,
        fill_color='#FF7F0F',
        fill_opacity=0.3).add_to(TomTom_map)

TomTom_map
Out [10]:
3.3. Visualize more features on the map
The above map gives us an impression of how many one-person households actually exist in each neighborhood.
Now, let's add two more features to the map, so there will be three features in total:
Orange circles represent the number of one-person households.
Blue circles represent the number of households in total.
Green circles represent the population density.
Important notes about these circles:
The center of the orange, green, and blue circles is the center of the neighborhood.
Click the center of the circles to see the name of the neighborhood.
The radius of each circle represents the number of each feature.
In order to show a more zoomed in map view, I re-adjust the center of the map.
Re-adjust the center of the 10 candidate neighborhoods. Based on the previous map visualization, I can see a better center for further analysis is the address: Prinsengracht 745A Amsterdam.
In [11]:
url = "https://api.tomtom.com/search/2/geocode/Prinsengracht 745A Amsterdam.json?countrySet=NL&key=" + api_key
result = requests.get(url).json()
In [12]:
lat_center = result['results'][0]['position']['lat']
lon_center = result['results'][0]['position']['lon']
print(lat_center, lon_center)52.36425 4.88628In [23]:
TomTom_map = init_map(latitude=lat_center, longitude=lon_center, zoom=14, layer = "hybrid")
# add markers that represent one-person households to the map
for lat, lon, neighborhood, oph in zip(df['Lat'], df['Lon'], df['Neighborhood'], df['One-person Households']):
label = '{}'.format(neighborhood)
label = folium.Popup(label, parse_html=True)
folium.Circle(
[lat, lon],
radius=oph/25,
popup=label,
color='#FF7F0F', # Orange
fill=True,
fill_color='#FF7F0F',
fill_opacity=0.3
).add_to(TomTom_map)
# add markers that represent total households to the map
for lat, lon, neighborhood, households in zip(df['Lat'], df['Lon'], df['Neighborhood'], df['Total Households']):
label = '{}'.format(neighborhood)
label = folium.Popup(label, parse_html=True)
folium.Circle(
[lat, lon],
radius=households/25,
popup=label,
color='#1E77B4', # Blue
fill=False
).add_to(TomTom_map)
# add markers that represent population density to the map
for lat, lon, neighborhood, density in zip(df['Lat'], df['Lon'], df['Neighborhood'], df['Population Density']):
label = '{}'.format(neighborhood)
label = folium.Popup(label, parse_html=True)
folium.Circle(
[lat, lon],
radius=density/100,
popup=label,
color='#2A9E2A', # Green
fill=False
).add_to(TomTom_map)
TomTom_map.save('Neighborhood_demographic.html')
TomTom_mapOut [23]: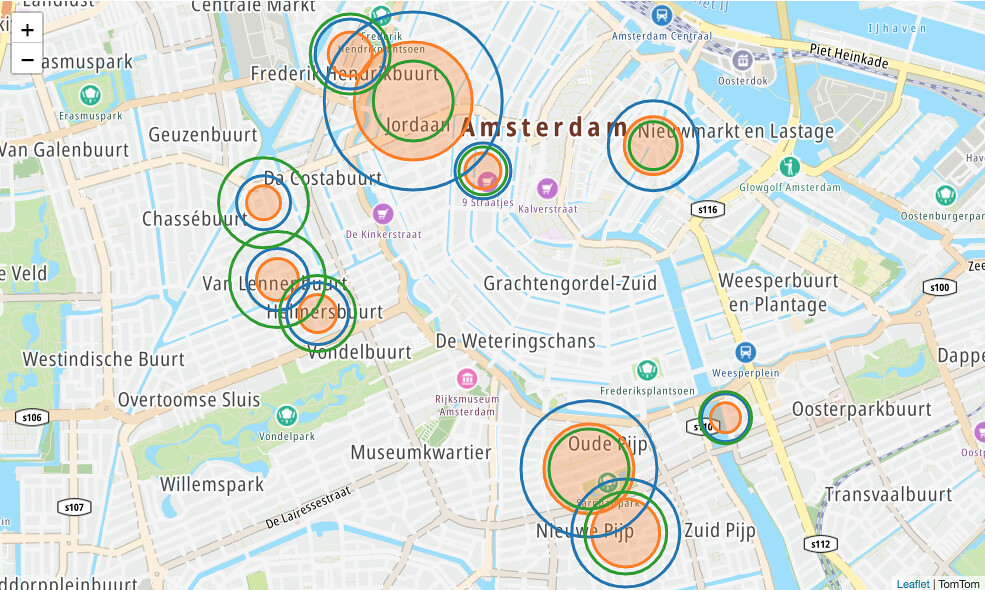
As you can see, when choosing an ideal location to open the Chinese restaurant:
The bigger the green circles the better.
The less difference between the size of the blue circles and the orange circles the better.
3.4. Conclusion and Next Steps
Based the above analysis, I have chosen 10 out of 65 neighborhoods in Amsterdam city proper as the candidate neighborhoods for us to investigate further.
The next step, covered in the next chapter, will be to further analyze the 10 neighborhoods by looking into the density of Chinese restaurants in each. This will help me narrow down Linda’s choices for the best exact location for her new restaurant!
[4. Explore the surroundings]
Now, I know where the remaining 10 neighborhoods are located and their geo-relationship relative to each other. It's time to explore the surroundings. In the scope of the project, I will focus on only question in this space.
4.1. How many Chinese restaurants are already available in each neighborhood?
TomTom Search allows single-line fuzzy search for addresses and POIs, which I will use since I take into account more neighborhood attributes for Linda’s restaurant. Use the Search API explorer to get the url. I choose to store all search results in a JSON file. Some key variables:
Search radius: radius
Maximum number of search results: limit
In [20]:
search_radius = 3000
search_limit = 2000
In [35]:
url = ('https://api.tomtom.com/search/2/categorySearch/Chinese restaurant.json?countrySet=NL'
+'&lat=52.364250&lon=4.886280&limit=2000&radius=3000&key=' + api_key)
result = requests.get(url).json()
#resultOne of the search results in the JSON file.
In [ ]:
{'type': 'POI',
   'id': 'NL/POI/p0/109857',
   'score': 5.14904,
   'dist': 150.32529954911772,
   'info': 'search:ta:528009005857203-NL',
   'poi': {'name': 'Taste Of Culture',
    'phone': '+(31)-(20)-4271136',
    'categorySet': [{'id': 7315012}],
    'url': 'www.tasteofculture.net',
    'categories': ['chinese', 'restaurant'],
    'classifications': [{'code': 'RESTAURANT',
      'names': [{'nameLocale': 'en-US', 'name': 'chinese'},
       {'nameLocale': 'en-US', 'name': 'restaurant'}]}]},
   'address': {'streetNumber': '139HS',
    'streetName': 'Korte Leidsedwarsstraat',
    'municipalitySubdivision': 'Amsterdam',
    'municipality': 'Amsterdam',
    'countrySubdivision': 'North Holland',
    'postalCode': '1017',
    'extendedPostalCode': '1017PZ',
    'countryCode': 'NL',
    'country': 'Netherlands',
    'countryCodeISO3': 'NLD',
    'freeformAddress': 'Korte Leidsedwarsstraat 139HS, 1017PZ, Amsterdam',
    'localName': 'Amsterdam'},
   'position': {'lat': 52.36311, 'lon': 4.88509},
   'viewport': {'topLeftPoint': {'lat': 52.36401, 'lon': 4.88362},
    'btmRightPoint': {'lat': 52.36221, 'lon': 4.88656}},
   'entryPoints': [{'type': 'main',
     'position': {'lat': 52.36305, 'lon': 4.885}}]},
I can learn from the above JSON file that the following information is essential to show Chinese Restaurants on the map:
Get lat lon from:'position': {'lat': 52.36311, 'lon': 4.88509},
Get name from: 'poi': {'name': 'Taste Of Culture'
Now, let’s show these restaurants.
4.2. Showing the Chinese restaurants on the map
Use the position and name information extracted from the JSON file to show POIs on the map.
In [22]:
# add a grey circle to represent the search radius
folium.Circle(
    [lat_center, lon_center],
    radius=search_radius,
    color='#004B7F', # Navy
    opacity=0.3,
    fill = False
).add_to(TomTom_map)

# Add POIs one by one to the map
for poi in result['results']:
    folium.Marker(location=tuple(poi['position'].values()),
                  popup=str(poi['poi']['name']),
                  icon=folium.Icon(color='blue', icon='glyphicon-star')
                  #icon=icon
             ).add_to(TomTom_map)
TomTom_map.save('POI_ChineseRestaurant.html')
TomTom_map
Out [22]: Legends of the above map:
Blue markers: Chinese restaurants.
Orange circles: the number of one-person households.
Blue circles: the number of households in total.
Green circles: the population density.
Grey circle: the search radius.
4.3. Cluster the POIs
What I would really like to do is have a more obvious visual as to the number of Chinese restaurants in the area. Clustering the POIs (Point of Interests) might help this.
In [24]:
from folium.plugins import MarkerCluster
In [25]:
# Define the marker cluster
mc = MarkerCluster()
# add a grey circle to represent the search radius
folium.Circle(
[lat_center, lon_center],
radius=search_radius,
color='#004B7F', # Navy
opacity=0.3,
fill = False
).add_to(TomTom_map)
# Add POIs one by one to the map
for poi in result['results']:
mc.add_child(
folium.Marker(
location=tuple(poi['position'].values()),
popup=str(poi['poi']['name'])
))
TomTom_map.add_child(mc)
TomTom_map.save('POI_Clustered.html')
TomTom_mapOut [25:]
4.4. Key Takeaways
Now that I have investigated options for Linda through multiple filters and criteria, I can conclude:
There must be at least one existing Chinese restaurant in or near the neighborhood. If there isn't at least one Chinese restaurant, it might mean that there is not enough demand. Opening a Chinese restaurant without understanding why there are no any could be a risk for Linda.
There cannot be more than 10 existing Chinese restaurants in the neighborhood, in order to mitigate competition for her. Linda wants to stand out!
If I apply the criteria from the above map, I can exclude these neighborhoods:
Too many existing Chinese restaurants:
Nieuwmarkt
No existing Chinese restaurant in or near the neighborhood:
Weesperzijde
Frederik Hendrikbuurt
Grachtengordel-West
Nieuwe Pijp
The remaining neighborhoods left for Linda to choose from:
Jordaan
Van Lennepbuurt
Oude Pijp
Kinkerbuurt
Helmersbuurt
[5. In-depth analysis of one neighborhood]
Let's use Jordaan as an example to show how I look into one particular candidate neighborhood.
5.1. Draw the area of the neighborhood on the map
In [26]:
area_name = 'Jordaan'
Define a function to get polygon of a given GeoID.
In [27]:
# get polygon of GeoID:
def getPolygon(api_key,GeoID,zoomLevel):

    url = 'https://api.tomtom.com/search/2/additionalData.json?geometries=' + GeoID
    url += '&geometriesZoom=' + str(zoomLevel)
    url += '&key=' + api_key

    result = requests.get(url).json()
    GeoJson = result['additionalData'][0]['geometryData']

    return GeoJson
In [28]:
# Search City:
GeoID, position = SearchCity(api_key, area_name ,'Amsterdam')In [29]:
lat_area = position['lat']
lon_area = position['lon']
print("The center of the neighborhood is: (", lat_area, ", ", lon_area, ")")The center of the neighborhood is: (52.37329 , 4.87992).
Draw the polygon:
In [30]:
# Get Polygon of city:
Polygon = getPolygon(api_key,GeoID,22)
In [31]:
map_url = 'http://{s}.api.tomtom.com/map/1/tile/basic/main/{z}/{x}/{y}.png?view=Unified&key=' + api_key
TomTom_map = folium.Map(
location=[lat_area, lon_area],
zoom_start=14,
tiles= map_url,
attr='TomTom')
# add polygons to a map
folium.GeoJson(
Polygon).add_to(TomTom_map)
TomTom_map.save('Area.html')
TomTom_map[Out] 31:
5.2. Show Chinese restaurants in this neighborhood
Search for the Chinese restaurant using the Search API. Set the search radius to 1.2 km to cover the entire neighborhood.
In [32]:
url = ('https://api.tomtom.com/search/2/categorySearch/Chinese restaurant.json?countrySet=NL'
       +'&lat=52.37329&lon=4.87992&limit=2000&radius=1200&key=' + api_key)
result = requests.get(url).json()
#result
In [33]:
# add a grey circle to represent the search radius
folium.Circle(
[lat_area, lon_area],
radius=1200,
color='#004B7F', # Navy
opacity=0.3,
fill = False
).add_to(TomTom_map)
# Add POIs one by one to the map
for poi in result['results']:
folium.Marker(location=tuple(poi['position'].values()),
popup=str(poi['poi']['name']),
icon=folium.Icon(color='blue', icon='glyphicon-star')
#icon=icon
).add_to(TomTom_map)
TomTom_map.save('Area_POI.html')
TomTom_mapOut [33]: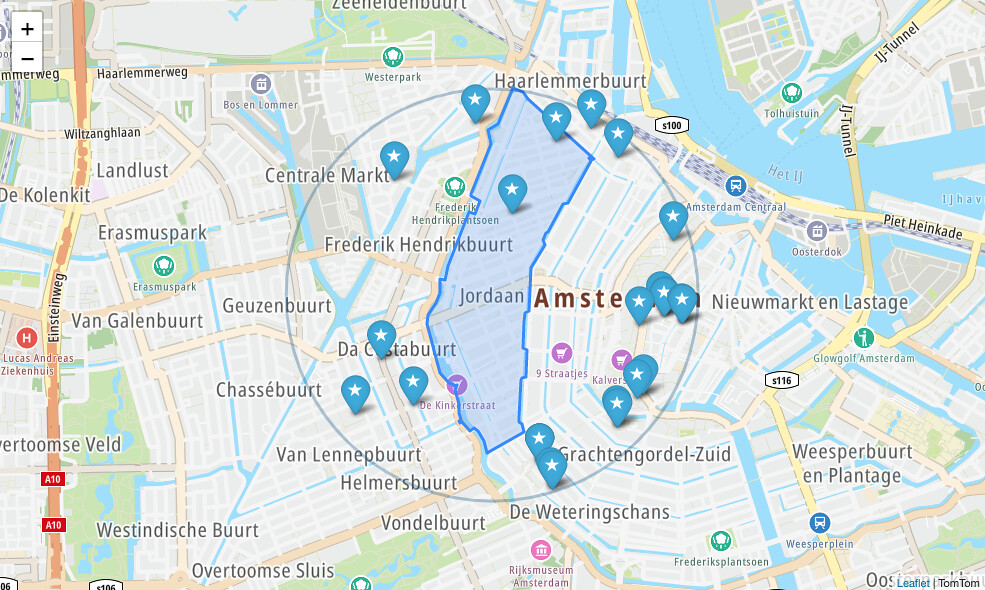
Legends of the above map:
Blue markers: Chinese restaurants.
Blue area: The shape of the neighborhood.
Grey circle: the search radius.
Takeaways from this Neighborhood:
According to TomTom Map Display API, there are more than 20 Chinese Restaurants within the range of 500 meters of the neighborhood Jordaan.
From the map I learn that the west of Jordaan seems to be void of Chinese restaurants. If Linda opens a Chinese restaurant there, she will likely have enough customers.
5.3. Repeat!
At this point, I would advise Linda to repeat this in-depth examination for each neighborhood she is considering. I could also adjust the details. I consider to include other venues, for example – looking at the number of cafes, snack bars, etc present in an area in addition to regular restaurants.
[6. Conclusion and future work]
The Limitation of this ProjectIt only focuses on residential information. This project is limited by the lack of crucial information. So far I have been focused quite a lot on residence information and one-person households. However, customers can also come from nearby business venues. I am unable to validate any assumption or answer any questions, because the information of business venues in Amsterdam is not as available as demographic information.
Rent of a Venue is not Taken into ConsiderationDue to lack of information, I am unable to include rental price as part of the analysis. Cost could be a big factor for Linda. In order to be able to predict the potential profit, however, it is crucial to include potential rental price.
Explore more POI CategoriesThere are other facilities in the neighborhood which may influence the income of the restaurant. For instance:
How easy is it to reach the place via public transportation?
Search for nearby bus stops, tram stations, train stations, etc.
How easy is it to park your car in the neighborhood?
Search for nearby parking garages or open parking places.
6.1 Next steps for Linda:
Continue to perform the same in-depth analysis to all neighborhoods as I did in here.
Include rental price of each neighborhood in future analysis to be informed about her costs to profit ratio.