How to Create a Satellite Map Using the Maps SDK
)
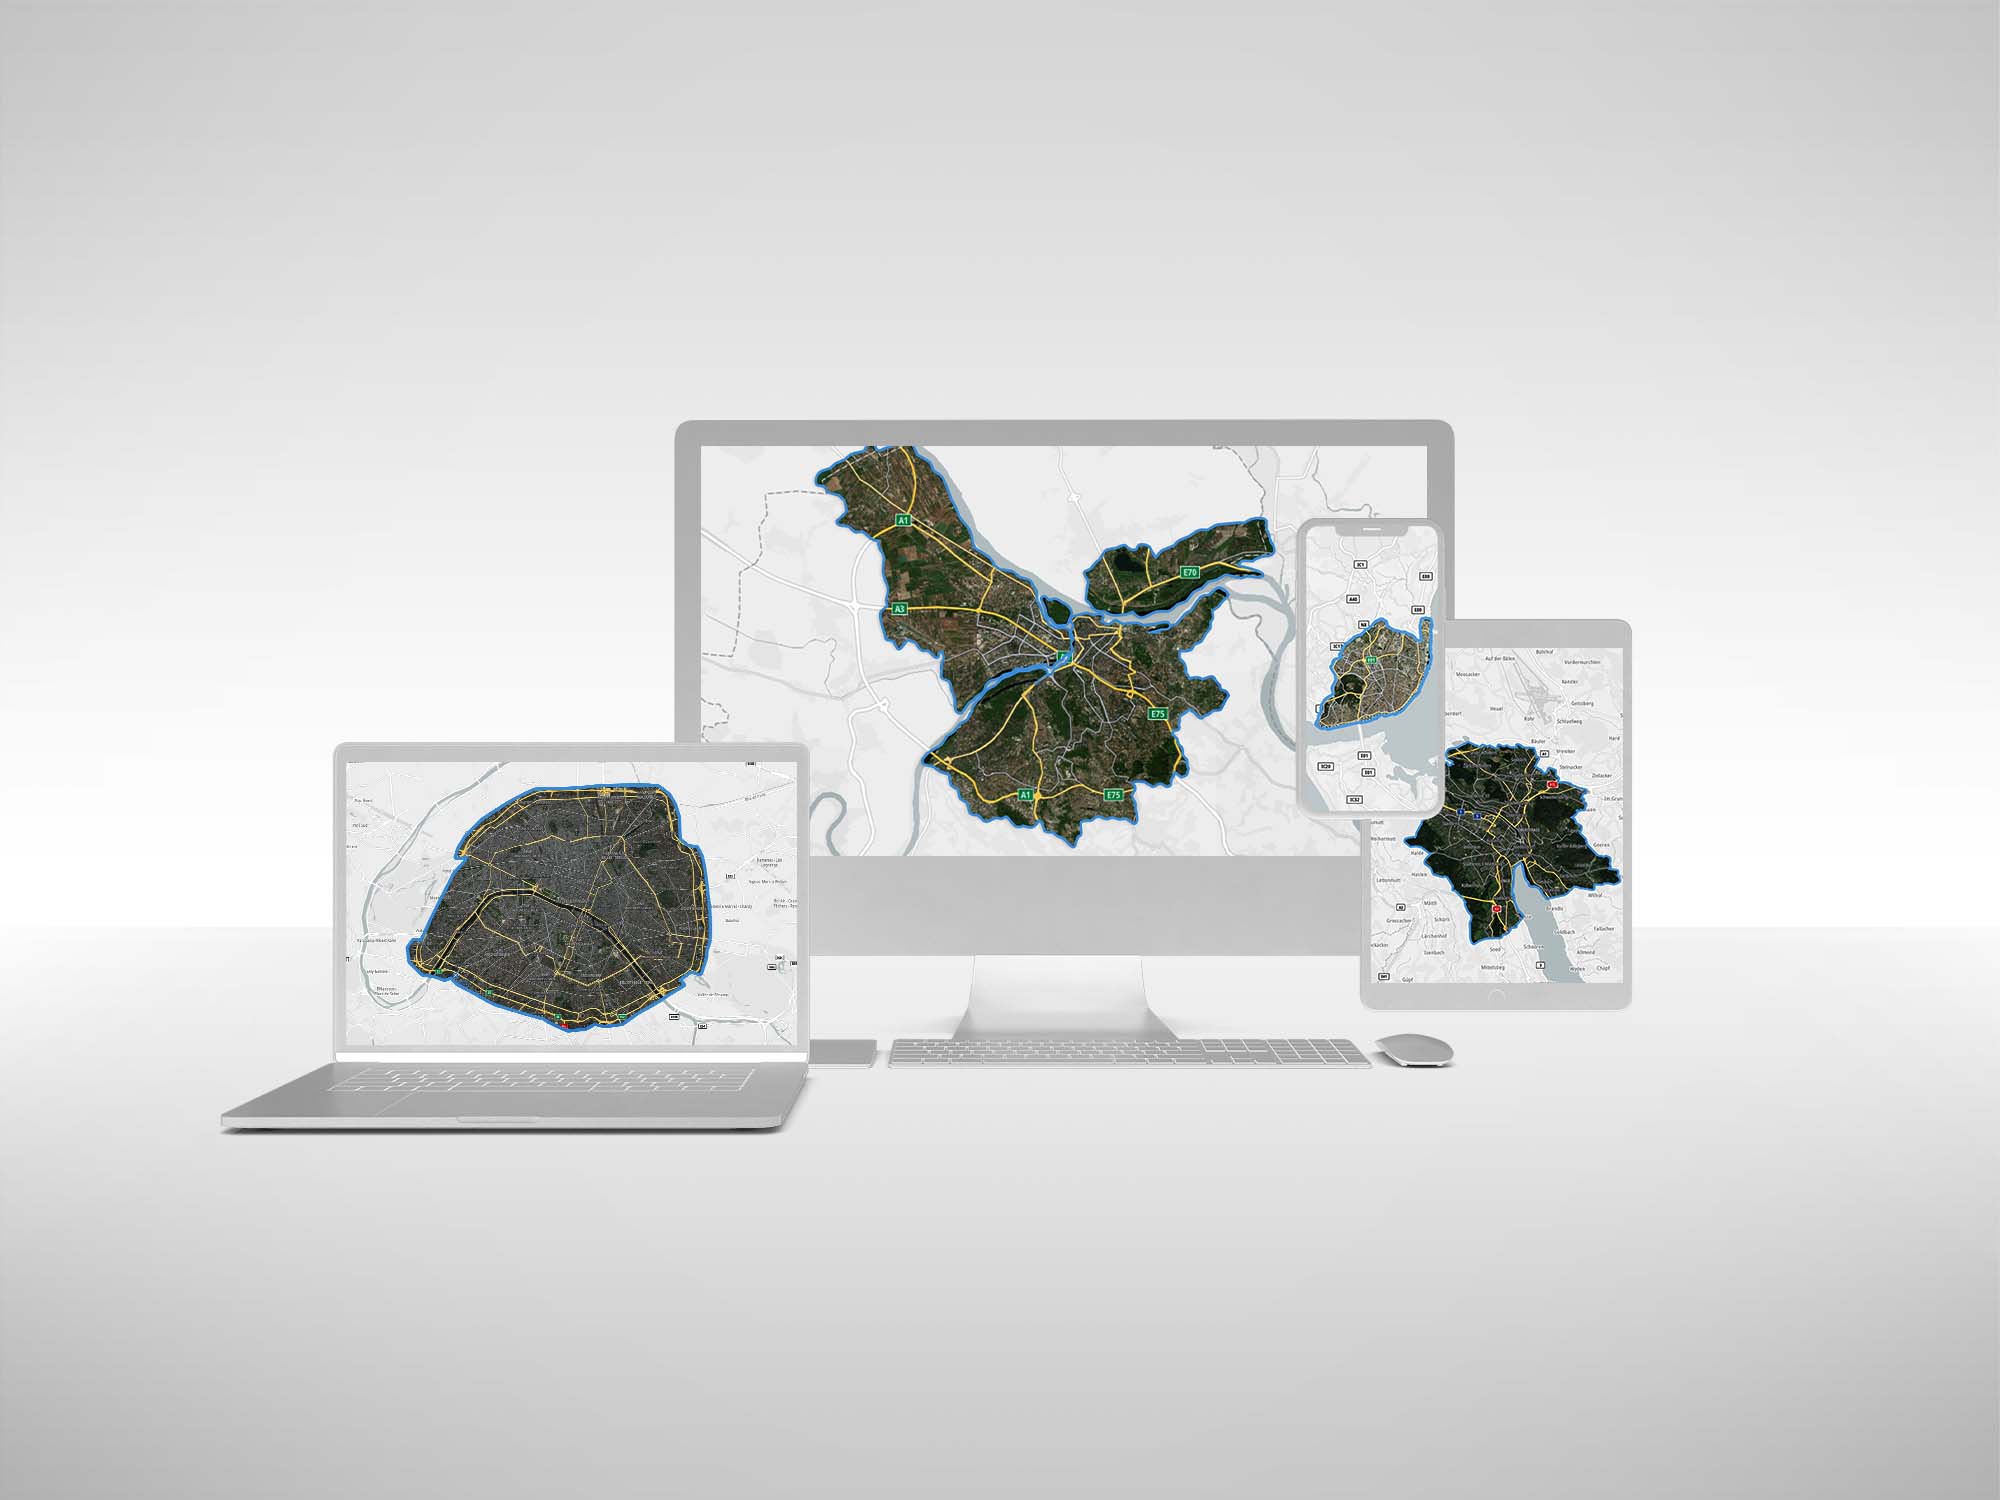
Satellite imagery is here! In this tutorial we’ll walk you through how to get started by creating a satellite map using TomTom’s Maps SDK and satellite tiles, and then configuring the map to allow us to see POIs.
As part of our partnership with Maxar, we can now offer satellite tiles to our developer community as part of our Map Display API! Satellite imagery tiles are now available as part of the Raster Tile service. They can be used on their own, or can be combined with vector tiles, displaying road networks, map labels and POIs as an overlay on top.
In this tutorial we’ll walk you through how to get started by creating a satellite map using TomTom’s Maps SDK and satellite tiles, and then configuring the map to allow us to see POIs. This map will be a vector map automatically, but incorporate satellite tiles with a simple change to the code which integrates them as a map style.
You can also browse the documentation of the satellite style within our Raster Tile docs before creating your first satellite map.
Getting started
We’ll start by creating a basic HTML file, embedding the Maps SDK and its stylesheet in the head of the document. We’re loading the SDK from TomTom’s CDN (Content Delivery Network), if however, you’re using Node.js and a module bundler like Webpack you can install the SDK via npm. You can find documentation on installing the SDK with npm and alternative download options in the Maps SDK documentation.
We’ve added a div element as the first child of the document body which will be the DOM element the map will be rendered to. We’ve included an “id” attribute on this element which we’ll use when the map object is created so the SDK knows which element to use as the map container.
<!DOCTYPE html>
<html>
  <head>
    <script src="https://api.tomtom.com/maps-sdk-for-web/cdn/6.x/6.18.0/maps/maps-web.min.js"></script>
    <link
      rel="stylesheet"
      type="text/css"
      href="https://api.tomtom.com/maps-sdk-for-web/cdn/6.x/6.18.0/maps/maps.css"
    />
  </head>
  <body>
    <div id="map"></div>
  </body>
</html>
Adding a TomTom map
To create the map, we’re going to add a script block after the map container element we added earlier. We’ll define a constant with the value of our TomTom API key (if you don't have one already visit the How to get a TomTom API key page) and use its value in the initialization of the map object. We’re also passing the value of the “id” of the map container element as the “container” option.
<div id="map"></div>
<script>
  const API_KEY = "<YOUR-API-KEY>";

  const map = tt.map({
    key: API_KEY,
    container: "map"
  });
</script>
We now have a functional map but to make it visible in our browser we need to specify the map dimensions. Let’s add a style block to the head of the document to do that, with a selector targeting the map container element.
<style>
#map {
width: 100vw;
height: 100vh;
}
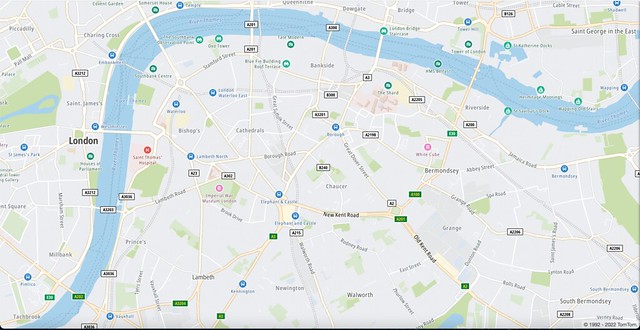
</style> If you now load the page in your browser, you should see a map sized to the browser window. By default, the Maps SDK creates a vector-based map, in the next step we’ll configure the map to use TomTom’s satellite map tiles.
Configuring the map to use satellite map tiles
To use the satellite map tiles, we need make only one change to our map initialization code, adding the “style” option to override the default style with a satellite style provided by TomTom. We’re using the Merged style method, provided by the Maps API Resource service to combine the satellite style along with a POI style to show points of interest on our satellite map.
The satellite map can be further customized with traffic information by appending two additional styles to the map style URL, the “light” variants are preferred for greater contrast:
traffic_incidents=2/incidents_light. Displays traffic incident icons.
traffic_flow=2/flow_relative-light. Displays traffic congestion.
Lastly, note the wildcard character “*” in the style URL is used to request the latest style resource version. If you wanted to request a specific version, you would specify it in this position in the URL path e.g. “22.1.4-0”.
const map = tt.map({
key: API_KEY,
container: "map",
style: `https://api.tomtom.com/style/1/style/*?map=2/basic_street-satellite&poi=2/poi_dynamic-satellite&key=${API_KEY}`
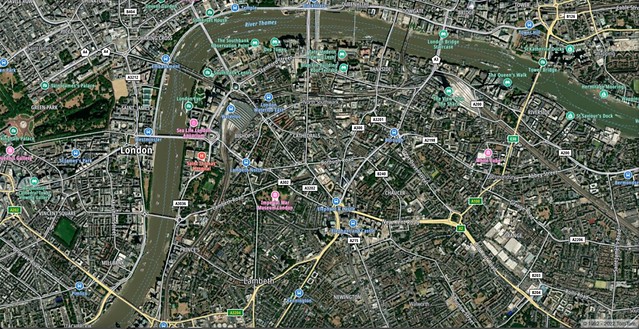
}); If you reload the page in your browser, you’ll now see the map is now using TomTom’s satellite tiles.
Looking for more?
We’ve created a satellite map fairly quickly here with POIs and road networks clearly visible, but if you’re looking for more to reference, we’ve got you covered.
Check out this blog on incorporating even more map layers to learn a little more about our other map styles and what you can display with other maps.
If you want to refer to a more basic how-to on setting up your vector map for the first time, take a look here.
For more questions on this blog or on our new satellite imagery, message us in our Dev Forum or tag us on Twitter.
Happy mapping!