Halloween Fun with TomTom's Map Styler
) Ryan Peden
Ryan Peden
Most mapping apps use default map styling. The Map Styler tool for the new TomTom JavaScript Maps SDK for Web makes it easy to create totally custom style templates that you can apply to your maps. What better way to demonstrate than to walk you through the process of creating a custom Halloween theme.
Maps are great. With the proliferation of location-aware devices, apps that use location in some way have become an essential part of our lives.
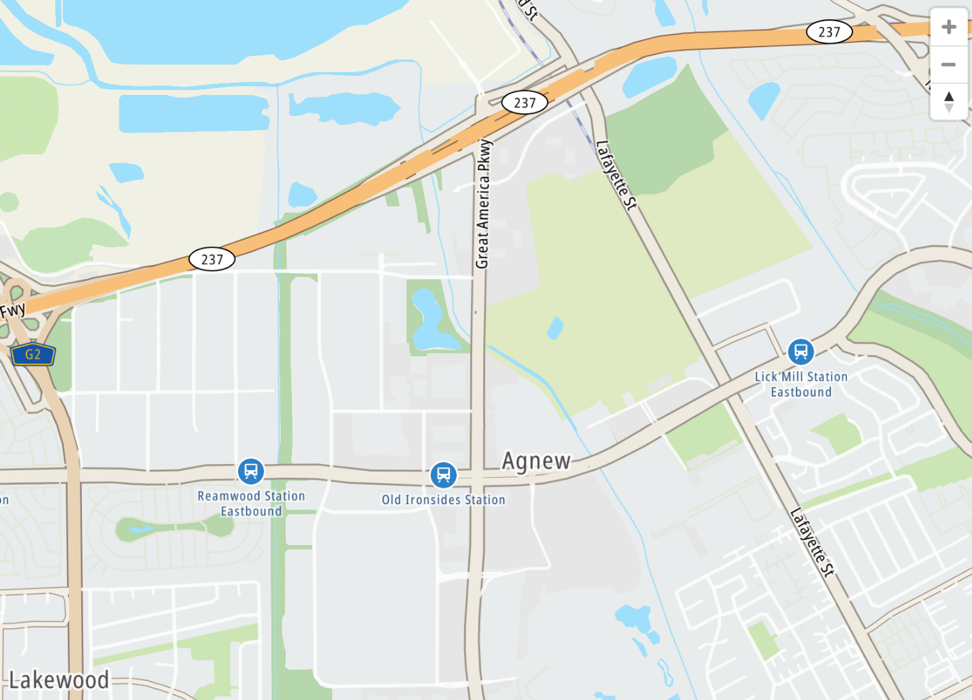
There is one catch, however. Most mapping apps use default map styling, which may or may not be easy to read. As you can see from the map below, this usually isn't a bad thing. The default style of TomTom's maps (shown below) is pretty standard:
But just wait 'til you get your hands on the TomTom Maps SDK (now in v6 public preview), which supports some amazing customization features. One feature, TomTom’s updated map customization tool, lets you customize your map visually – and you don’t need to be an expert coder to make some cool changes.
So, you can create truly unique maps with the Map Styler. What better way to explore these features than with a fun (and seasonally appropriate) Halloween map? Let’s see how you can use the customizer to maximize your map's spooky factor.
Let’s get started by creating a simple vector map. Rather than reinventing the wheel, you can follow the directions in the "Display a Vector Map Tutorial" to create a map.
Now that you have a map, let's jump over to the Map Styler tool. In keeping with the spirit of Halloween, I've decided to make my map’s landmasses black, the bodies of water blood red, and the roads pumpkin orange. These are just suggestions. Feel free to come up with your own fun and frightening (or festive) color combination!
Next, we'll learn how to apply the custom colors to our map. Fortunately, it's effortless. When you load the map customizer, you'll see a map of the world. I recommend zooming in because the colors of map layers can vary depending on the map's zoom level. Since we're creating a Halloween map of an urban area, I'm going to zoom in on a city before starting to make changes.
To create our Halloween map, we'll do two things: first, we’ll change the color of buildings to pumpkin orange. Then we’ll make rivers, lakes, and oceans blood-red instead of blue.
To edit a map feature, click on it. When you do, you’ll see a small pop-up telling you which layers are present at that location. If you click on the water near downtown San Francisco, for example, you’ll see the following:

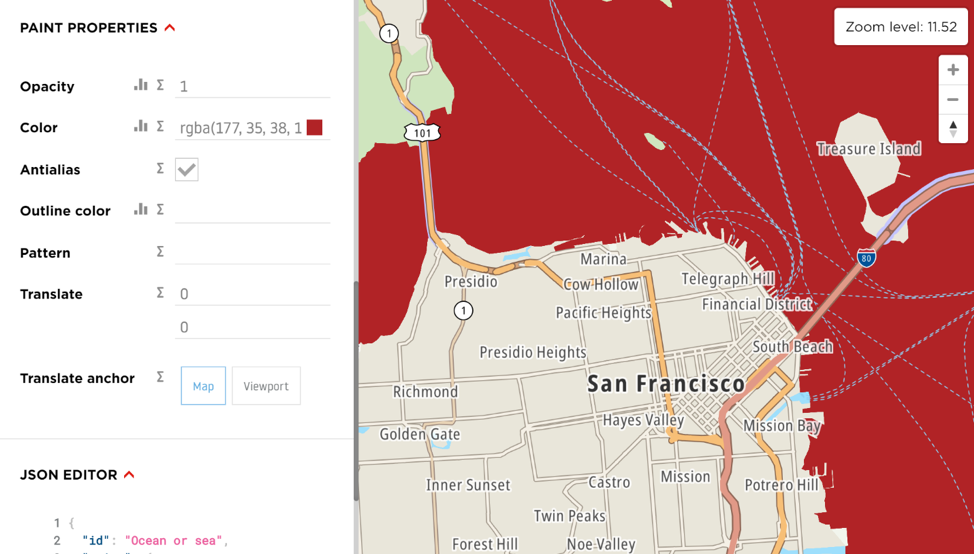
In terms of maps, water isn’t complicated, so there’s only one layer present. Click on “Ocean or sea” to see a properties panel containing editable properties for the ocean map layer. Scroll down to the Paint Properties header where you’ll find the colors you can edit:

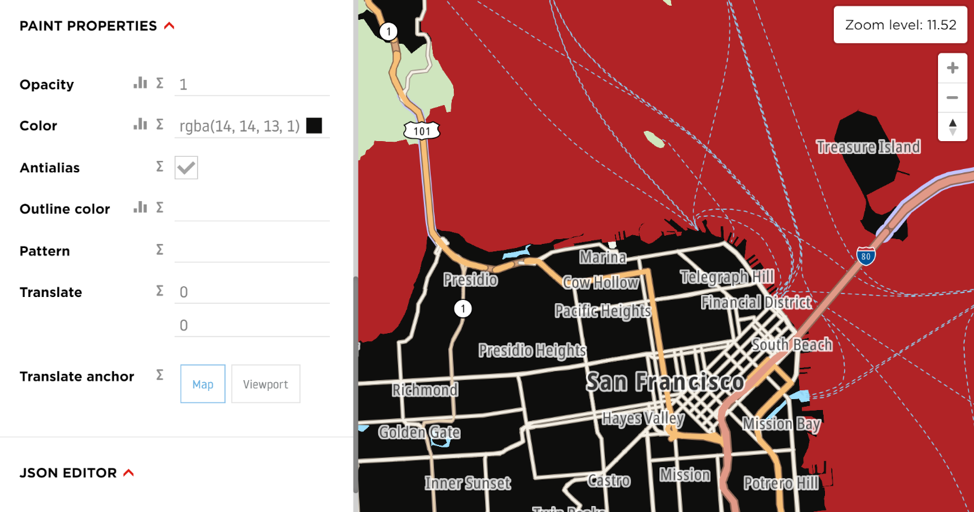
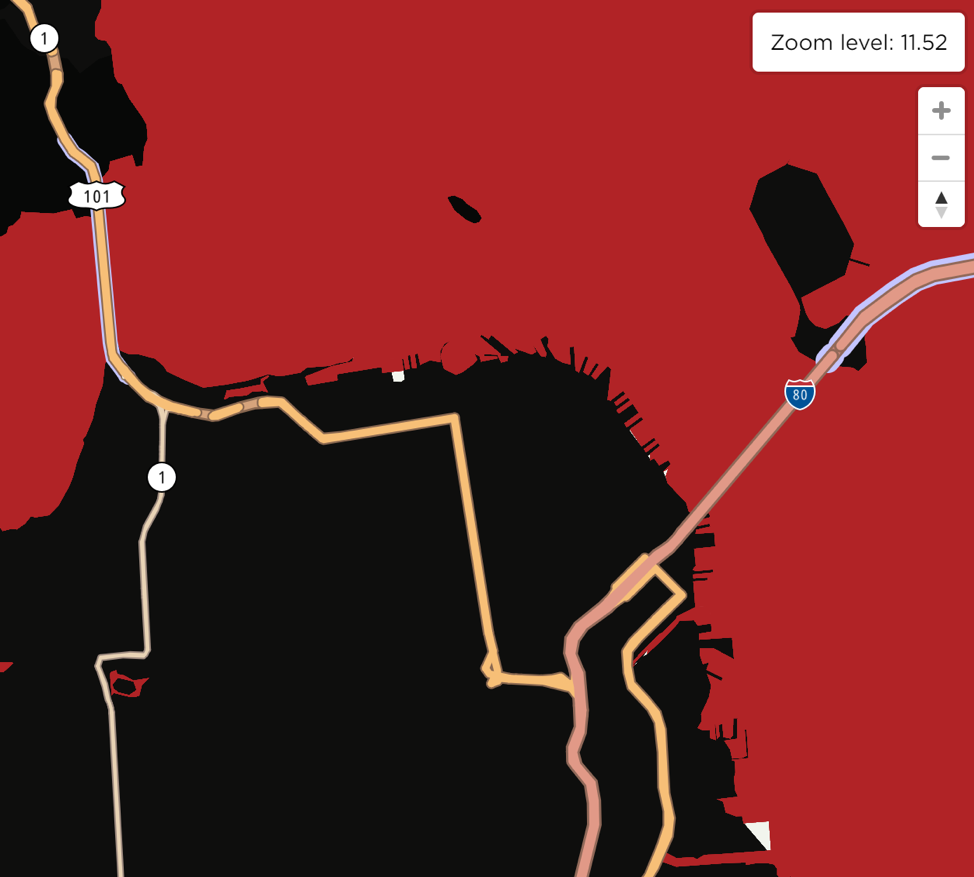
Wait a minute – why are there two different ocean colors? The ocean doesn’t look multi-colored on the map! The two numbers to the left of the color—in this case, 0 and 6—represent the map zoom level at or above which the color is applied. So here, the ocean appears in a slightly different color depending on the map’s zoom level. Since we always want our Halloween ocean to be blood red, let’s delete one of the stops and set the remaining one to a nice, deep red hue:
Spooky! Now, let's click on a built-up area so we can make all built-up areas black:
San Francisco is looking more ominous than it did a moment ago, but there’s still some green showing up to the north of the Golden Gate Bridge. If you click on it, you’ll see it’s a national park — part of the Golden Gate National Recreation Area. National and state parks, as well as other similar areas fall under their own color schema, so that users can still easily identify them. Here, we’re going to change it from park to dark to match our Halloween theme:
Now we're getting somewhere! We have a customized map style. Let's export that style from the customizer, then apply it to a map. To export it, click on “export” at the top left of the customizer window. When you do this, you will see your browser download a JSON file that we will use in a moment.
Finally, to make the map simpler (and spookier), you can hide place names, small roads, and ferry routes by setting their opacity to 0:
As you can see, the customization tool makes it easy to edit any visual property of your map.
Now that we have a customized map style, let’s add it to the map we created earlier. To add the style, we'll make a small modification to our map's initialization code:
var map = tt.map({
  key: "<Your API Key Goes Here>",
  container: "map",        //style: 'tomtom://vector/1/basic-main',
  style: "http://localhost:8080/main.json",
  center: [-122.419948, 37.779241],
  zoom: 11.5
});
Now our map uses the Halloween style we created in the customizer! (Note that I’ve added the style main.json to the root directory, and I’m loading it from the root directory that’s being served up by Node’s http-server. If you put the style in a different location, or you are using a different method of serving your HTML and JavaScript, your map’s style property may look different.)
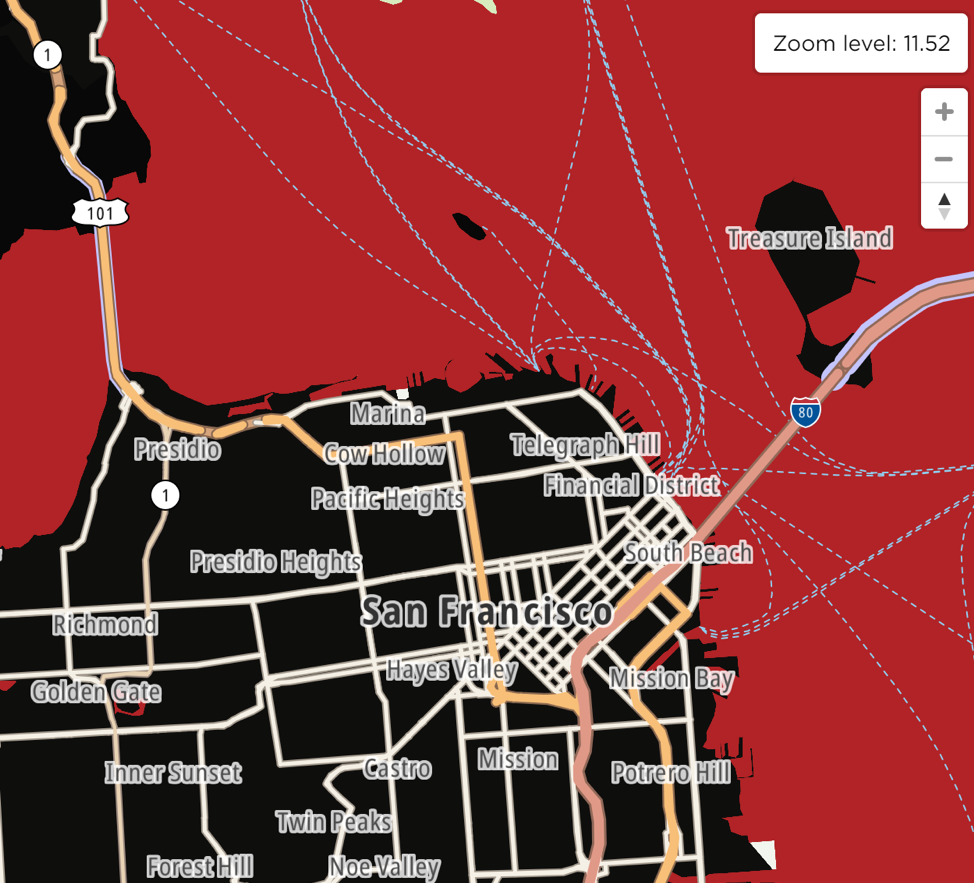
If we load our map in a browser, we’ll see this:
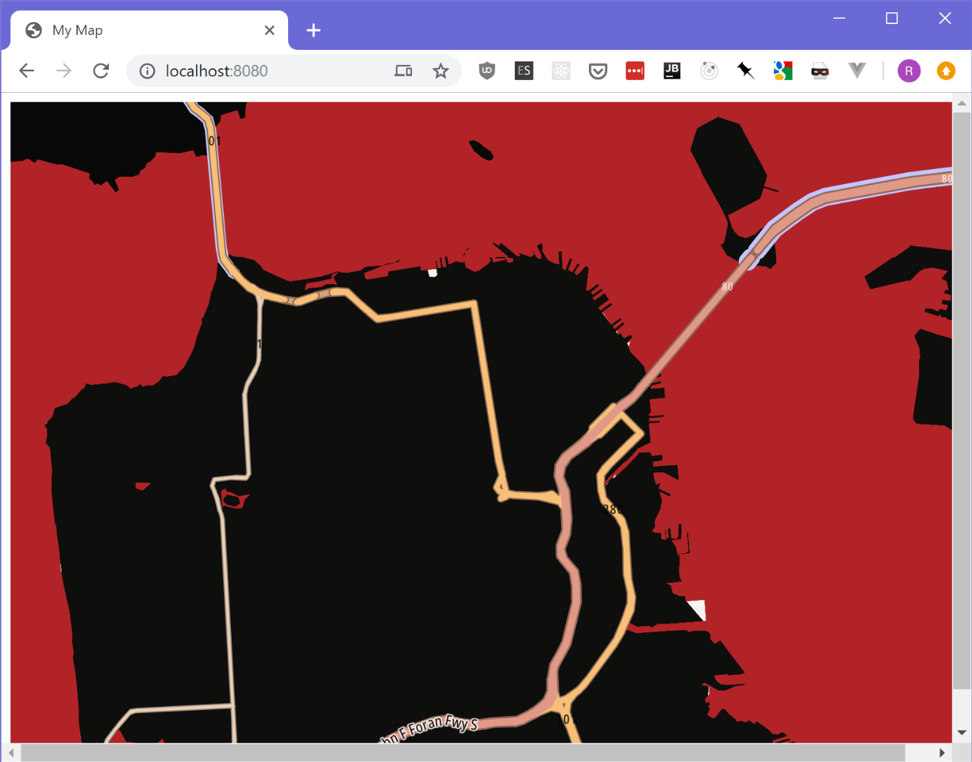
As you can see, the custom map style is working as expected.
Pumpkin Time!
So far, so good. We have a spooky-looking Halloween map, but it's not very exciting. As impressive as our map looks, when I think of Halloween, I think of pumpkins — and they’ll be added to the map next.
Fortunately, TomTom makes it easy to add custom markers to a map. Typically, a marker looks like this:

We’ll give our map more Halloween spirit using some public domain pumpkin vector art available here.
Assuming you followed the instructions in the map tutorial, you’re creating your map inside a script tag. After the pumpkin modifications, your script tag should look like this:
tt.setProductInfo("Halloween Map", "1.0");
var map = tt.map({
  key: "<Your API Key Goes Here>",
  container: "map",
  style: "http://localhost:8080/main.json",
  center: [-122.419948, 37.779241],
  zoom: 11.5
});

function getRandomCoordinate(min, max) {
  return Math.random() * (max - min) + min;
}

for(var p = 0; p < 20; p++) {
  var northWest = map.getBounds().getNorthWest();
  var southEast = map.getBounds().getSouthEast();

  var minLng = Math.min(northWest.lng, southEast.lng);
  var maxLng = Math.max(northWest.lng, southEast.lng);
  var minLat = Math.min(northWest.lat, southEast.lat);
  var maxLat = Math.max(northWest.lat, southEast.lat);

  var markerLng = getRandomCoordinate(minLng, maxLng);
  var markerLat = getRandomCoordinate(minLat, maxLat);

  var el = document.createElement("div");
  el.style.backgroundImage ="url(http://localhost:8080/pumpkin.svg)";
  el.style.width = "25px";
  el.style.height = "25px";
  el.style.backgroundRepeat = "no-repeat";
  el.addEventListener("click", function(e) {
    window.alert(`I'm a pumpkin at coordinates ${markerLng},${markerLat}!`);
  });

  // add marker to map
  new tt.Marker(el)
    .setLngLat([markerLng, markerLat])
    .addTo(map);
}
Let’s take a quick look at what’s happening.
First, we define a function named getRandomCoordinate that, as its name implies, generates a random map coordinate that falls between the minimum and maximum values passed into the function. We’ll need this so we can draw pumpkins at random locations across our map.
Next, we have a loop that adds 20 pumpkins to our map. To start, we ask the map for its northwest and southeast boundaries and then determine the minimum and maximum latitudes and longitudes.
Knowing these values helps us ensure we draw all of our pumpkins inside the visible portion of the map.
Once we know the map’s boundaries, we call getRandomCoordinate twice to generate coordinates for our pumpkin.
After that, we use the DOM API to create a new element for our custom pumpkin marker. We won’t do anything fancy here — just create a div element, set its width and height, and set its background image to use our pumpkin SVG. We also add a click handler that causes each pumpkin to announce its location.
Finally, we’ll add our custom marker to the map. We accomplish this using the same tt.Marker constructor we would use to create a regular marker — except in this case, we pass our custom element as an argument to the constructor. That’s all it takes to add a custom marker to a TomTom map!

That’s one spooky map!
Trick or Treat
With very little custom code, we’ve been able to create a custom Halloween map! And while having fun along the way, we also learned how the use the Map Styler and add custom markers to our map.
These features are useful far beyond Halloween maps. Map customization can add serious business value to mapping applications, and TomTom’s tools make customization simple.
And we’re just getting started! You could add more fun features to your maps, like cats that meow when clicked, and ghosts that move. Since the latest release of the TomTom JavaScript Maps SDK for Web is based on WebGL, you can add WebGL and canvas effects to spice up your map even further.
What spooky features can you come up with for your Halloween map? Create something fun, then share it with us on Twitter!