Creating Geofences with GeoJSON to Define Virtual Borders
)
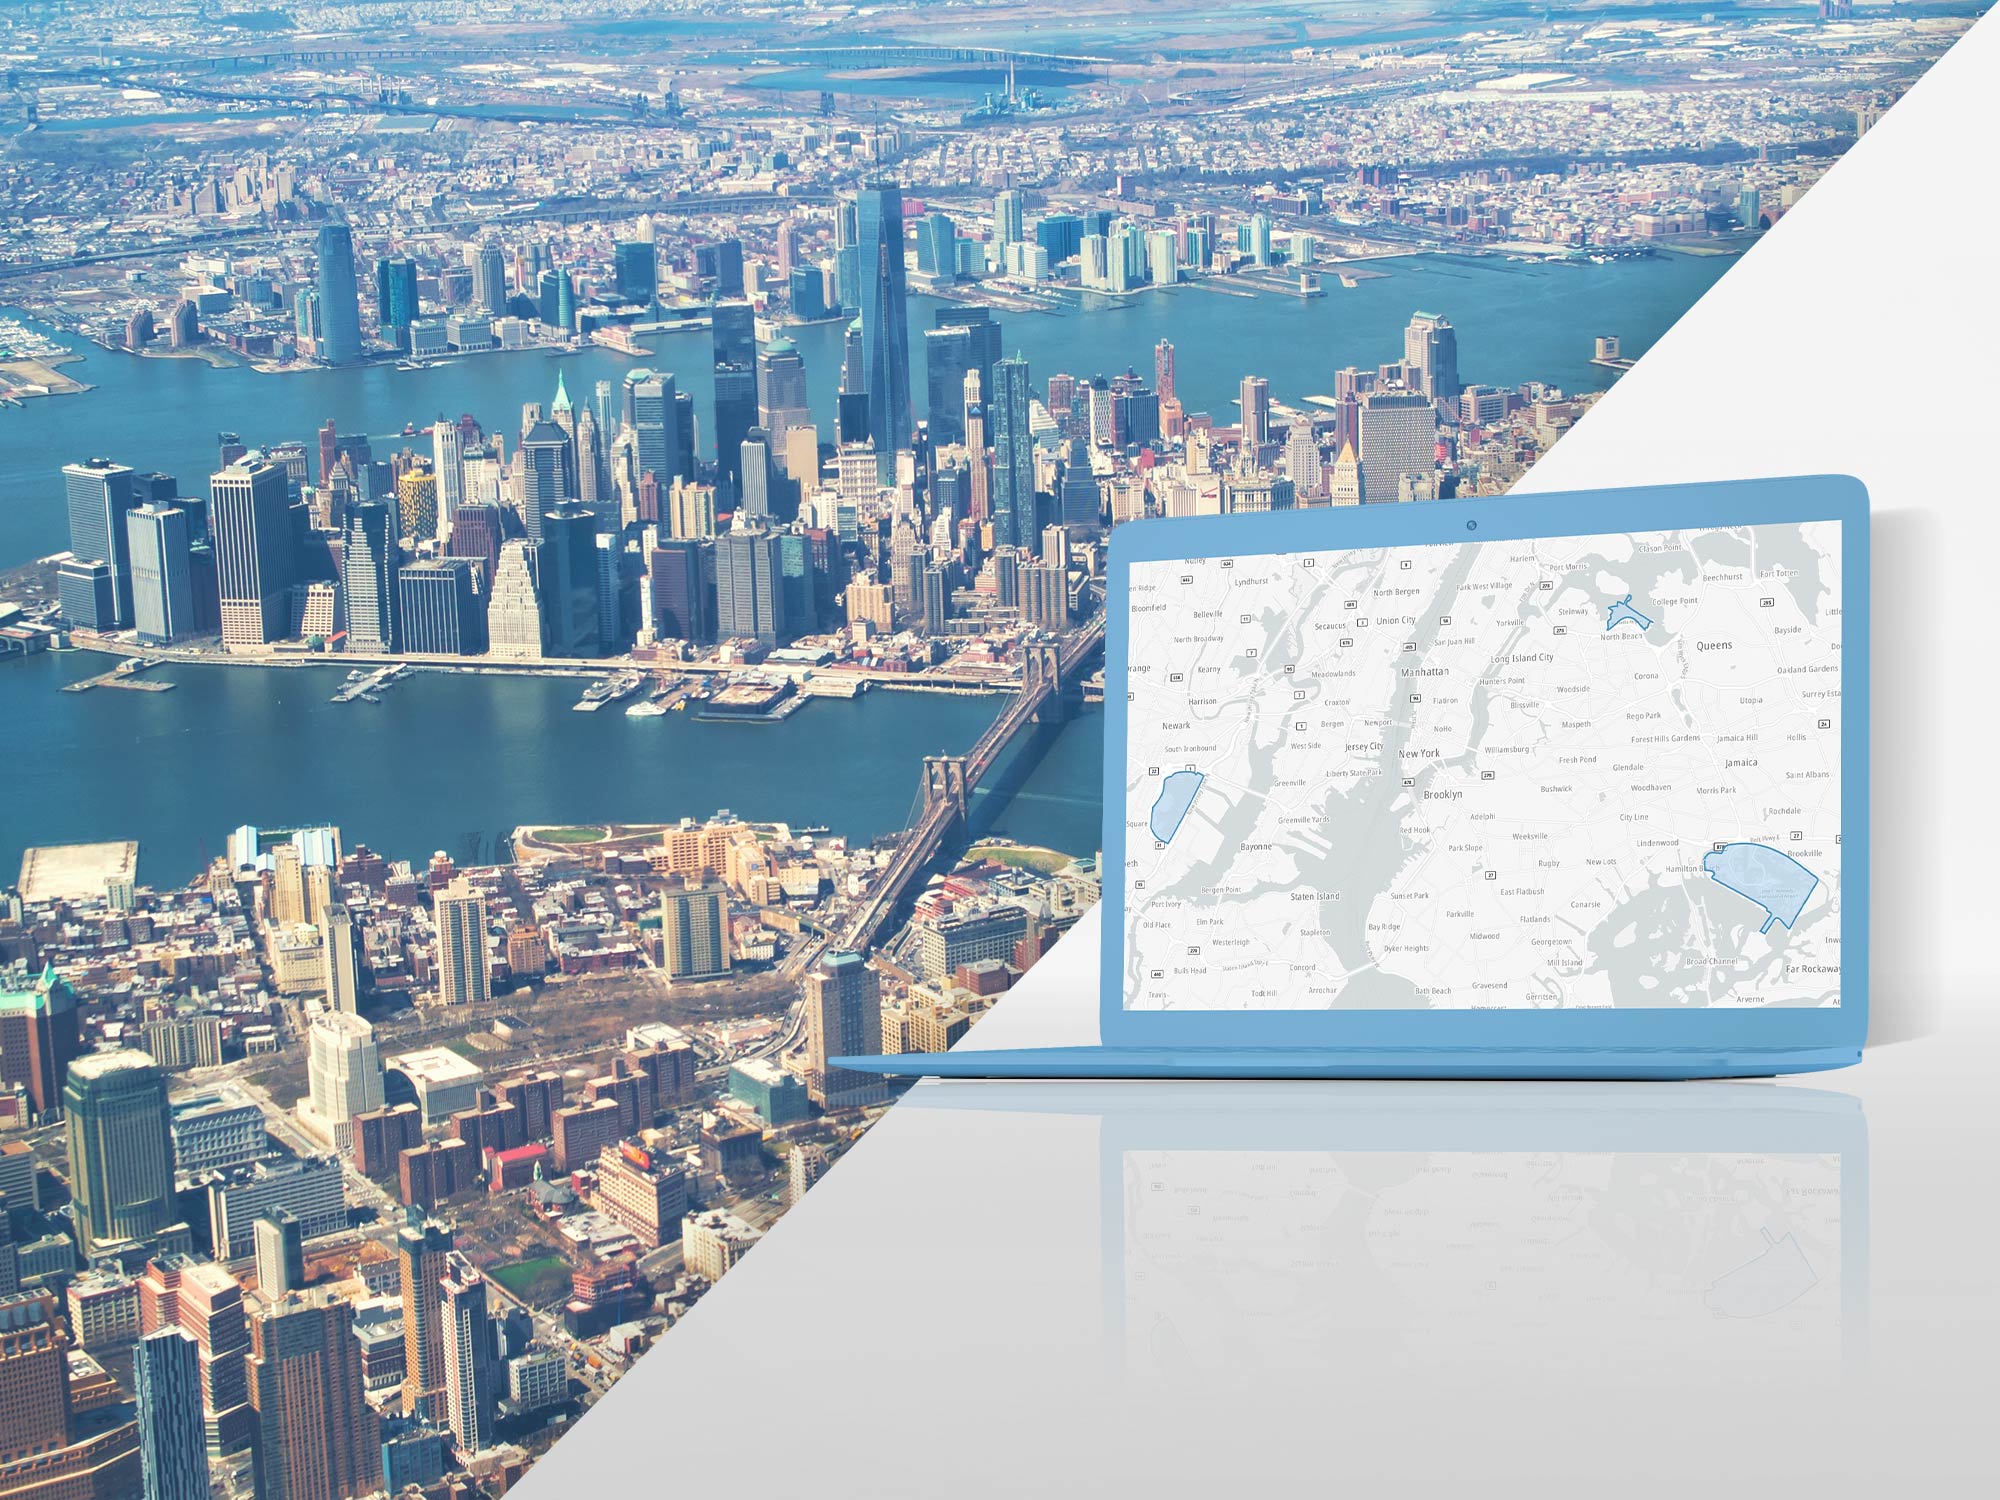
When it comes to keeping track of people’s locations to provide accurate and efficient service, nothing beats geofences. Learn how to draw a geofence on a React app map then check if a user is within its border.
When it comes to keeping track of people’s locations to provide accurate and efficient service, nothing beats geofences. In short, geofences are virtual borders around specified areas of interest.
One of the most efficient ways to create these geofences is with TomTom Maps JavaScript SDK. With it, you can draw perimeters on the map to highlight specific states, landmarks, locations, and even entire countries. These borders help determine when a map user is inside or outside the area, or simply nearby. TomTom’s mapping technology can also alert you when the user’s device crosses the border.
Geofences are vastly helpful in many areas. Examples include tracking packages, directing users to the nearest store, helping hikers stay within park borders, and much more.
Today, let’s explore how to set up a geofence on a TomTom map.
To get started, use TomTom to set up a regular map on a website. Then, use the map.addLayer property to collect the area’s coordinates in the GeoJSON format and draw the perimeter. This will produce a visible geofence that connects the given coordinates, forming the enclosed region. And now with our geofence in place, we can determine a user’s location in relation to the bordered territory.
To properly follow this tutorial, you need to know some JavaScript and HTML.
And if you are unfamiliar with GeoJSON, check out our introductory article here.
Now, let’s walk through how to use the TomTom SDK and APIs.
Setting Up
We use React to implement this application.
First, ensure you have Node.js installed on your computer. If you haven’t built a React app before, you can check if you have Node.js installed by typing the following command into your terminal:
node -vIf not, just go to the Node.js website to download the latest version.
Once you verify Node.js is in place, you can get started with our React app by running this command:
npx create-react-app tomtom-geofencingThen, navigate into the project folder on the terminal:
cd tomtom-geofencingAnd now you can launch the new app using this command:
npm run startInstalling the TomTom Library
Next, install TomTom Maps SDK to view the map on the Document Object Model (DOM) by running this command:
npm i @tomtom-international/web-sdk-mapsTo use TomTom services in your app, you need to register as a developer. When you register, you get access to thousands of free requests daily, you can also apply these for commercial use. Then when your app becomes popular, you can simply pay as you grow.
Please note that you’ll get an API Key when you sign up for your TomTom developer account. Take note of this key, because you'll need it later in the tutorial.
Creating the Map
Now that you’ve set up your React app and downloaded all necessary libraries, the next step is to set up your TomTom map to display properly on the page.
Open App.js and ensure you’re importing all the libraries you need, like this:
import "./styles.css";
import "@tomtom-international/web-sdk-maps/dist/maps.css";
import * as ttmaps from "@tomtom-international/web-sdk-maps";
import { useState, useEffect, useRef } from "react";
In the first line of code above, import your styles from the external file style.css. This file contains the CSS styles this project requires. One specific thing to note is to use .mapDiv to determine your map’s height.
.App {
  font-family: sans-serif;
  text-align: center;
}

button {
  margin: 2rem 0;
}
.mapDiv {
  height: 40rem;
}
Import TomTom’s default CSS styles for the map. Then, import the map library itself and rename it ttmaps.
Finally, import your react hooks: useState, useEffect, and useRef. These can be used to consistently handle and easily manipulate project variables.
Now, go into your App function and declare your variables using our React hooks:
const mapElement = useRef();
 const [mapZoom, setMapZoom] = useState(7);
 const [map, setMap] = useState({});
mapElement acts as the map’s container. Use useRef to attach it directly to the DOM. mapZoom allows you to set your map’s default zoom value as 7, and you can change the zoom value using setMapZoom.
Use map when initiating and changing the TomTom map in your application.
Next, use useEffect to initiate your maps with the map library you imported earlier (ttmaps.map.)
useEffect(() => {
    let map = ttmaps.map({
      key: "<Your-API-key>",
      container: mapElement.current,
      center: [ 12.3, 32.992578 ],
      zoom: mapZoom
    });
    setMap(map);
    return () => map.remove();
  }, []);
The ttmaps.map methods accept parameters like the API key.
container describes what will hold the map on the DOM, and in this case, it’s the mapElement that we defined earlier.
center defines the default coordinates the map displays on load.
And zoom determines the map’s default zoom, using the already defined mapZoom.
Drawing the Polygon
Next, outline the location you want to fence (in our example, we’re using the continental United States) on your map using GeoJSON. Then, add a button to your page to trigger a function called draw. Use ref={mapElement} to add the map inside the div and .mapDiv to add the CSS styles.
Note: You can find similar geojson and coordinates of countries on Datahub, then download geojson data to implement within your other projects.
return (
<div className="App">
<button
onClick={(e) => {
draw();
}}
>
Draw America
</button>
<div ref={mapElement} className="mapDiv"></div>
</div>
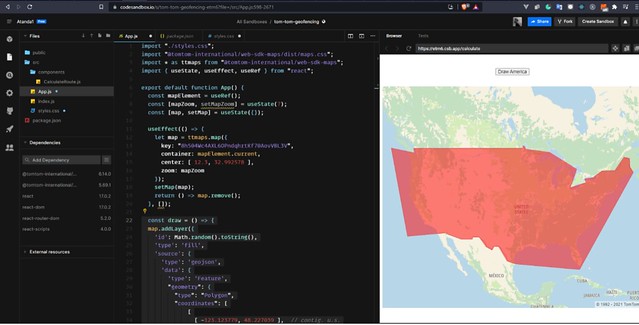
);Within the draw function, use the map.addLayer method to draw the area on the map. Then add parameters like id, type, and source that contain the geojson.
Inside the source, define the type as geojson and draw the geometry as a polygon. Finally, add the coordinates of the contiguous United States borders. Paint describes the color and opacity.
const draw = () => {
  map.addLayer({
    'id': Math.random().toString(),
    'type': 'fill',
    'source': {
      'type': 'geojson',
      'data': {
        'type': 'Feature',
        "geometry": {
          "type": "Polygon",
          "coordinates": [
              [
                [ -123.123779, 48.227039 ],  // contig. u.s.
                [ -123.318787, 49.000042 ],
                [ -121.742592, 49.000267 ],
                [ -95.157394, 49.000493 ],
                [ -95.157394, 49.390418 ],
                [ -94.795532, 49.357334 ],
                [ -94.482422, 48.857487 ],
                [ -88.36853, 48.314255 ],
                [ -84.126389, 46.531937 ],
                [ -81.331787, 45.344424 ],
                [ -83.034668, 41.910453 ],
                [ -79.013672, 42.867912 ],
                [ -79.299316, 43.590338 ],
                [ -77.305298, 43.761176 ],
                [ -74.849854, 45.058001 ],
                [ -71.586914, 45.1123 ],
                [ -69.213867, 47.480088 ],
                [ -67.758179, 47.271775 ],
                [ -67.719727, 45.813486 ],
                [ -66.780396, 44.785734],
                [ -80.628662, 24.417142 ],
                [ -97.058716, 25.730633 ],
                [ -99.283447, 26.382028 ],
                [ -101.480713, 29.678508 ],
                [ -102.612305, 29.716681 ],
                [ -103.117676, 28.88316 ],
                [ -104.699707, 29.649869 ],
                [ -106.44104, 31.737511 ],
                [ -108.187866, 31.760867 ],
                [ -108.193359, 31.325487 ],
                [ -111.08551, 31.325487 ],
                [ -114.930725, 32.521342 ],
                [ -114.724731, 32.711044 ],
                [ -124.892578, 31.952453 ],
                [ -129.067383, 49.047486 ],
                [ -123.123779, 48.227039 ]
              ]
          ]
      }
      }
    },
    'layout': {},
    'paint': {
      'fill-color': '#ff0000',
      'fill-opacity': 0.5
    }
  })
  map.setCenter([parseFloat(-123.123779), parseFloat(48.227039  )]);
  };
Building Geofences
The geofencing service enables you to draw a virtual boundary. Applications can then use this virtual boundary to handle business logic.
You can also create a dynamic fence around a geographical area using coordinates, similar to earlier. And this time, you can also check the marked-out site dynamically in addition to drawing shapes. For instance, using a particular location’s latitude or longitude, you can check if it's within the marked-out area.
To do this, first get an Admin Key. It’s part of the credentials to complete API requests. Then, use Postman to send a POST request to TomTom’s API to register your Admin key (see below). This request includes a body with a secret phase. We are using "my_secret_key” for this example.
{
  "secret": "my_secret_key"
}
We’re also using our API key as a parameter, so it’s all tied to one account.
https://api.tomtom.com/geofencing/1/register?key=Your_API_Key
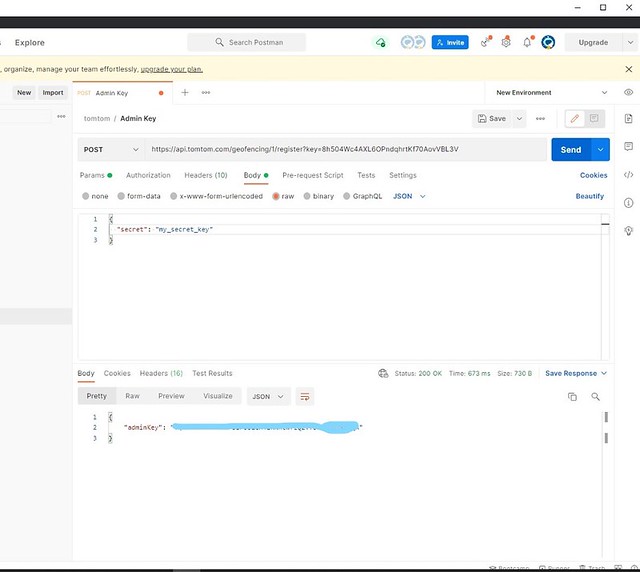
The response we get back contains our adminKey.
Creating a New Project
Now that you have a new key, you can create a project that relates to the geofence you drew.
To do this, send another POST request to register the new project:
https://api.tomtom.com/geofencing/1/projects/project?key=${apiKey}&adminKey=${adminKey}
Send it with the project name as the body:
{
  "name": "United States Map"
}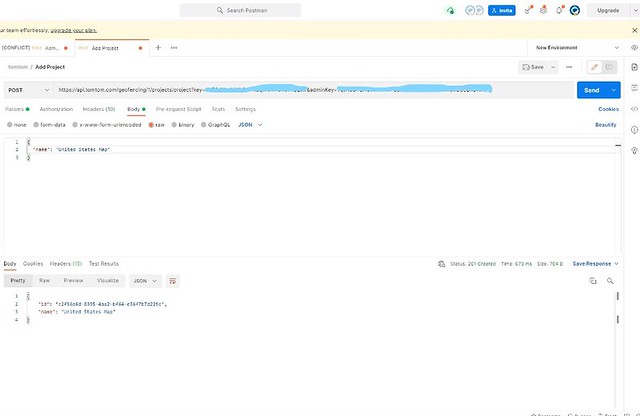
The response contains the project name and ID.
Creating the Geofence
To create a geofence using the necessary coordinates, first you need to send a POST request to:
https://api.tomtom.com/geofencing/1/projects/${projectId}/fence?key=${apiKey}&adminKey=${adminKey}

This request contains this body:

{
  "name": "Our location",
  "type": "Feature",
  "geometry": {
    "radius": 75,
    "type": "Point",
    "shapeType": "Circle",
    "coordinates": [-123.123779, 48.227039]
  }
}
The code above contains the exact details to create a fence around an area. Here, you have your location’s latitude and longitude. Then, create a geofence (a circle) around this location with a radius of 75 (in meters). The response will record and reiterate the request.
Requesting the Report
The TomTom Geofencing Report service can determine if a certain point (latitude and latitude) is within or outside the geofence you've previously created. It takes a certain point’s latitude and longitude and your project ID. The response shows whether the point is inside or outside the fences. Plus, it includes the specific distance between the location and the fence.
https://api.tomtom.com/geofencing/1/report/${productId}?key=${apiKey}&adminKey=${adminKey}&point=${lat,lng}
The response looks like this:
{
    "summary": {
        "project": "c2f56e6d-8395-4aa2-bf64-e36f7b7d229c",
        "type": "Point",
        "coordinates": [
            41.670966,
            2.750529,
            0.0
        ],
        "range": 0.0
    },
    "inside": {
        "type": "FeatureCollection",
        "features":     },
    "outside": {
        "type": "FeatureCollection",
        "features": [
            {
                "id": "0c803717-b862-4548-ab47-20bf544b2d84",
                "name": "New location",
                "distance": 3298398.0,
                "type": "Feature",
                "geometry": {
                    "type": "Point",
                    "coordinates": [
                        12.138017,
                        6.137388
                    ]
                },
                "properties": {
                    "maxSpeedKmh": 70
                }
            }
        ]
    }
}
The request takes the point (41.670966, 2.750529) as a parameter with the product ID (c2f56e6d-8395-4aa2-bf64-e36f7b7d229c). In this case, it shows us that the point is outside the fence with a distance of 3,298,398.0 meters.
These services enable you to add certain business logic and use cases to your applications. For instance, you can determine if a particular restaurant delivers to the user’s current location or if the user is walking near a specific store and should receive a marketing offer.
You can access this tutorial’s demo on CodeSandbox.
Next Steps
In this article, we discussed how to set up our React application and install TomTom maps. We learned how to initialize and display the map on load within our React component. Then, we used the addLayer method that comes right out of the box with TomTom to draw borders with geojson in a polygon shape. And finally, we explored geofencing and how to use the TomTom Geofencing Report service, and how to handle virtual boundaries dynamically.
Now that you know how to add geofences around places on your maps, you can use them to enhance your applications. You can alert your users when they enter or leave a designated area, help them find the nearest store or restaurant for their needs, pick up rideshare passengers within their approved zone, and so much more.
With thousands of free daily requests (even for commercial use) and flexible payment to accommodate your growth, TomTom is here to support you. Sign up to experiment with the TomTom JavaScript SDK today.