Adding OpenWeatherMap's Current Weather to TomTom Maps
)
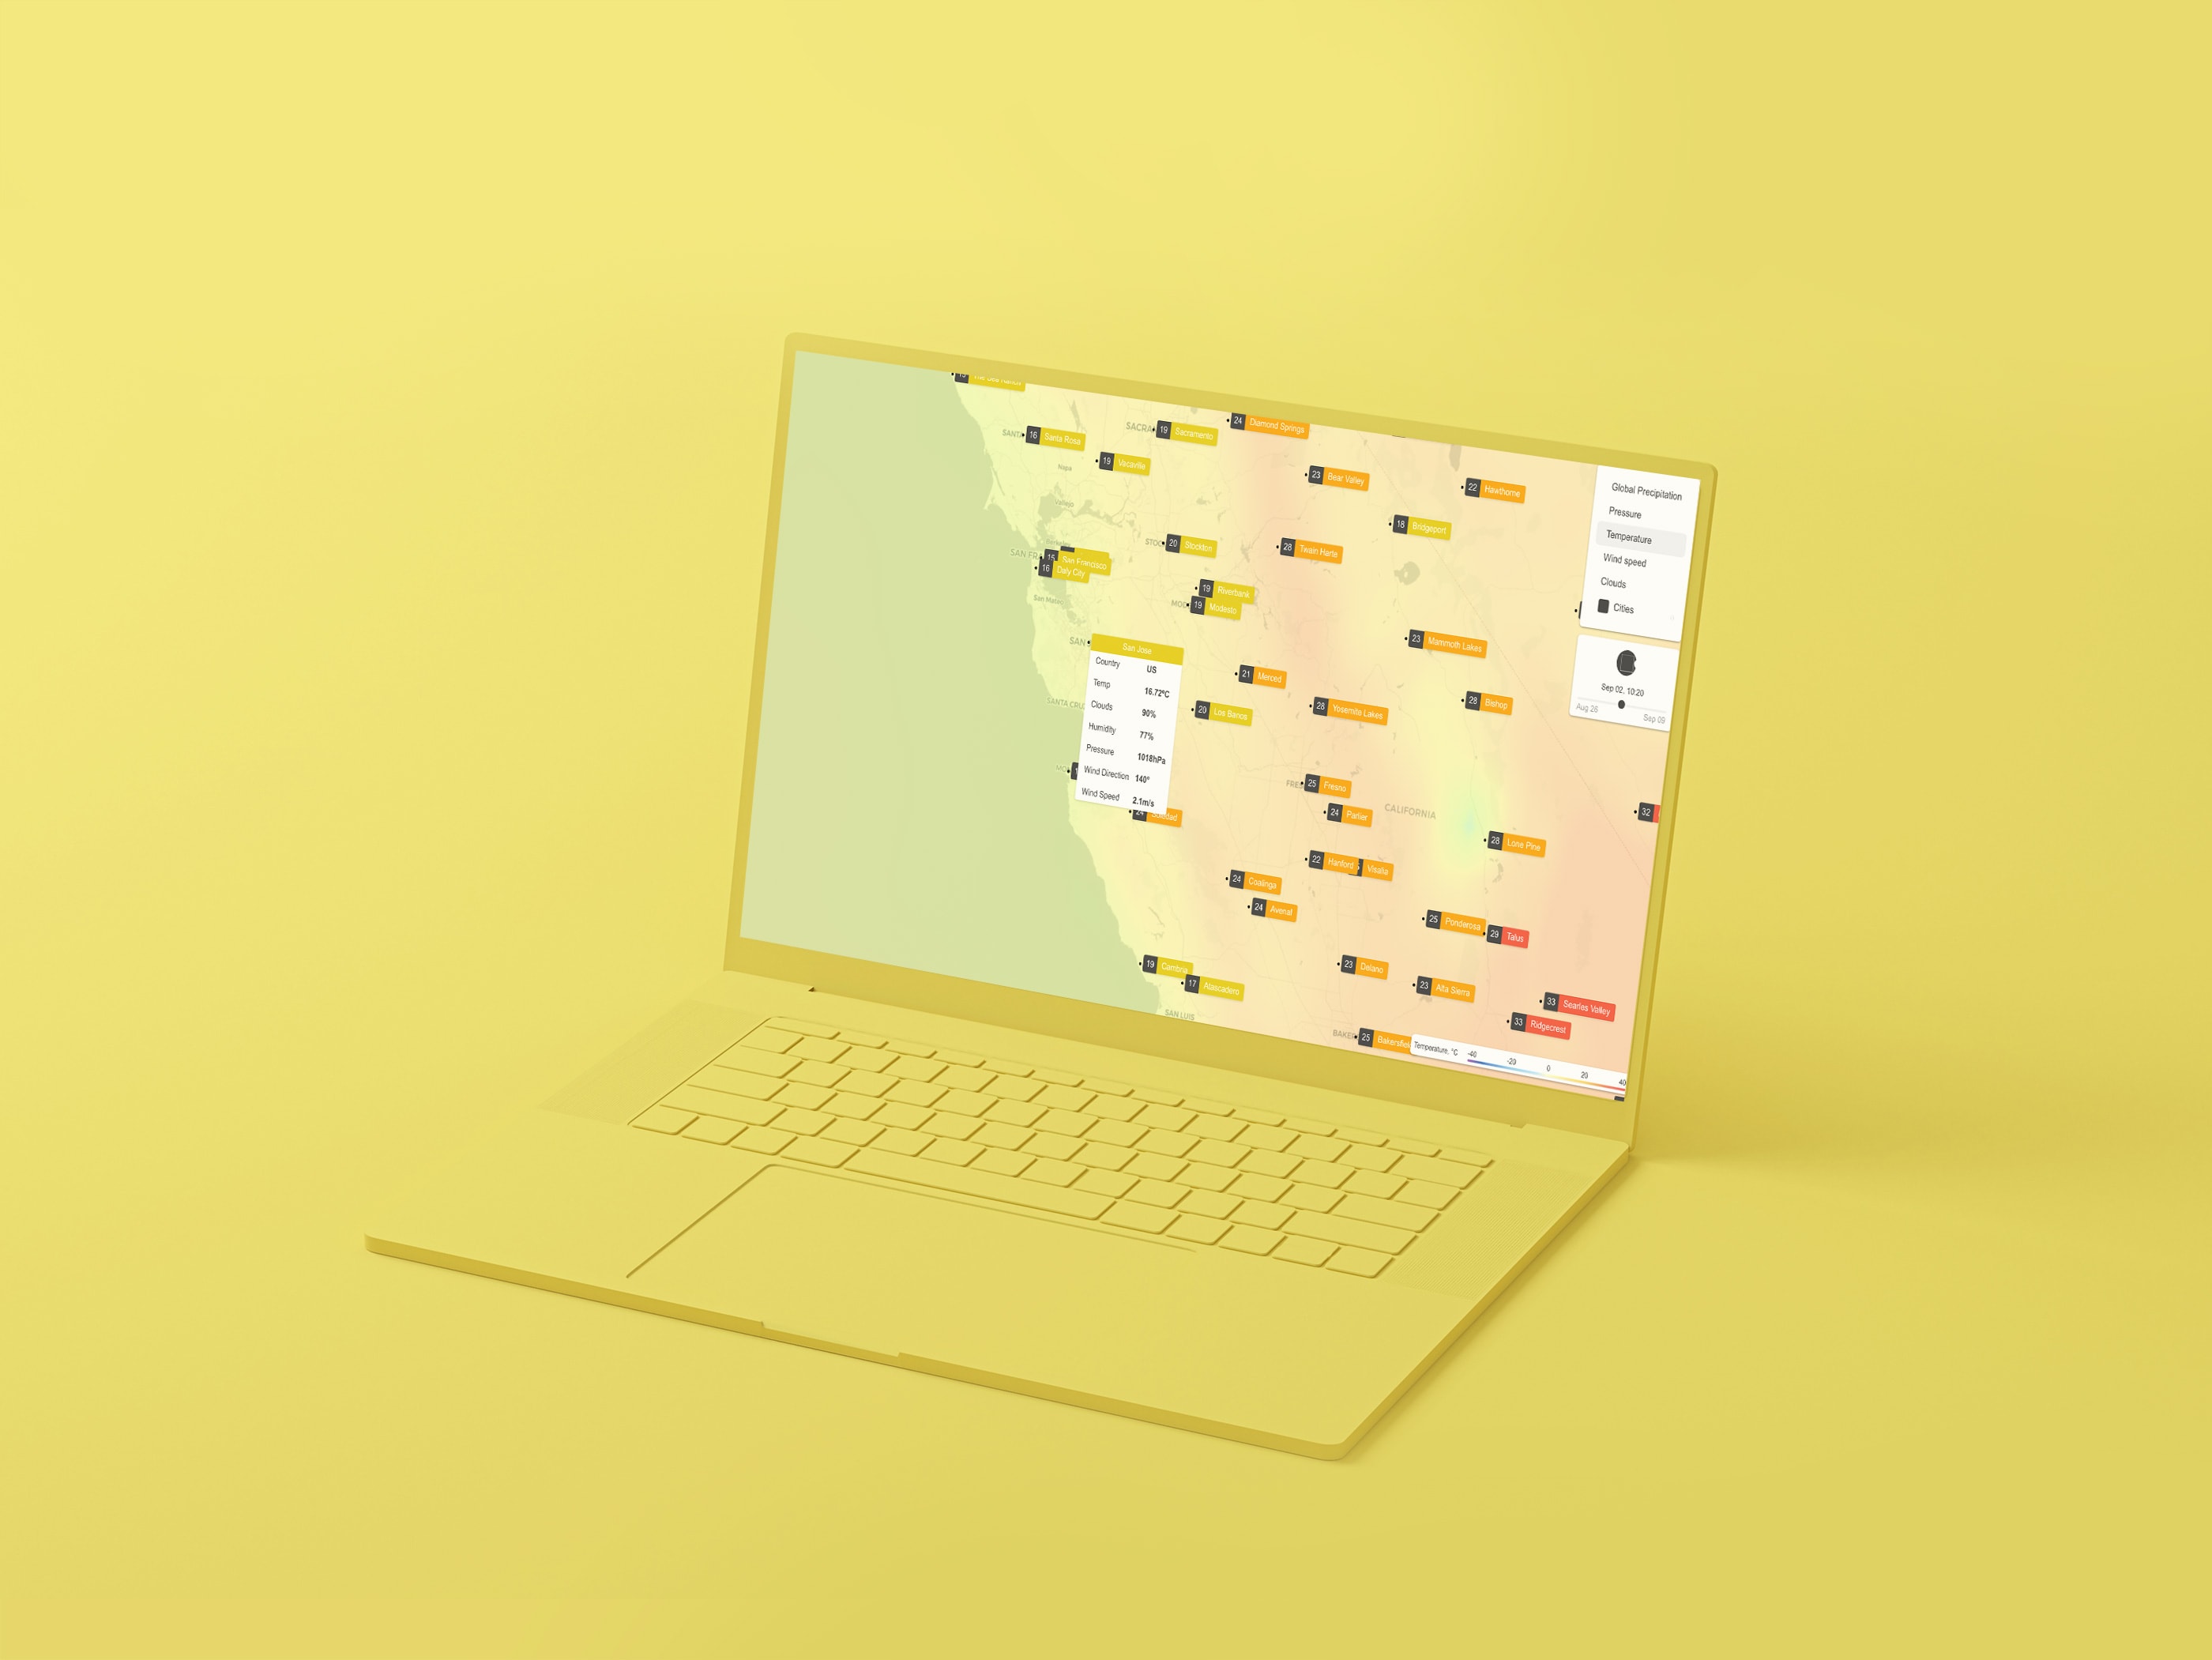
The TomTom Maps SDK lets you build apps that provide excellent, up-to-date map, routing, and navigation information. It's also really easy to layer third-party data on TomTom maps to build apps that go beyond simple maps and routes. For example, we can combine a map with current weather data and visual map tiles from the OpenWeatherMap API to build an interesting project that is valuable to drivers on the road.
Drivers who are aware of current weather conditions along their route can plan more carefully and drive more safely. TomTom provides excellent, up-to-date map and navigation information. Combining this with current weather information from the OpenWeatherMap API can help us build an interesting project that is valuable to drivers on the road as we head into fall and winter, too.
In this article, we’ll briefly explore each of the following items:
Using TomTom’s Maps SDK for Web to find a location and display a map of it.
The standards and practices that allow TomTom to integrate other vendor’s maps with their own.
Using the OpenWeatherMap API to get live weather maps and textual descriptions for a location.
Overlaying OpenWeatherMap’s maps onto TomTom’s maps.
We’ll accomplish this by describing a simple JavaScript application that demonstrates all of these concepts. The complete source for the application can be downloaded here.
This article assumes experience with basic CSS, HTML, and JavaScript. For the code to work properly, you must edit the weather.js file described later. Change the text “YOUR_API_KEY” to your actual TomTom API key from your development account, and the text “YOUR_APP_ID” to the actual OpenWeatherMap application ID.
Map Tile Providers
One challenge vendors of geographical information face is integrating visual information from other vendors into their own service. A number of standards and practices simplify this integration. In web applications, the most common visual projection is called Web Mercator (or EPSG 3857). This is a coordinate reference system (CRS) shared by many vendors including TomTom and OpenWeatherMap.
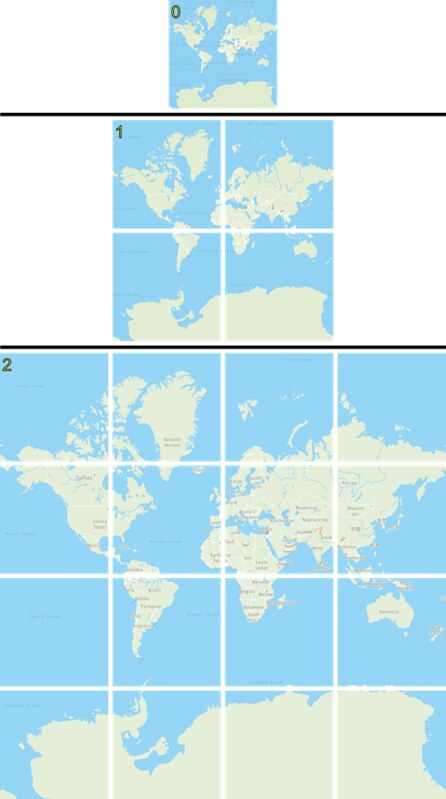
It is also common practice for vendors, including TomTom and OpenWeatherMap, to implement a tiling and zooming mechanism. In a tiling system, the map is divided into equal-sized tiles. In this system, to request a specific tile, you need three parameters: zoom level (z), x-coordinate (x), and y-coordinate (y). See the article Understanding Map Tile Grids and Zoom Levels for a deeper discussion.
The following picture illustrates how tiles evolve as the zoom level increases:
TomTom Maps SDK for Web
TomTom makes it easy to use mapping and navigation information by providing an extensive JavaScript SDK for web developers. To use this service, a developer must first do the following:
Register for a TomTom account at https://developer.tomtom.com/member/register
Sign in to that account at https://developer.tomtom.com/user/login
Request an evaluation API key at https://developer.tomtom.com/apps/myapps
Including Necessary Files
For a web application, we can include the necessary SDK files through a link reference to the CDN distribution of the SDK. This is accomplished by adding the following lines within the HTML HEAD element:
<link rel="stylesheet" type="text/css" href="https://api.tomtom.com/maps-sdk-for-web/cdn/5.x/5.36.1/maps/maps.css">
<script src="https://api.tomtom.com/maps-sdk-for-web/cdn/5.x/5.36.1/maps/maps-web.min.js"></script>
<script src="https://api.tomtom.com/maps-sdk-for-web/cdn/5.x/5.36.1/services/services-web.min.js"></script>
We also implement a simple SDK for accessing the OpenWeatherMap API. To include this local file in the application, add the following line in the same location:
<script src="currentWeatherData.js"></script>Initializing the Application
In our JavaScript, the first step when using the SDK is to identify the application and its version, using the following code. This information helps TomTom to collect usage statistics.
tt.setProductInfo(applicationName, applicationVersion);Next, we create a map by providing our API key and associating that map with the HTML DIV element used to display it.
const tomTomMap;
tomTomMap = tt.map({ key: tomTomApiKey, container: htmlDivId });
If available, we could also provide additional parameters to center and zoom the map to a specific location. However, in our application, we’ll start with a map of the entire Earth.
Searching for a Location
To search for a location, we use TomTom’s Fuzzy Search service as follows:
tt.services.fuzzySearch({ key: tomTomApikey, query: queryText })
  .go()
  .then(centerAndZoom)
  .catch(function(error) {
     alert('Could not find location (' + queryText + '). ' + error.message);
});
Within the centerAndZoom function (referenced above), we center the map on the first location found (the best match) and set an appropriate zoom level as follows:
function centerAndZoom(response) {
  tomTomMap.flyTo({ center: response.results[0].position, zoom: zoomLevel });
}
Adding Layers
It is possible to superimpose multiple layers of information onto a single TomTom map. Each of these layers has a source. Some of these layers may come from TomTom itself. Others may come from vendors like OpenWeatherMap.
In our application, we use OpenWeatherMap as a source (tile provider) for one such layer. For example, to overlay a cloud map, we add a source to the map as follows:
tomTomMap.addSource('owm_source', {
  type: 'raster',
  tiles: [
    'https://tile.openweathermap.org/map/clouds_new/{z}/{x}/{y}.png?appid=YOUR_APP_ID'
  ],
  tileSize: 256,
  minZoom: 0,
  maxZoom: 12,
  attribution: openWeatherMapAttribution
});
Note that we’ve provided a unique identifier for the source: owm_source. The value is not important as long as it is unique. We can later use this same identifier when adding layers or when we want to remove this source.
Both the size of the tiles and the number of zoom levels that are supported are dependent on the vendor. Here, we’ve indicated that the tiles are 256x256 pixels in size and that the vendor zoom levels range from 0 through 12 (inclusive). We’ve also provided an attribution for the vendor.
Finally, we’ve provided a format for the URL. This format includes placeholders for the zoom level (z), the x-coordinate of the tile (x), and the y-coordinate of the tile (y). When the Maps SDK makes web requests on our behalf, it replaces those placeholders with actual values.
Once we’ve created a source for the layer, we need to associate it with a layer and add that layer to the map. We do this with the following code:
tomTomMap.addLayer({
  'id': 'owm_layer',
  'type': 'raster',
  'source': 'owm_source',
  'layout': { 'visibility': 'visible' }
});
Note that we’ve provided a unique identifier for the layer (owm_layer). Again, the chosen value is not important as long as it is unique. We can later use this identifier when we want to remove the layer.
We’ve indicated the type of source (raster) and provided the identity of the source created earlier (owm_source). This associates the source with the layer. We’ve also indicated that we want the layer to be visible.
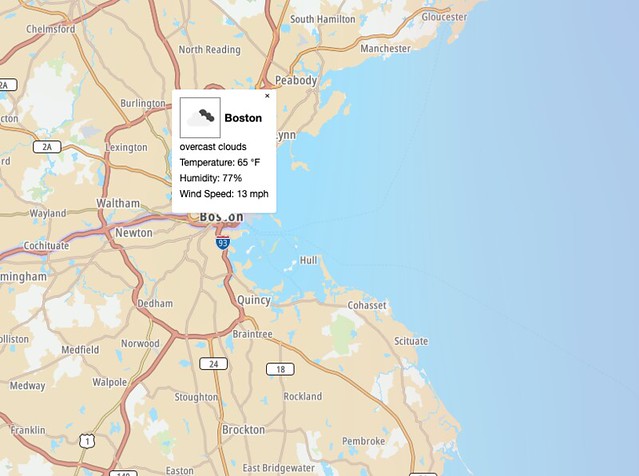
Pop Ups
In our application, we display a pop-up with text describing the weather conditions at a given location. This is implemented with the following code:
var popup;
popup = new tt.Popup({ maxWidth: 'none' })
  .setLngLat(location)
  .setDOMContent(htmlFragment)
  .addTo(tomTomMap);
We specify that there is no maximum width so that our text won’t be unnecessarily wrapped. We also indicate the latitude and longitude where the pop-up should be displayed. Additionally, we provide an HTML fragment (typically a DIV element) that contains the content for the pop-up. Finally, we add the pop-up that we’ve created to the map.
We retain the pop-up in a variable in case we want to later remove it from the map.
OpenWeatherMap API
OpenWeatherMap provides a variety of weather information to application developers via an easy-to-use API. The company provides both free content and, for a fee, premium content.

To use this service, first obtain an application ID by signing up for an account at the following location: https://home.openweathermap.org/users/sign_up. For details on using the OpenWeatherMap API and app ID, see their "How to start in 3 simple steps" tutorial.
In our sample application, we will rely on free content. With free content, the application is limited to 60 web requests per minute. With TomTom maps, if the scroll wheel is used to rapidly change the zoom level multiple times, this can result in this limit being exceeded. If this occurs, the OpenWeatherMap account is temporarily blocked from further requests and an error is displayed.
Current Weather Data
OpenWeatherMap’s Current weather data service allows developers to make a simple web request to obtain textual descriptions of current weather conditions for a specific location. The URL for the web request specifies the latitude and longitude of a location, units of measure, and the application ID.
For example, the following web request would obtain current weather conditions for the San Francisco area (latitude: 37.7749, longitude: -122.4194), using imperial units (Fahrenheit):
https://api.openweathermap.org/data/2.5/weather?lat=37.7749&lon=-122.4194&units=imperial&appid=YOUR_APP_IDThe JSON response would appear similar to the following:
{
  "coord": {
    "lon": -122.42,
    "lat": 37.77
  },
  "weather": [
    {
      "id": 500,
      "main": "Rain",
      "description": "light rain",
      "icon": "10d"
    }
  ],
  "base": "stations",
  "main": {
    "temp": 50.02,
    "pressure": 1019,
    "humidity": 59,
    "temp_min": 41,
    "temp_max": 62.6
  },
  "visibility": 16093,
  "wind": {
    "speed": 6.93,
    "deg": 50
  },
  "rain": { "1h": 0.25 },
  "clouds": { "all": 1 },
  "dt": 1574006215,
  "sys": {
    "type": 1,
    "id": 4322,
    "country": "US",
    "sunrise": 1574002323,
    "sunset": 1574038650
  },
  "timezone": -28800,
  "id": 5391959,
  "name": "San Francisco",
  "cod": 200
}
Our application will provide a simple SDK function (currentWeatherData) to issue this web request and parse the resulting JSON. Using our previous example, the call to this function would appear as follows:
currentWeatherData( {
  appid: appId,
  lat: 37.7749,
  lon: -122.4194,
  units: 'imperial'
})
.go()
.then(function(response) {
    console.log(response.weather[0].description);
})
.catch(function(error) {
  console.log(error);
});
Weather Maps 1.0
OpenWeatherMap’s Weather maps 1.0 service allows developers to make a simple web request to obtain free maps depicting the following conditions: clouds, precipitation, air pressure, temperature, and wind, which can prove helpful to drivers in this application.
The format of the URL used to request an image in PNG format is as follows:
https://tile.openweathermap.org/map/layer/z/x/y.png?appid=appidThe parameters that appear in the URL are described below:
| Parameter | Description | | layer | This specifies the layer that is requested. It can be any of the following values: cloud_new, precipitation_new, pressure_new, wind_new, or temp_new. | | z | This specifies the zoom level for the requested tile. The value can range from 0 through 12. | | x | This specifies the x-coordinate of the requested tile. The value can range from 0 through the maximum x-coordinate for the specified zoom level (2^z - 1). | | y | This specifies the y-coordinate of the requested tile. The value can range from 0 through the maximum y-coordinate for the specified zoom level (2^z - 1). | | appid | The OpenWeatherMap application identifier. |
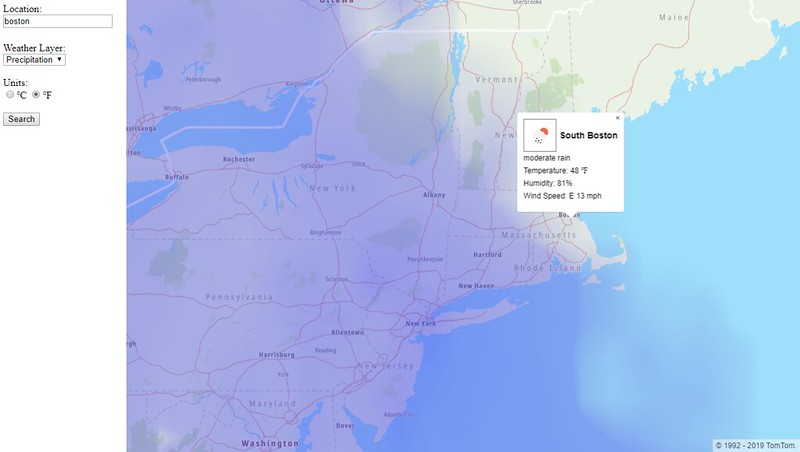
Sample Application
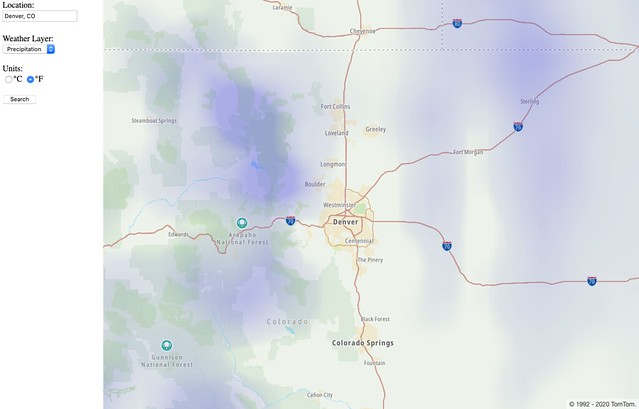
In our sample application, we’ll allow the user to select a location, the layer to display (such as Clouds), and units of measure. The application will display a map based upon these selections. If the user clicks a location on the map, a pop up will be displayed that describes current weather conditions for that location.
The application consists of the following three files:
| File Name | Description | | weather.html | This is the main HTML for the application. It provides user interface elements and includes the necessary CSS and JavaScript files. | | weather.js | This is the main JavaScript for the application. It provides all of the logic for user interaction and map display. | | currentWeatherData.js | This JavaScript provides an SDK wrapper for OpenWeatherMap’s current weather data service. |
The user interaction logic is as follows:
When the application first starts, the init function is called. This function sets the TomTom application name/version, creates the initial map, and establishes a handler for the map’s click event.
When the user clicks the “Search” button, the findLocation function is called. This function will find the location indicated in the “Location” text box and center/zoom the map to that location.
When the user changes the “Weather Layer” selection, the updateLayer function is called. This function will change the OpenWeatherMap layer that is overlaid on the TomTom map.
When the user changes the “Units” selection, the updateUnits function is called. This function will dismiss any current popup and change the units (imperial or metric) used in any subsequent popup.
When the user clicks the map, the getCurrentWeatherData function is called. This function gets the current weather data, formats it, and displays a popup.
Next Steps
With very little code, we were able to create a responsive application that enhanced a basic TomTom map using the Maps SDK for Web and current weather information from OpenWeatherMap.
The additional information we displayed was from the free services offered by OpenWeatherMap. For a fee, OpenWeatherMap also provides premium services that offer more extensive information and allow for higher request rates.
That said, we successfully proved that building a powerful project can be done by taking advantage of free usage tiers from reputable resources in the developer community, who also power larger scale endeavors — and that the project itself is really quite approachable.
Don't miss our developer advocates Jose Jose Rojas and Olivia Vahsen's video tutorial below!
YouTube video playerLastly, don't forget to check our our Developer Forum for any questions you may have, or to share your project with the community.
Happy mapping!