TomTom’s Geopolitical Views: Culturally Sensitive Map Development
)
Areas with disputed borders, regions, and other inter- or intra- national conflicts have a difficult time appealing to both worldwide developers and those local to the issues themselves. Some mapping services enforce views based on the user’s location, but with TomTom, you can customize the views displayed on your website’s map to fit your user’s needs best.
What you need to get started
While this article talks about cultural topics, it also shows you how to implement geopolitical view features into a TomTom web map. To do that, you’ll need to be able to use our SDK for Web and set up a basic vector map.
For this how-to, we'll be utilizing CDN as described in this vector map tutorial.
Aren't borders just borders?
In a slice of the online location services community, a conversation about map displays and disputed borders has been brewing for quite some time, opening the door for a greater thought about what it means to collect, develop and publish the world’s mapping information.
At TomTom, it stands to reason that developers should be able to decide for themselves which view they use during development when taking disputed areas into account, which isn’t as common of a feature as you might think. Taking this problem into consideration, I’ll be illustrating the importance of culturally-sensitive mapping, and how you can do it with TomTom – wherever you are.
To a computer system, borders are just political lines that represent the passage into different legislative areas, and essentially exist to inform the user that there are risks (small or large) involved when crossing an international boundary during their travels. However, to many cultures the world over, their lives have been majorly impacted by these “political lines”. The mapping service they pull up on their phone represents their country and means more than the digital equivalent of a road sign. Developers in these areas stand to lose credibility for any location-using application they build when the service they design for local users doesn’t measure up to the cultural boundaries known to the main audience of their product.
Google & Mapping Palestine
Earlier this year, the Washington Post compiled a very intriguing piece that shed light on how views have been shown to vary on Google Maps based on the location from which the user is reading the map. Notably mentioned toward the end of the piece is that Google reportedly “erased” Palestinian areas; in reality, search results still pointed toward Palestine, but it was seemingly not labeled to the extent of Israel and other neighboring nations for some viewers.
As of March 27th, 2020, the Google Maps result for a search of “Palestine” shows as such below in the top image. Below that, you’ll the same map with an alternate zoom level.


When zooming out by one factor, familiar Palestinian indications are viewable, still not to the bolded extend of greater Israel, though. If you look at the two maps adjacent to each other, you can see that there are marked differences in how Areas such as the Gaza Strip, The West Bank, and major Israeli cities are affected by zoom level. Now, let’s compare to TomTom views.
The TomTom View
Using the TomTom dual-view geopolitical example, you can see the following side by side comparison, which includes a view locally sensitive to Israeli mappers on the left, as well as a Unified View recognizing Palestine in an equally-weighted font design on the right.

Developing with culturally-sensitive maps
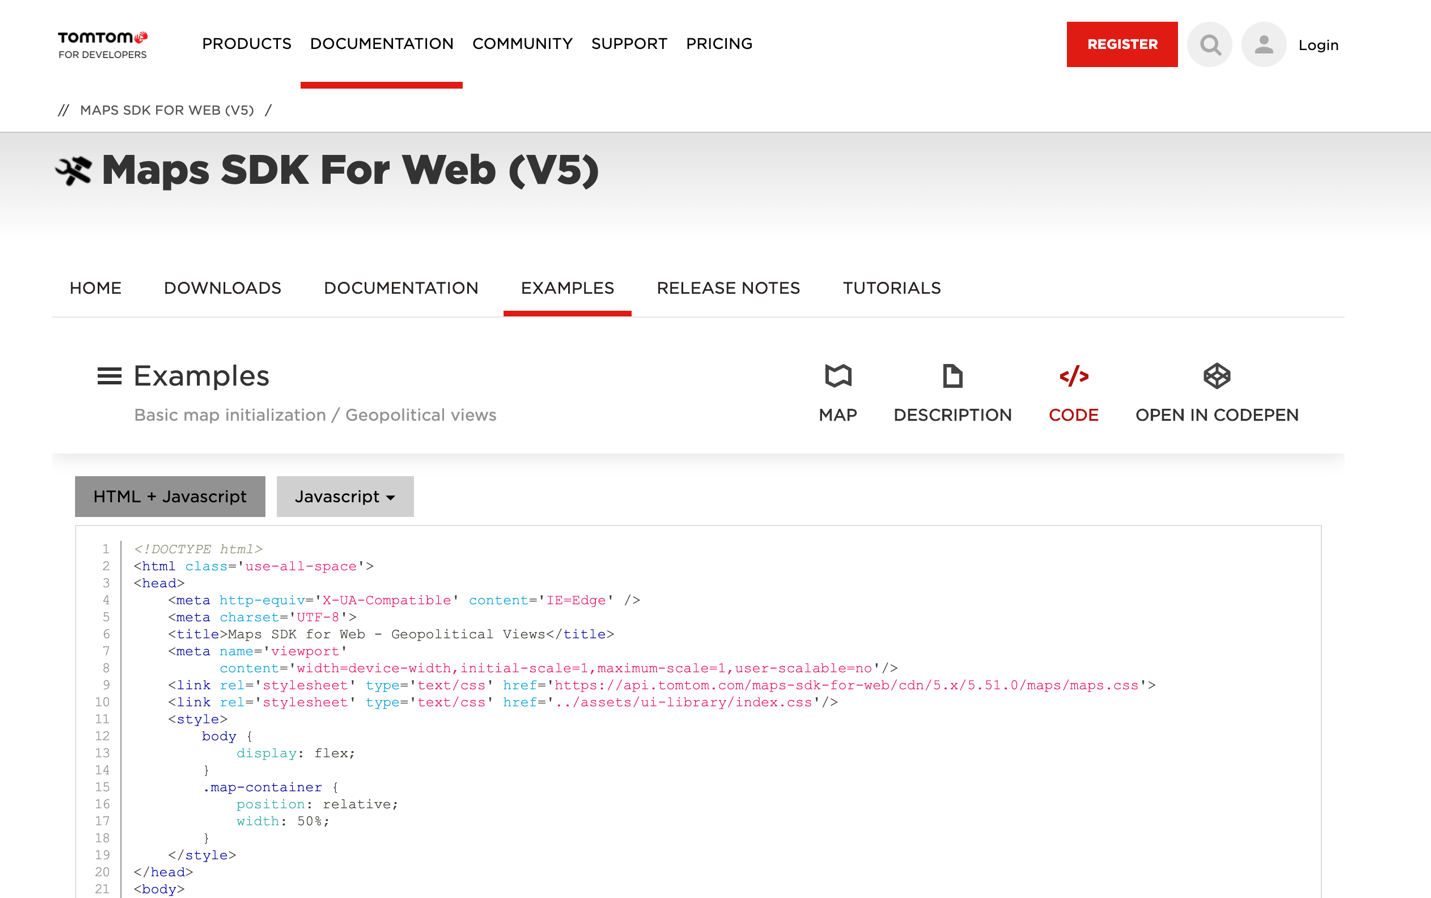
You can embed this dual-view suite that includes a selection of different geopolitical examples directly into your website, allowing you to toggle between Unified and local comparisons for not only Israel, but India, Morocco, Pakistan, Argentina, Russia, Turkey, and Arabic areas as well.
You can do this by toggling the code selection on the top right menu above the SDK example found here.

Toggling over to the code section gives you the ability to paste the code in full, either via highlighting the selections you want to use, or by using the copy to clipboard selection at the bottom.
Even easier is the option to play around with the different features in Codepen, shown at the very right of the menu bar as a selection, with the view below. Codepen does a great job of splitting HTML, CSS and JS in a beginner-friendly view, so that you can interact with components independent of each other visually and produce results that are easy for you to track.

Here, we can perform a few simple operations within a sandbox just to get a feel for how these code components work, but since this code doesn’t live within a greater project, like it might when I’m able to edit on my own machine, we’re a bit limited by what CodePen can perform.
Building the view on your own
On a technical scale, using a geopolitical view is essentially a singular purpose feature, changing nothing but the user’s view of a specific region. There is not a lot of outside functionality except for the specific use cases we outlined, but this also makes it very simple to implement.
The best way to begin this part is by following the instructions to get started using the latest version of the SDK for Web, V5, and accessing via CDN. You can do this via the “Display a Vector Map” tutorial. When you’re done, you can resume with the rest of this section.
We are going to borrow a few lines of code from the “Code” tab view shown both on the Geopolitical example on our website and on Codepen. If you’ve explored that, the following should look familiar:
<!DOCTYPE html>
<html>
    <head>
        <title>My map</title>
        <link rel='stylesheet' type='text/css' href='https://api.tomtom.com/maps-sdk-for-web/cdn/5.x/5.52.0/maps/maps.css'/>
        <script src='https://api.tomtom.com/maps-sdk-for-web/cdn/5.x/5.52.0/maps/maps-web.min.js'></script>
        <!-- <script type='text/javascript' src='../map/geopolitical-views.js'></script> -->
    </head>
    <body>
        <div id='map' style='height:100vh;width:100vw'></div>
        <script>
        // tomtom.setProductInfo('<your-product-name>', '<your-product-version>');

      var locationData = [
         {
            id: 'IN',
             center: [78, 24],
             zoom: 3
         },
         {
             id: 'IL',
             center: [34.8, 31],
             zoom: 7
         },
         {
             id: 'MA',
             center: [-6.356618, 31.880916],
             zoom: 3
         },
         {
             id: 'PA',
             center: [69.306735, 29.759973],
             zoom: 3
         },
         {
            id: 'AR',
             center: [-68.361007, -42.426041],
             zoom: 2
         },
         {
           id: 'Arabic',
             center: [51.744665, 25.790791],
             zoom: 5
         },
         {
            id: 'RU',
             center: [33.988533, 45.488992],
             zoom: 7
         },
         {
           id: 'TR',
             center: [33.254136, 35.115268],
             zoom: 7
         }
     ];

            tt.map( {
                key: 'YOUR-KEY',
                    container: 'map',
                    source: 'vector',
                    basePath: '/sdk',
                    language: 'en-US',
                    style: 'tomtom://vector/1/basic-main',
                    zoom: 8,
                    center: locationData[1].center,
                    geopoliticalView: locationData[1].id
        });
        // var mymap = tt.map('mapid').setView([51.505, -0.09], 13);
        // var marker = tt.marker([51.5, -0.09]).addTo(mymap);


        </script>


    </body>
</html>
And that’s actually all you need. I’ve highlighted a couple of lines, because these are the most important in determining which political view you interact with, and where your map centers when you launch it.
Setting the center and locationData index at [1] will use the view ‘IL’, aka Israel. This will give us the following:

This is the Israeli-specific view which shows Israel’s and Gaza’s names at different weights and styles of font, and at the current zoom does not indicate the West Bank. Bordering is easily seen between greater Israel and this area, indicated by the blue.
By changing geopoliticalView: locationData[1].id to geopoliticalView: locationData[2].id, we can implement a different geopiotical view (that of Morrocco); by leaving the center in Israel, we can now see the Unified map view. You will see the similar font weights appear for Palestine as in the images earlier in the article:

This shows us the difference between each unified view at a time and allows you greater freedom to change them around or incorporate as needed.
What does this all mean?
Creating an environment where users are able to experience locally-minded map views is well within your grasp as a developer. The geopolitical views example makes it easy to import code showing different border situations for main disputed territories across the world.
Establishing and implementing “Unified” maps is often a double-edged sword. Often, Unified maps are established with the well-intention of growing general knowledge of national boundary lines for travelers, students, and the rest of the public who might view maps of a given area for any reason. However, cultural-political situations change rapidly and involve issues deeper than font-size designations, dashed lines, and name placement.
Cultural tensions in places such as Israel and India already existed before many of the Western countries we know today; these conflicts aren’t new – and while they’ve evolved over time, for many of the people for whom they still have a real and present impact on, they’re not best represented by a temporary border line, a blank space, or a gap in a map.
Giving developers – digital mapmakers—the option to preserve the geopolitical views of the locality they look to map seeks to establish and preserve a new relationship between local cultures and the age of online mapping. This is an area that has recently been fraught with infighting and misunderstandings of the real purpose of making maps – to connect people to the places they wish to learn about.
If developers can have access to easy ways to integrate more than one view of one boundary, digital mapping can prove to have an open door for to a greater theme of what it means to develop ethically- and with a mind toward greater social empathy for communities around the world.
At the end of the day, developing with maps perhaps shouldn’t be about asking cultures to conform to a set of parameters to make mapping easier, but rather using the tools we have to best represent an area for the purposes of a project that serve and respect its community.