Using TomTom as a Basemap for CARTO Visualization
)
CARTO is a popular location intelligence platform which allows users to create map visualizations with an easy setup which doesn’t require background programming or cartographic knowledge. It harnesses data science functionality to let users select from popular data tables, or import their own. If you regularly create projects for web and/or mobile platforms with TomTom, you can use TomTom maps as a basemap within the CARTO platform itself to keep your projects and visualizations consistent.
The Use of a TomTom Basemap
CARTO is a flexible platform in the sense that it allows the user to create a wide variety of different appearances in their maps, most of which are built-in. Most popular presets fall under CARTO’s Voyager and other map categories, which can be political- or topography-focused, or simply artistic, but the custom basemap option allows us to create TomTom-based visualizations in a manner of a few seconds, while keeping all of our map-based development consistent to the same essential mapping layer.
This frees up example usage on a website or just for personal organization, so that you can recognize TomTom’s visual style for borders, natural areas and other land designations while exploring dataset layers. While we have many tutorials on using TomTom maps directly for dataset visualization, they can be difficult to use if you are a beginning developer for web or otherwise, and want a quick and simple way to see information come to life.
How to get started with CARTO

For our first steps, I’ll work under the impression that you’ve created a basic CARTO account to get started. When you sign in, you can scroll slightly down to see the section titled “Your CARTO Maps”. Here, I’ve created two maps already – one loaded with only a data-blank TomTom basemap, and one including the basemap and several data fields layered on top of it.
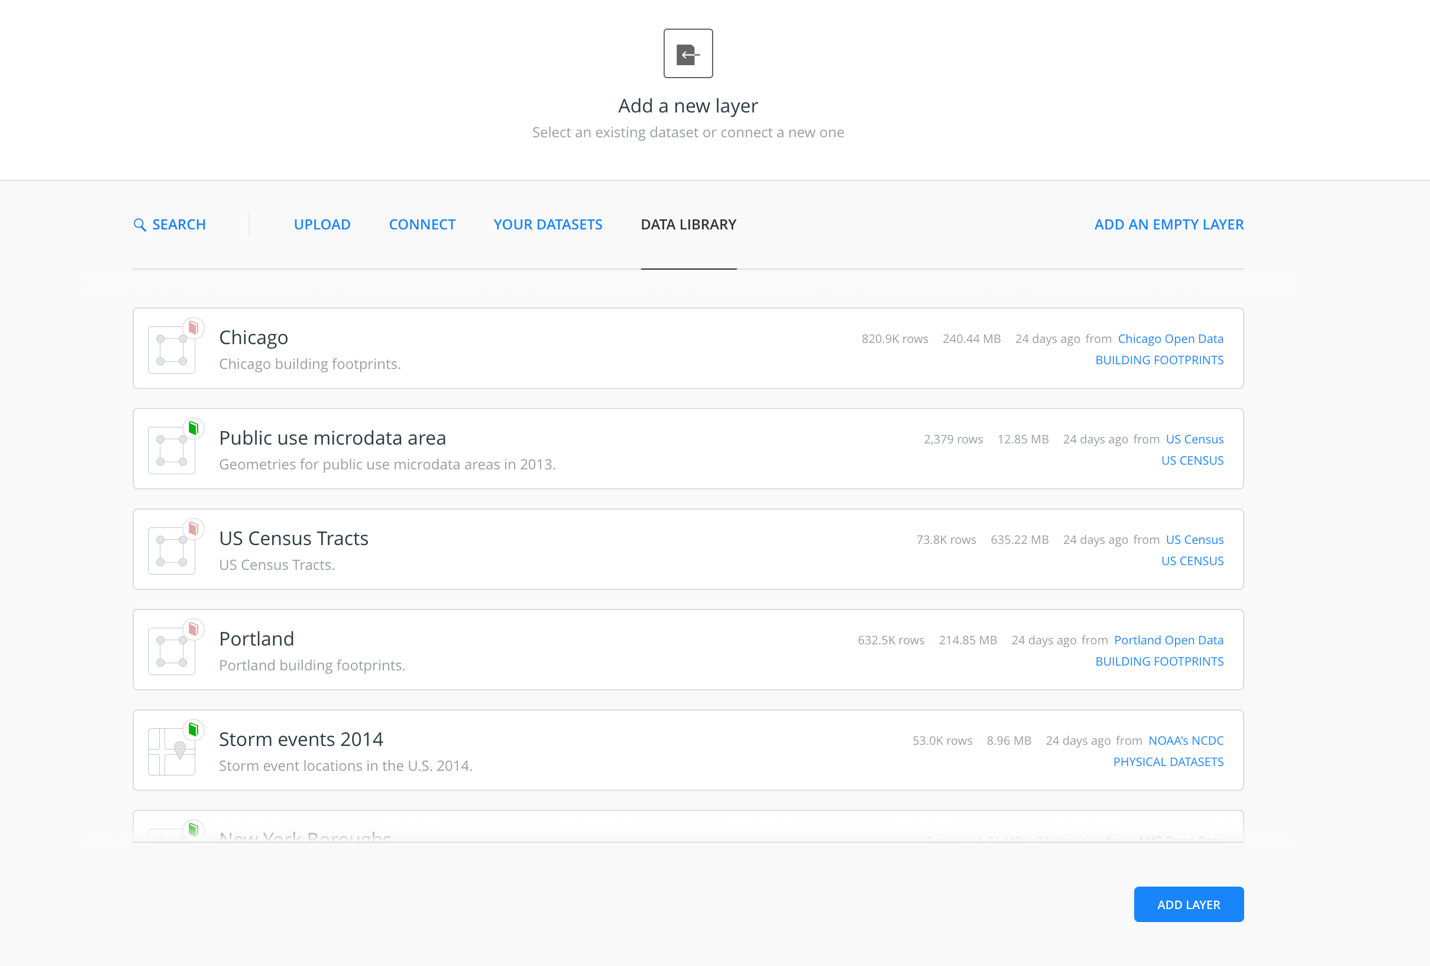
For the sake of this tutorial, I’ll be walking through how to create an entirely new map, assuming you’re new to the CARTO environment. You’ll start by clicking the “New Map” button in the top right of the page above, which will take you to the screen depicted on the next image.
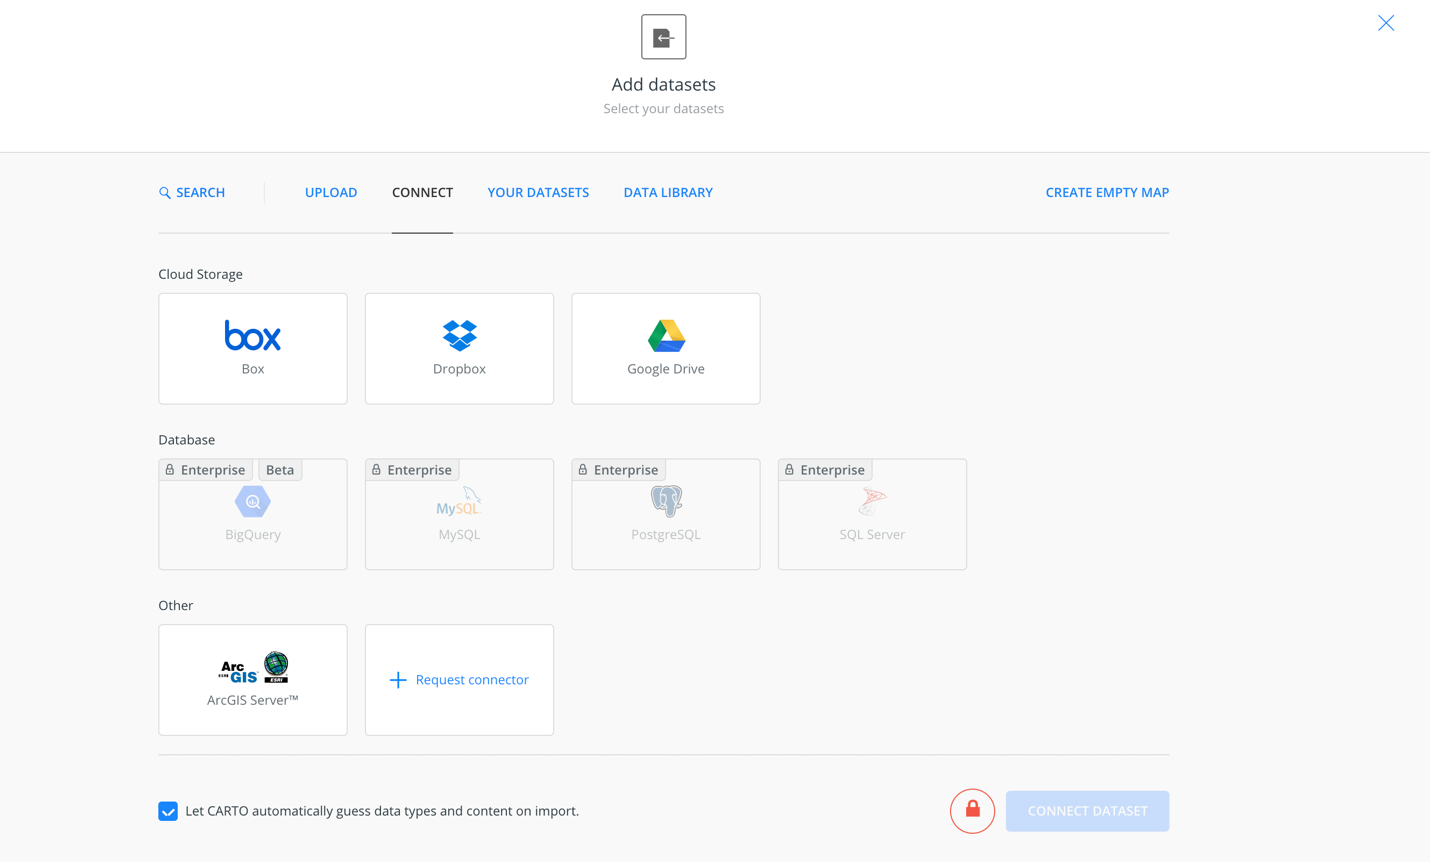
Here, you can load in data libraries available for public use, connect your own files, or connect your new map to libraries you’ve saved for future use. You can also do this later on, so for now we’ll select “Create Empty Map”.
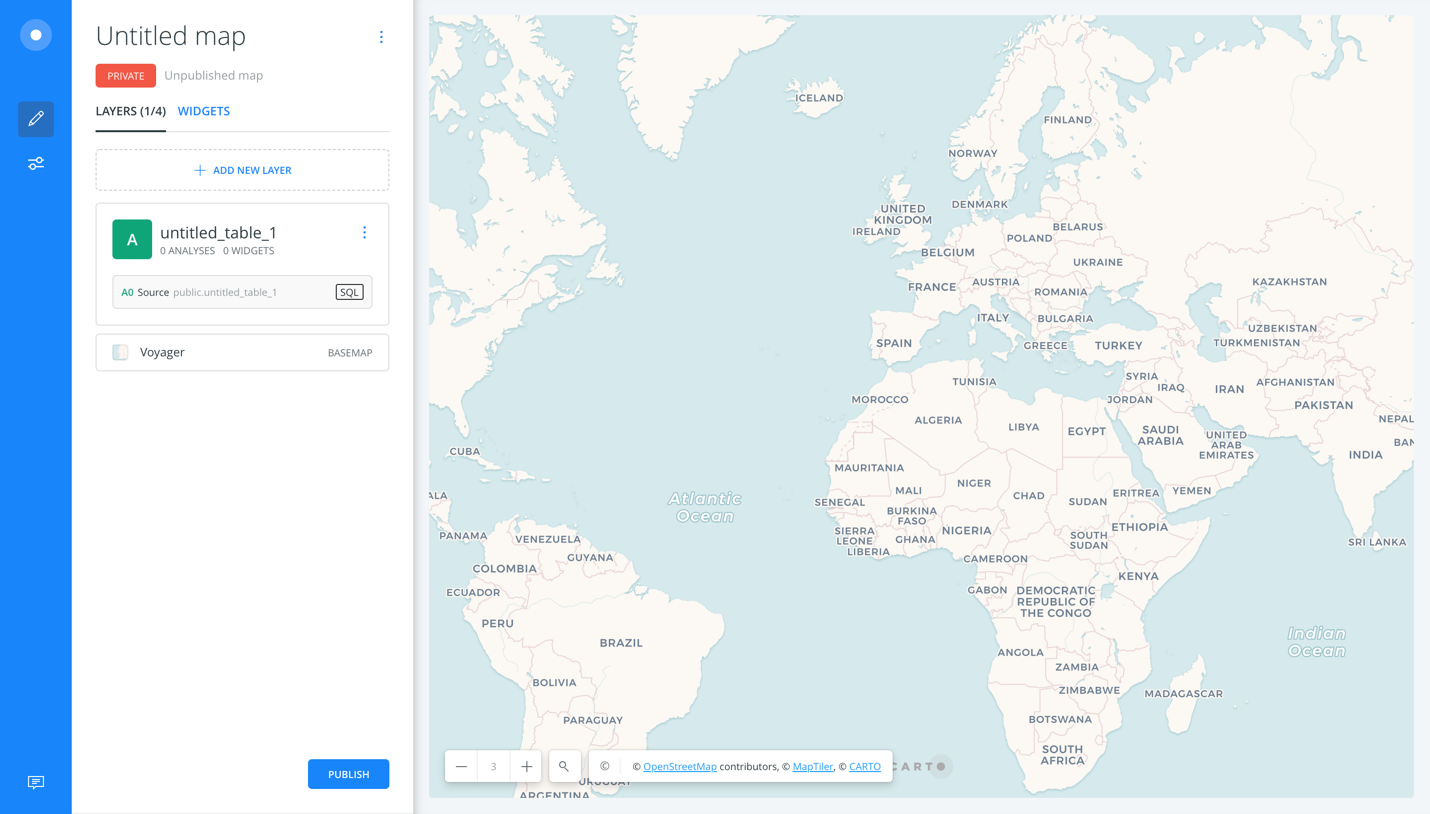
Creating an empty map will take you to the following page, where the map takes up the majority of the screen, and you see a rightmost pane indicating the different map layers, as well as where data tables you control would reside, so you can modify their analytics and perform other functions to enhance the map. Next, we’ll click on the Basemap button which currently says “Voyager” to get started.
Changing the Basemap to TomTom
Swapping out the map you see on the left to a TomTom map is actually a very simple task, but it only lays the canvas for representing a huge amount of information you can use for your own analytics research.
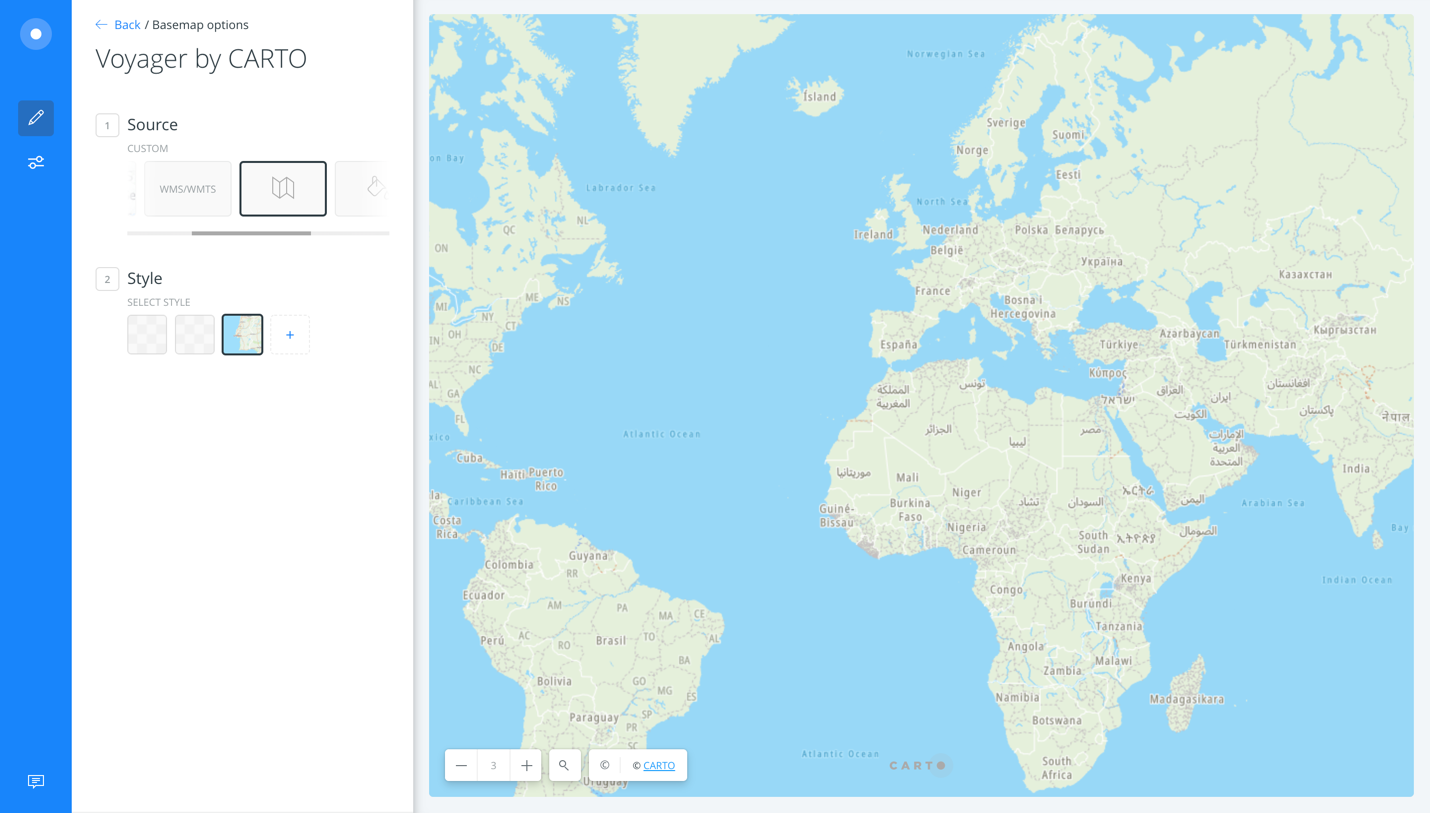
On the right pane, you can see that CARTO includes a number of styles within our current Voyager option -- you can see all of the custom visual presets at work under the Style options tab.
Under the Source tab, we’ll select “CUSTOM” from the wide set of options to begin the process of switching this out for a TomTom style.

The next page you see will be this one, where you are prompted with a variety of options to query for your desired map layer. There are several formats that can be used to pull in map layers from across the mapping community, but it’s most optimal for a TomTom map to be added via XYZ.
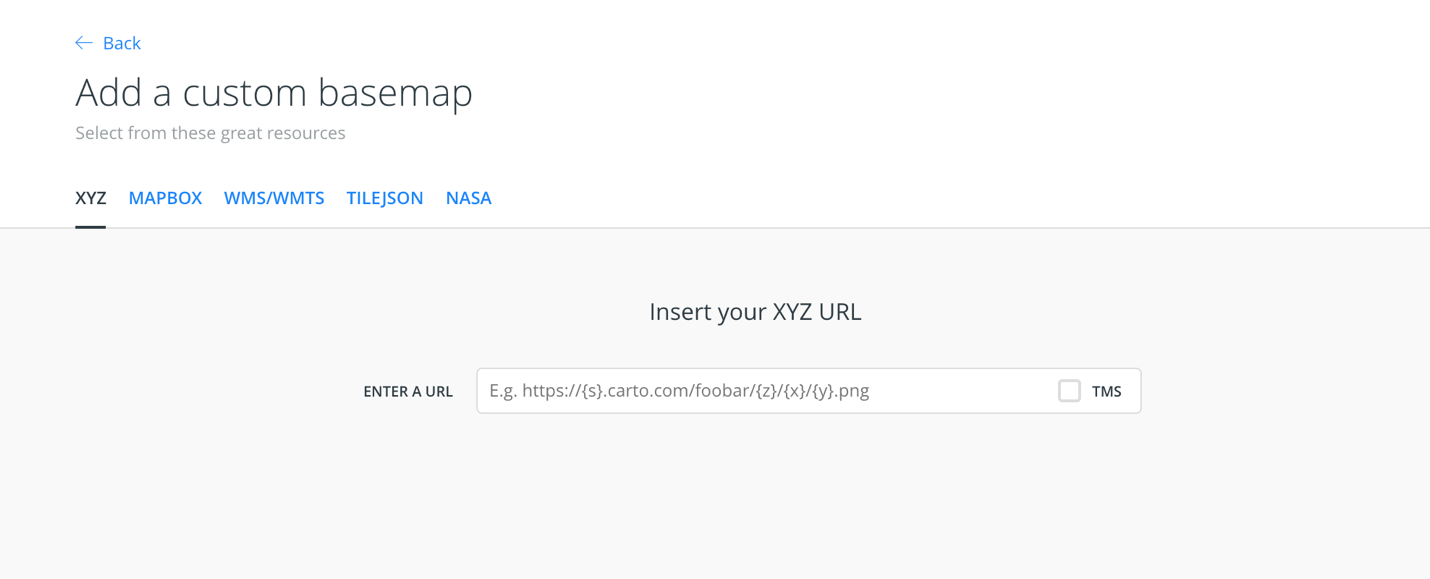
And as such, we’ll be using the XYZ option to insert the following URL:
Instead of “your-api-key”, you would create a developer account at developer.tomtom.com, retrieve your own personal API key, and then simply just paste it in.

Clicking “Add Basemap” will complete the task. When we’re back at our previous map page, we now see this:
Now, not only do you have the TomTom main style embedded as your basemap, but you can of course toggle between different sources and come back to it later when your map is saved.
If you look closely at our query, however, we only used one of the TomTom map styles available to us. If I changed basic/main to read basic/night in , we would end up with the following map instead:

You can learn more about the different styles here, in our Map Styler, and also shown below. The styler allows you to generate maps based on the built-in styles shown below, customize your map completely, and export your work for later use. Here, because of the XYZ format, we will be exclusively using the built-in styles.

As you can see, labeling conventions and the appearance of different map components dictate whether the map style falls under Basic, Hybrid, and Labels to fit the needs of different mapping uses. You can try these to see which works for your visualization in your CARTO project. So far, I have found Basic and Basic Night to display best.
Adding Traffic Incidents
While we can’t add traffic incidents as a basemap to sit atop our existing TomTom basemap, it is possible to still import the TomTom Traffic incidents layer in the same way we just imported the regular map.
Using the same XYZ option under the custom basemaps option, we’ll use the query to give us the following incident layer displayed with CARTO visualization:

This shows a great deal of information on the current traffic patterns in any given city. However, because we are not able to layer it over another existing TomTom map, we only see the incidents by themselves, without other expected mapping information.
This view is still potentially useful for use underneath data layers that relate to mobility and congestion, and gives you more than one way to use TomTom within your CARTO projects.
Going a Step Further With Data
Those weren’t so hard, was it? Hopefully not! (And if they were, ping me at @ovahsen and @tomtomdevs on Twitter or message our developer forum!)
Now that you’ve created a blank CARTO map with TomTom base layers, we can go back and add data which suits our needs. In my case, I’m going to use some public data fields to correlate different environmental impacts using Physical Data Sets, such as the Storm Events 2014 in the example here.
I’ll be using the de-glaciated areas set, coastal ports, as well as coral reefs, on my map. When I select data sets, I simply click “ADD LAYER”.

Selecting and adding the first two maps gives me this view of red ports and green coral reefs:

And then, this colorful view, after adding de-glaciated areas:

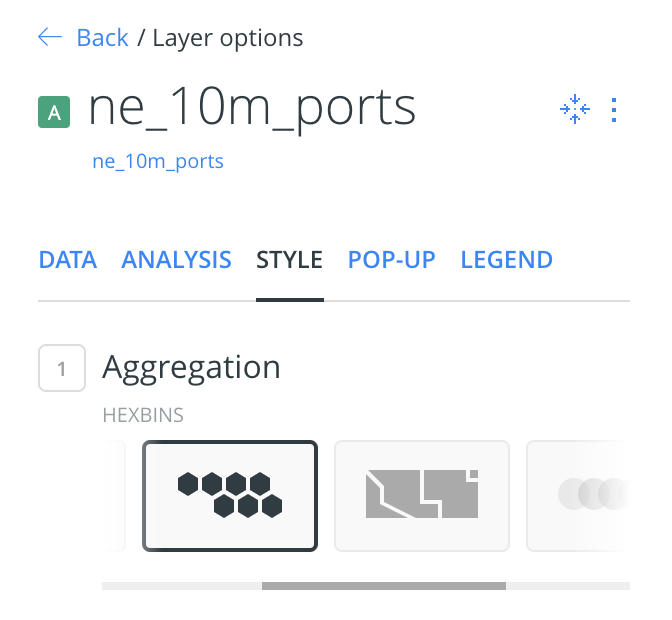
To add some customization, we can change the ports’ Style to Hexbins and, using the same style pane of the De-Glaciated areas layer, make color changes as well.
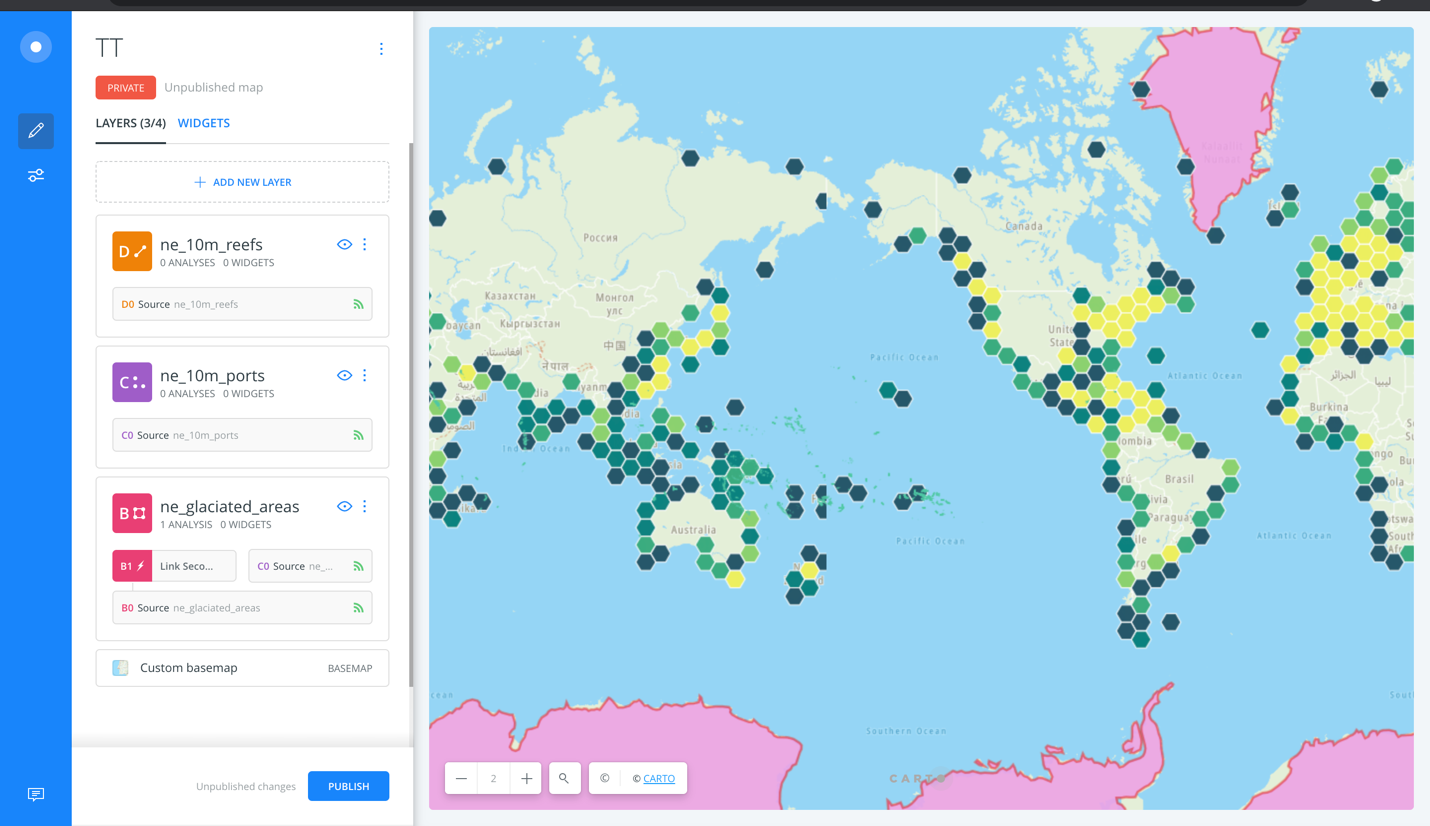
Voila! Above, we show the density of port presence along coastlines in shades of green. Reefs are indicated mostly in the South Pacific, and we can see the correlation there based on density indications to give us a small step into correlating larger events overral.
I changed the borders of areas where glaciers have receded to be red, to stand out against the coastlines, and the main glacier colors to be pink for better contrast.
Now we have a good set of environmental factors added to our TomTom basemap, which could be the foundation for any number of exciting projects!
Conclusion
Data visualization has a growing presence in our world, with multiple needs and interesting applications taking advantage of this field. Representing data goes hand in hand with location technology, but scaling up the level of interest also scales up complexity. If you’re a beginner with projects on your plate, needing development skills to use different location-based visualizations might seem daunting; CARTO provides a great avenue to tie into your development with TomTom maps for cross-platform applications, and give you new interests and perspectives of location data at work in the world around us.
Check out our developer portal to sign up for a free API key, and don't forget to connect with us in the TomTom Developer Forum for any questions you may have while building.
Happy mapping!