Real-time BART Commute Mapping, Part 2: Building a Web Map
)

In a previous article we saw how Bay Area Rapid Transit (BART) supplied transit information to applications through APIs and General Transit Feed Specification Real-Time (GTFS-RT) data to grab station locations and train Estimated Time of Departure (ETD) data and use the TomTom Maps SDK to create a real-time commute map.
In a previous article we discussed the General Transit Feed Specification (GTFS), and saw how Bay Area Rapid Transit (BART) supplied information to applications through APIs available at http://api.bart.gov. We showed how to indicate the command to execute, and the arguments to be supplied to the functions. We presented the format of the station data and the Estimated Time of Departure (ETD) data.
We reviewed sample functions to retrieve the data and display it in a theoretical Express.js application. Today we’re going to make use of those functions in a real application. The application will show information about the BART system on a TomTom map with just a few lines of code.
You can use the following links to review GTFS, the BART program, and the APIs:
- https://developers.google.com/transit/gtfs
- https://www.bart.gov/about/developers
- http://api.bart.gov/docs/overview/index.aspx
You can find information about the TomTom developer program and the SDK at
https://developer.tomtom.com/.
What You’ll Need
To build the application, you’ll need Node.js and the Express builder. After the app is created, we’ll use Visual Studio Code to edit. Follow the links below and make sure you have these installed:
Set Up the App
Use the express command in a console window to set up the basic Express app:

The “--view pug” switch tells the Express builder that we want to use the pug view engine. (See https://pugjs.org/api/getting-started.html for details.)
The next step is to install all the dependencies. Change directory and use npm to do so:

This will take a minute or two. If you see a note about security vulnerabilities, you can usually fix them by running “npm audit fix”:

Now that the basic framework of the app is ready, you can open VS Code to do the editing. Just type “code .” in the window to open the current folder.

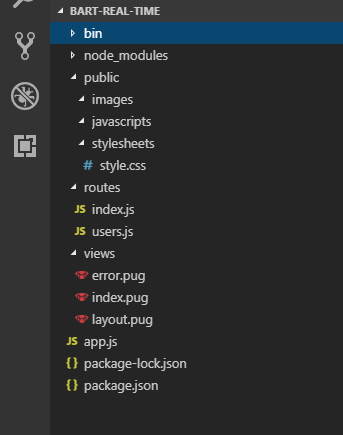
We’re going to create a JavaScript file in the javascripts folder, which is where we’ll put our API calls for BART. For simplicity, we’ll put all the other code in the index.pug file. We’ll use the layout.pug file for the links to the supporting stylesheets and JavaScript files for BART and for TomTom. If that seems like a lot, just copy the folder arrangement shown below.
Downloading the TomTom SDK is the next step in getting the app to run and actually show a map.
Go to https://developer.tomtom.com/maps-sdk-web to access the SDK. If you don’t already have a TomTom account, see https://developer.tomtom.com/user/register. You’ll need to register to obtain an API key in order for your map to display.
In the code you receive from the SDK, there will be placeholders for the API key, which you’ll simply replace with your own real key.
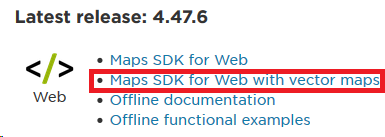
Get the TomTom SDK
Download the TomTom SDK from https://developer.tomtom.com/maps-sdk-web/downloads. We’re going to use the vector maps version of the SDK, so click this link:
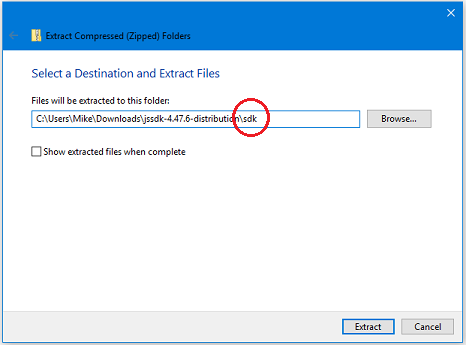
Extract the SDK into a new folder and add “sdk” to the end:
Drag the sdk folder into the public folder in the VS Code project explorer to import it:

We’ll import the SDK and other files using the shared layout.pug file. Double-click layout.pug and make it look like this:
doctype html
html
  head
      title= title
      link(rel='stylesheet', href='/stylesheets/style.css')
      link(rel='stylesheet', href='sdk/map.css')
      script(src='sdk/tomtom.min.js')
      script(src='javascripts/bart.js')

  body
      block content
Our next step is to create the file named “bart.js,” so close layout.pug now.
Code the API
The bart.js file will be our link to the BART APIs. Right-click the javascripts folder and create a new file named bart.js.
First, we’ll get the station details. As we learned in part 1, the API is a set of endpoints that return either xml or json. We’re going to create asynchronous functions that use the “fetch” command to make the call.
Getting Station Data
async function getAllStations() {
      let response = await fetch('http://api.bart.gov/api/stn.aspx?cmd=stns&key=MW9S-E7SL-26DU-VV8V&json=y');
      let data = response.json();
      return data;
}
The api call is “http://api.bart.gov/api/stn.aspx”; the command that we run is “stns”; the key we provided is the public key that doesn’t require registration, “MW9S-E7SL-26DU-VV8V”; and the last argument tells the API that the return should be in json format. We “await” the return from the API call and then use the response.json function to format the data and return it to the caller.
API Returns
Let’s take a look at what comes back from the API so we know what we’ll be doing with it.
Refer to part 1 for more details on this. We’ll be using data.root.stations.station for the array of stations in the app.
Coding the UI
Now let’s return to our code and take a look at calling the API from a page. We’re going to be using index.pug for everything here, for simplicity. Double-click index.pug.
extends layout

block content
  h1= title
  p Welcome to #{title}
The “extends layout” line means layout.pug is automatically included at the top. Pug files use indentation to create hierarchy on a page. This page includes the title as an h1 element and the ‘Welcome to #{title}’ in the content of the page.
Adding Page Elements
Let’s add some more visual elements to the page. We’ll want a button to make the call to get the station info, and a way to tell the user that it’s done. We’re also going to need the TomTom map. This is how we’ll start:
div

  p

    button(onclick='getStations()') Get Stations

    span(id='gotStations')


div(id='main' class='container')

  div(id='map' style='height: 100%; width: 100%;')
Note the indentation. We created a div and a paragraph for the button and span with id=’gotStations’, and another div with class ‘container’ to hold the map. The TomTom SDK sets up the map using the element with id=’map’.
We’re going to need some variables to store information—a list for the stations and a quick-lookup dictionary. To create a script in the same .pug file we use the script tag, and everything indented under that tag will be emitted to a <script></script> element:
script(type='text/javascript').
    var stationList;
    var stationDict = {};
    var map = tomtom.map('map', {
        key: '<YOUR_TOMTOM_API_KEY>',
        source: 'vector',
        basePath: '/sdk',
        center: {lon: -122.3000, lat: 37.8000},
        zoom: 10
});
Now, we’ll move to editing layout.pug to include the tomtom.min.js file, which gives us access to the tomtom object. This is what we’ll use to call all the TomTom-related functions. In this case, it’s ‘map’, which creates the map object using the element with id=’map’. See maps-sdk-web/documentation#L.Map for details.
We’ll need to adjust the css for the ‘container’ class and for the markers we’ll use on the map. Double-click “stylesheets/style.css” and add the following at the bottom:
.icon {
  background-size: cover;
  height: 30px;
  width: 30px;
}

.container {
  position: relative;
  width: 95%;
  height: 600px;
}
Adding Code
It’s finally time to create the code to use the BART API. Return to the index.pug file and place this code below the variable declarations. Make sure to indent it so it’s within the code block below the variables.
function getStations() {
  getAllStations()
  .then(function(data) {
      stationList = data.root.stations.station;
      dictStations();
      markDone('station');
  });
}
Let’s explore this…
getAllStations()We call getAllStations in the bart.js file. It’s an async function and there’s an implicit return of a promise so we can handle it when it’s done with “then:”
.then(function(data) {

    stationList = data.root.stations.station;
That’s where we get the array from the return and store it in our local variable. In a production app, we’d certainly add testing to this pipeline.
dictStations();

markDone('station');
This is a call to a function that turns the list into an object (not yet written), followed by a call to markDone(‘station’), which will display a message that the stations were loaded.
Now let’s add those functions. The dictStations function goes like this:
function dictStations() {

  if (!stationList) {

    return;

  }

  stationList.forEach(function(item) {

    stationDict[item.abbr] = item;

  });

}
This simply creates references in the stationDict object keyed on the unique station.abbr. This allows us to quickly obtain any station without having to search through the list.
Next comes the “markDone” function. We’re going to add “done” to the span next to the button to indicate that the stations were loaded.
function markDone(type) {

  if (type === 'station') {

    var marker = document.getElementById('gotStations');

    while (marker.firstChild) {

      marker.removeChild(marker.firstChild);

    }

    marker.appendChild(document.createTextNode(" done"))

  }

}
First Run
Click the Debug button, then click Add Configuration:

You should be able to select Node.js: Launch Program from a list, and when you’re done it should look like this:
"version": "0.2.0",

"configurations": [

    {

        "type": "node",

        "request": "launch",

        "name": "Launch Program",

        "program": "${workspaceFolder}inwww"

    }

]
You can then press F5 to build and run the application. This will start up Node and load the program in the test server. Launch your browser and load http://localhost:3000/ to view the application.
After you click the “Get Stations” button, you should see the word “done” appear next to the button in your browser:

Now that we know that the stations have been loaded, let’s place a few markers on the map.
Adding Map Markers
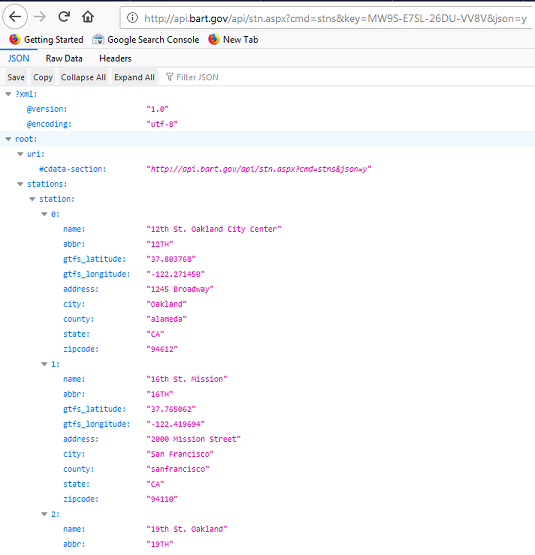
Review the image below as a quick refresher on the data that’s returned from the BART API:

The layout shows the data we want is root.station[x].etd[y].estimate[z]. There are three estimates from the LAKE station to the DALY station. The GREEN line on platform 2, in 4 minutes, the BLUE line on platform 2 in 11 minutes, and the GREEN line again on platform 2 in 19 minutes.
Getting ETD Data
We’ll add functions to bart.js to get both the full list of stations and the list for just a particular station:
async function getAllEtd() {

    let response = await fetch('http://api.bart.gov/api/etd.aspx?cmd=etd&orig=ALL&key=MW9S-E7SL-26DU-VV8V&json=y');

    let data = response.json();

    return data;

}

async function getEtdForStation(station) {

    let response = await fetch(`http://api.bart.gov/api/etd.aspx?cmd=etd&orig=${station}&key=MW9S-E7SL-26DU-VV8V&json=y`);

    let data = response.json();

    return data;

}
Now go back to index.pug and place a button with a marker for the page to get the data:
button(onclick='getEtds()') Get Estimates

span(id='gotEtds')
Add in variables, to hold the etd info and an array for keeping track of the markers we place:
var etdList;

var markers = [];

Add in a page function to get all the etd info (place it under the code we wrote earlier):

function getEtds() {

    getAllEtd()

    .then(function(data) {

        etdList = data.root.station;

        markDone('etd');

    });

}
Here’s a challenge… add code to the markDone function to handle the ‘etd’ case. Bonus if you refactor it so you don’t have to replicate code for each type. You can then run this to see the “done” message get set for the ETDs.
Adding Station Markers
We want to show two kinds of markers on the map: markers for stations and markers for the estimated departures. We’ll need the location, an icon, and a message to display on click. Let’s start with a function to place a marker:
function addMarker(location, icon, message) {

    let marker = new tomtom.L.Marker()

    .setIcon(icon)

    .setLatLng(location);

    if (typeof message !== 'undefined' && message.length > 0) {

        marker.bindPopup(message);

    }

    marker.addTo(map);

    markers.push(marker);

}
TomTom draws some functionality from the open-source Leaflet library, which is available via tomtom.L. The marker is one such item. You can find detailed information on markers at leafletjs.com/reference-1.3.0.html#marker. Marker is a fluent API so we can chain to the .setIcon(icon) and .setLatLng(location) functions.
If we don’t get a message, we don’t want an empty box — so, Marker first checks to see if anything’s there. In the last two lines we add the marker to the map and store a reference in the markers array.
Now let’s call addMarker and show the stations on the map:
function showMarkersForStations() {

    stationList.forEach(function(station) {

        addMarker(L.latLng({lat: station.gtfs_latitude,

                            lng: station.gtfs_longitude}),

        L.icon({iconUrl:'/sdk/images/ic_map_poi_005-black.png'}),

        'Station name: ' + station.name + ', abbr:' +

        station.abbr + ' Lat Lng: ' +

        station.gtfs_latitude + ':' + station.gtfs_longitude);

    });

}
We traverse the stationList with forEach and call the addMarker function to create the location, the icon, and the message as needed. See leafletjs.com/reference-1.3.0.html#icon and leafletjs.com/reference-1.3.0.html#latlng for details.
We create LatLng using the latitude and longitude from the station. The icon uses the url to get an image in the SDK. And we pass in some information from the station for the message argument.
Now we need another button to show the markers for the station. We want this in a separate paragraph, so just under the button and the span for etd, add this:
p
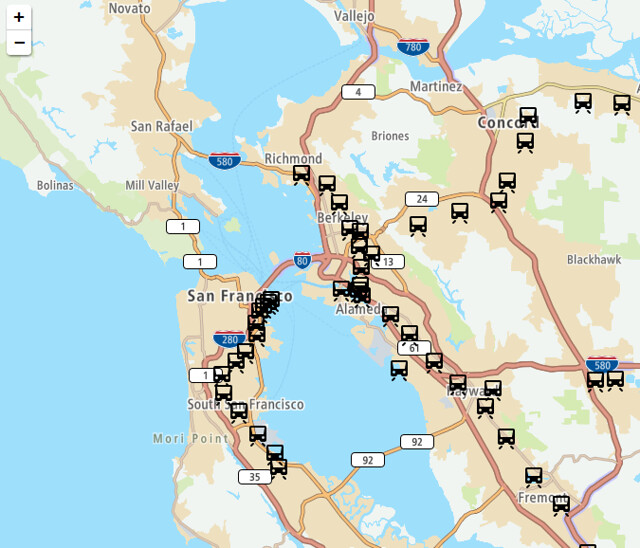
button(onclick='showMarkersForStations()') Show StationsBe careful to indent this inside the div and a sibling to the existing p. Rerun the application and click the Show Stations button, and you should see this:
Now we’re going to add something to clear out the markers and show the markers for the different lines. The lines are referred to by color so we’ll traverse the etd array looking for anything with a matching COLOR attribute.
Adding Train Departure Markers
We have the addMarker function, so all we need to do is pass in a different icon and a different message with the location for the station.
The first step is to create a function that will traverse the etdList. Remember, there’s an array inside an array inside an array to get to the data we want. We want to be able to reuse this for different purposes, so we’ll create a function that accepts a filter function as the only argument:
function showMarkersFiltered(filter) {

  etdList.forEach(function(item) {

    // refer to the dictionary to get the station info

    let station = stationDict[item.abbr];

    item.etd.forEach(function(etd) {

      etd.estimate.forEach(function(est) {

        if (filter(est)) {

        // get marker location from the station

        addMarker(L.latLng({lat: station.gtfs_latitude,

                            lng: station.gtfs_longitude}),

                  L.icon({iconUrl:'/sdk/images/ic_map_poi_040-' +

                          est.color + '.png'}),

                          'Departing ' + station.abbr + ' platform ' +

                          est.platform + ' ' + est.direction + 'bound in ' +

                          est.minutes + ' minutes');

          }

      });

    });

  });

}
Here we see the showMarkersFiltered function starting from the etdList and traversing the list with forEach. The top level of the etdList is the departure station, so we use item.abbr to get the station object from the stationDict. After that the function drills down into the etd and estimate levels to get through each of the estimated departures. Then we see it using the filter if (filter(est)) {. Note that it passes to the filter function the current “est” item, which is the lowest level in the dimensions—the estimate. We’re calling back to the function that requested this so it can use whatever criteria is needed to show or not show the marker for that estimate.
Before we move on, let's take a look at the line that creates the icon:
L.icon({iconUrl:'/sdk/images/ic_map_poi_040-' + est.color + '.png'})Note that we use the est.color in the name of the icon. I made copies of the ic_map_poi_040-black.png file to create one for YELLOW, GREEN, BLUE, RED, ORANGE, and PURPLE.
Next, we’ll add in a function to call this and supply the necessary filter callback:
function showMarkersForEtd(color) {

  showMarkersFiltered(function (est) {

      return (est.color === color);

  });

}
In the showMarkersForEtd function, showMarkersFiltered takes the est object and checks to see if the est.color matches the color argument passed, returning a Boolean to be used in the if statement.
We also need something to clear out the markers; here are the functions for that (paste them in under the rest of the JavaScript, remembering to indent):
function clearMarker(marker) {

  map.removeLayer(marker);

}

function clearMarkers() {

  if (markers.length > 0) {

    markers.forEach(function(item) {

      clearMarker(item);

    });

    markers = [];

  }

}
Finally, we need buttons for clearing the markers and to call the showMarkersForEtd function, so we’ll add these in the group with the Show Stations button. This is what it should look like now…
p

    button(onclick='clearMarkers()') Clear Markers

    button(onclick='showMarkersForStations()') Show Stations

    button(onclick='showMarkersForEtd("YELLOW")') Show Yellow
Our new button is going to call the function to show the markers for the YELLOW line. Try it out, and this time click on one of the flags. You should see something like this:
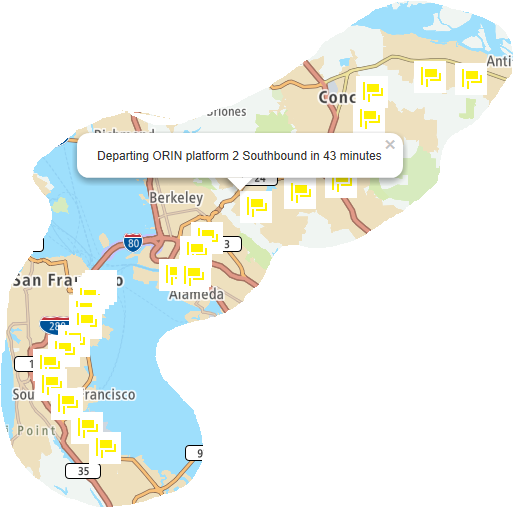
Irregular clip for article only, actual image will be the full map.
To finish up, we just add more buttons:
p

    button(onclick='clearMarkers()') Clear Markers

    button(onclick='showMarkersForStations()') Show Stations

    button(onclick='showMarkersForEtd("YELLOW")') Show Yellow

    button(onclick='showMarkersForEtd("RED")') Show Red

    button(onclick='showMarkersForEtd("BLUE")') Show Blue

    button(onclick='showMarkersForEtd("GREEN")') Show Green

    button(onclick='showMarkersForEtd("ORANGE")') Show Orange
This will show the stops for each color line.
Wrap-Up
In this exercise we:
Reviewed GTFS and GTFS-RT.
Reviewed the data provided by the BART API for stations and for ETDs.
Built a very simple Express.js app and imported the TomTom SDK.
Displayed the TomTom map and showed the locations of stations with just a few lines of code.
Built a system for showing the estimated time of departure (ETD) for BART stops.
You can extend this app by adding any number of criteria you wish to the Boolean function used in the showMarkersFiltered function. The sample application includes a method for showing all items within a selected time period. Combine that with the color to see where you can catch the yellow line in the next 10 minutes. If you’d like to add advisory, schedule, or route information, you can get that information from other APIs athttp://api.bart.gov/docs/overview/index.aspx.
For more information on the TomTom APIs, use the Documentation menu on the TomTom Developer Dashboard at https://developer.tomtom.com/.