)

If you're a train or bus commuter, knowing the real-time location and time to arrival of the next ride are crucial data points. The Bay Area Rapid Transit system (BART) provides open train information in the real-time GTFS-RT format. In this article we'll examine the data BART provides, then we'll use public BART APIs and the TomTom Maps SDK to create a real-time commute map.
Mapping public transit means more than just knowing where the transit stops are. The timing is as important as the location, if not moreso. If you're a train or bus commuter, you know that real-time location and time to arrival are key data points… waiting on a cold platform for a train to arrive is not a great use of time.
As software developers, say we wanted to create an application that tells commuters exactly where a train was and when it would arrive at a given station? We would need real-time information to provide our users with everything they need to know. Enter GTFS and GTFS-RT.
GTFS and GTFS-RT
The General Transit Feed Specification (GTFS) is an open standard for information about a transit system. The GTFS-RT part, where RT stands for Real-Time, provides up-to-the minute information on the progress of the transit system.
The Bay Area Rapid Transit system (BART) has implemented BART APIs for getting this information. These APIs are provided at endpoints hosted at http://api.bart.gov/api/.
We’re going to take a look at the station information and what the BART system calls “ETD” or estimated time of departure.
For general information about the BART developer program you can read more at https://www.bart.gov/about/developers.
API Endpoints
There are two endpoints that we’re going to look at today. The first is the station endpoint at: http://api.bart.gov/api/stn.aspx?cmd=stns&key=MW9S-E7SL-26DU-VV8V&json=y.
The main entry point for the API is . The entry point is followed by the command, a key, and the JSON argument.
The command we’re using is “stns” to get stations information.
There is a public key available at the BART developer website.
The “json” argument indicates that we want the information to be transferred to us in JSON format.
Enter that URI into a browser window. If your browser displays formatted JSON (some browsers have extensions that enable JSON formatting), then you should see something like this:
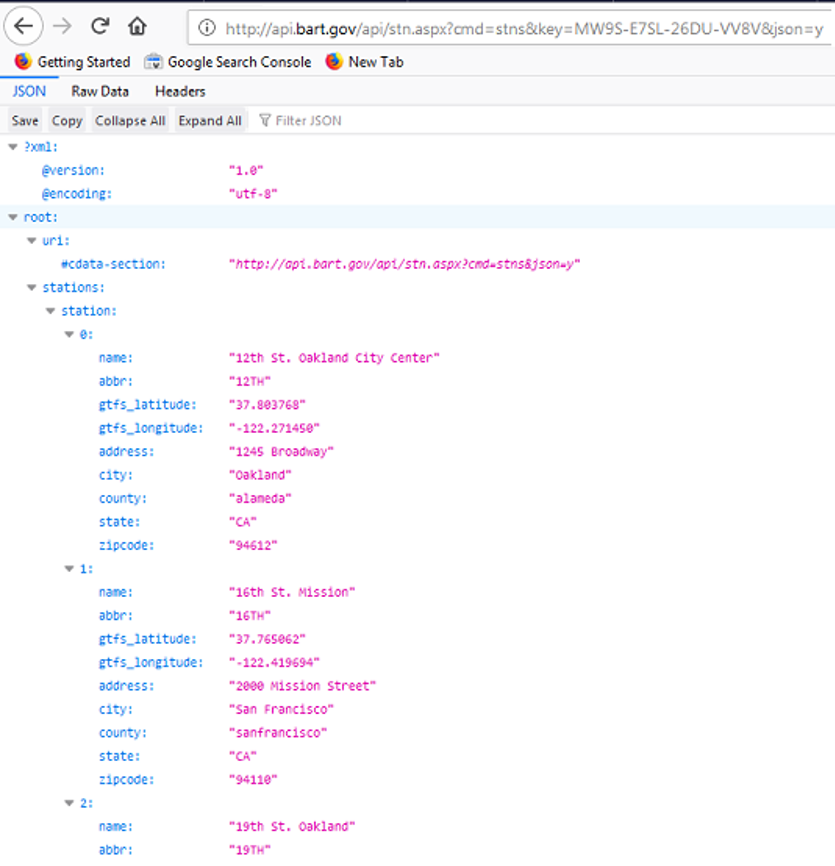
Take a moment to look at the structure of the data we get back. The top-level item, root, then the URI we used to make the call, and then stations — the important stuff. "Stations" is an object, and it contains an item named “station” that’s the array of station details. You can see element 0, 1, and part of 2 in this clip. There are 48 elements, one for each station. The root.stations.station element is the array of station items.
There’s one other important data point, the "abbr" item. It’s unique and can be used as a key in a JavaScript object or C#/Java dictionary.
The other endpoint that we’re going to look at today is the real-time data on estimated departures. We can request the information for a single station or all stations. The endpoint we need is:
http://api.bart.gov/api/etd.aspx?cmd=etd&orig=ALL&key=MW9S-E7SL-26DU-VV8V&json=y.This particular URI is configured to retrieve the ETD information for all stations.
We can break the endpoint apart like we did the other one. The entry point is .
The command is "etd".
The "orig" argument indicates which origin station to request (in this case "ALL").
The request also contains the same key and json argument that we used in the other call.
Let’s take a look at the data we get back:
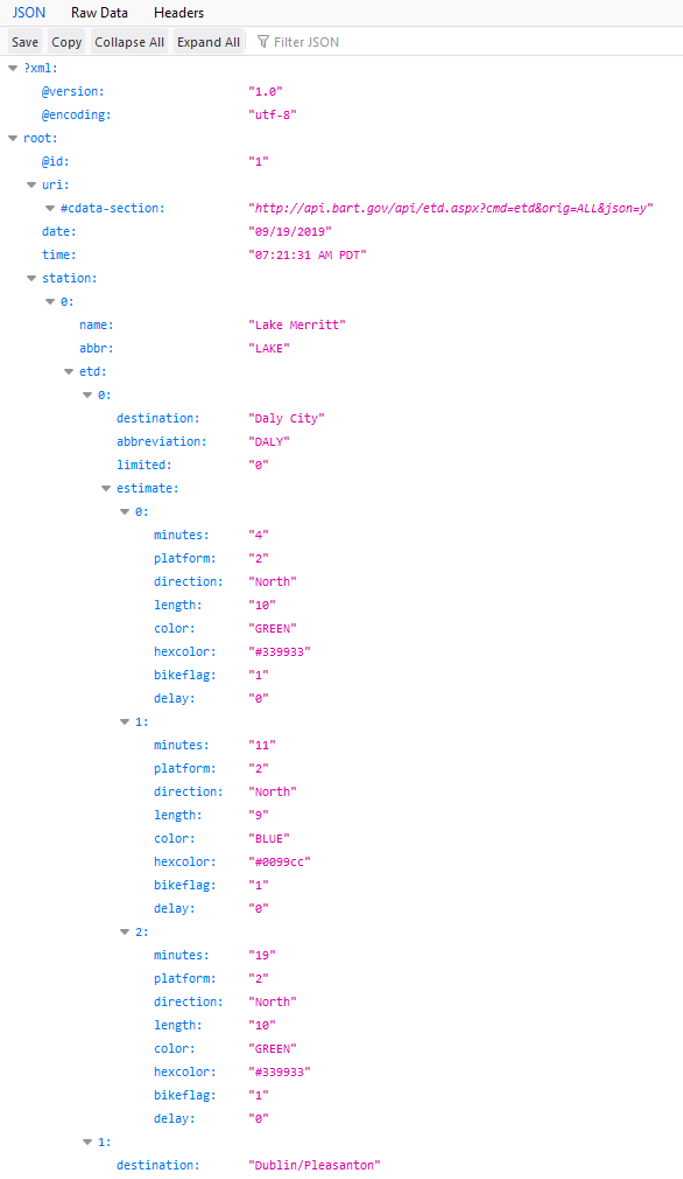
At the top, once again, we have “root”, then “station”. The “station” item is once again the array that will hold all the data of interest.
Within each station is “etd”, also an array. Each etd item refers to a specific destination and for that destination there are three “estimate” items.
So the data is root.station[x].etd[y].estimate[z].data-point.
In the data we see three estimates from the station “LAKE” destined for “DALY”. The GREEN line on platform 2, in 4 minutes, the BLUE line on platform 2 in 11 minutes, and the GREEN line again on platform 2 in 19 minutes.
Using the Data
It’s beyond the scope of this article to build an entire application. To help prepare for building something more substantial, I built a demo app using Node.js and the Express framework. There are many tutorials on creating Express apps available, so for this article, I’ll just highlight certain points.
The first is getting the data from the endpoint. We use an async function, so it doesn’t lock up the UI.
async function getAllStations() {
    let response = await fetch('http://api.bart.gov/api/stn.aspx?cmd=stns&key=MW9S-E7SL-26DU-VV8V&json=y');
    let data = response.json();
    return data;
}
I put this function in a separate file where it can be used from any page in the app. Within the app we can use it like this.
script(type='text/javascript').
    var stationList;
    var stationDict = {};
This is a clip from an Express app that uses the pug view engine. You can find info on the pug view at . This clip opens a script block and creates two variables: stationList and stationDict.
function getStations() {
  getAllStations()
  .then(function(data) {
    stationList = data.root.stations.station;
    dictStations();
  });
}

function dictStations() {
  if (!stationList) {
    return;
  }
  stationList.forEach(function(item) {
    stationDict[item.abbr] = item;
  });
}
This function in the app page calls the getAllStations function in the other file. The async function provides an implicit promise so we can react with a “.then” function to handle the result. The code stores the data from data.root.stations.station, the array of stations, into the stationList variable. Then it calls the dictStations() function, which creates a dictionary of the items in the list.
Once the data is stored in the page in an array, it’s a simple matter to traverse the array.
Let’s consider showing a picture of a train car at each station. We can create a map using the following code. The display needs a div with class name “map” and code to create the map.
div(id='main' class='container')
div(id='map' style='height: 100%; width: 100%;')script(type='text/javascript').
var map = tomtom.map('map', {
key: '<YOUR_TOMTOM_API_KEY>',
source: 'vector',
basePath: '/sdk',
center: {lon: -122.3000, lat: 37.8000},
zoom: 10
});The div code above gives the code a place to put the map, the script uses the id to get the div and create the elements that make up the map drawing surface. It requires the key you get from the TomTom developer site. For information on setting up the TomTom application see https://developer.tomtom.com/user/register.
After the map is on the screen we can place markers for each station. We need to traverse the list of stations and get the gtfs_latitude and gtfs_longitude to display a marker.
function showMarkersForStations() {
  stationList.forEach(function(station) {
    addMarker(L.latLng({lat: station.gtfs_latitude, lng: station.gtfs_longitude}),
            L.icon({iconUrl:'/sdk/images/ic_map_poi_005-black.png'}),
            'Station name: ' + station.name + ', abbr:' + station.abbr + ' Lat Lng: ' + station.gtfs_latitude + ':' + station.gtfs_longitude);
  });
}

function addMarker(location, icon, message) {
  let marker = new tomtom.L.Marker()
    .setIcon(icon)
    .setLatLng(location);
  if (typeof message !== 'undefined' && message.length > 0) {
    marker.bindPopup(message);
  }
  marker.addTo(map);
}
We use stationList.forEach to loop through the list. We call the addMarker function and pass in a L.latLng object, an L.icon object, and a string message that will be attached to the marker as a popup.
Showing markers for the ETD info is a bit more involved. The data we want is a bit deeper in the array. So the code to traverse the array requires three levels.
function showMarkersForEtd(color) {
  etdList.forEach(function(item) {
    // refer to the dictionary to get the station info
    let station = stationDict[item.abbr];
    item.etd.forEach(function(etd) {
    etd.estimate.forEach(function(est) {
        if (est.color == color) {
        // get marker location from the station
        addMarker(L.latLng({lat: station.gtfs_latitude, lng: station.gtfs_longitude}),
                    L.icon({iconUrl:'/sdk/images/ic_map_poi_040-' + est.color + '.png'}),
                    'Departing ' + station.abbr + ' platform ' + est.platform + ' ' + est.direction + 'bound in ' + est.minutes + ' minutes');
          }
    });
    });
  });
}
This code receives a color argument and then traverses through the etdList.etd.estimate items to find the items with the matching color. This code again calls the addMarker function to create a marker on the map. This one creates an icon with customized images for each color.
Wrap-up
Today we looked at the open standard GTFS and two implementations available from the Bay Area Rapid Transit system. We looked at the APIs, their endpoints, and the structure of the data that’s returned from the call.
The above snippets of code demonstrate a bit of how you can use data from GTFS and GTFS-RT APIs from the BART system to show markers on the map. With the proper filtering of which markers to show, we can show all the stops on for a given line (by color). We can use that same technique to search for the estimates within a given number of minutes, with the origin or the destination of a specific station, and so on.