Introducing the TomTom Traffic Analytics MCP: Turn Your AI Assistant into a Traffic Expert
)
Most MCP servers do things. They send emails, create files, hit APIs, return results. They're action-oriented, and that's fine for a lot of use cases, but less for heavy data and analytics.
We wanted to build something different. What if an MCP server didn't just provide scoped tools, but actually gave analytical freedom over data? What if you could turn your AI assistant into a traffic and geospatial expert that reasons over real TomTom traffic data, compares patterns across cities, and surfaces insights you'd normally need a dashboard or a data team to get?
That's what TomTom Traffic Analytics MCP is. It's not just a wrapper around traffic APIs. It's an analytical MCP: a server that connects your AI assistant to TomTom's traffic intelligence platform, and gives it the ability to query, filter, aggregate, and compare live and historical traffic data on the fly.
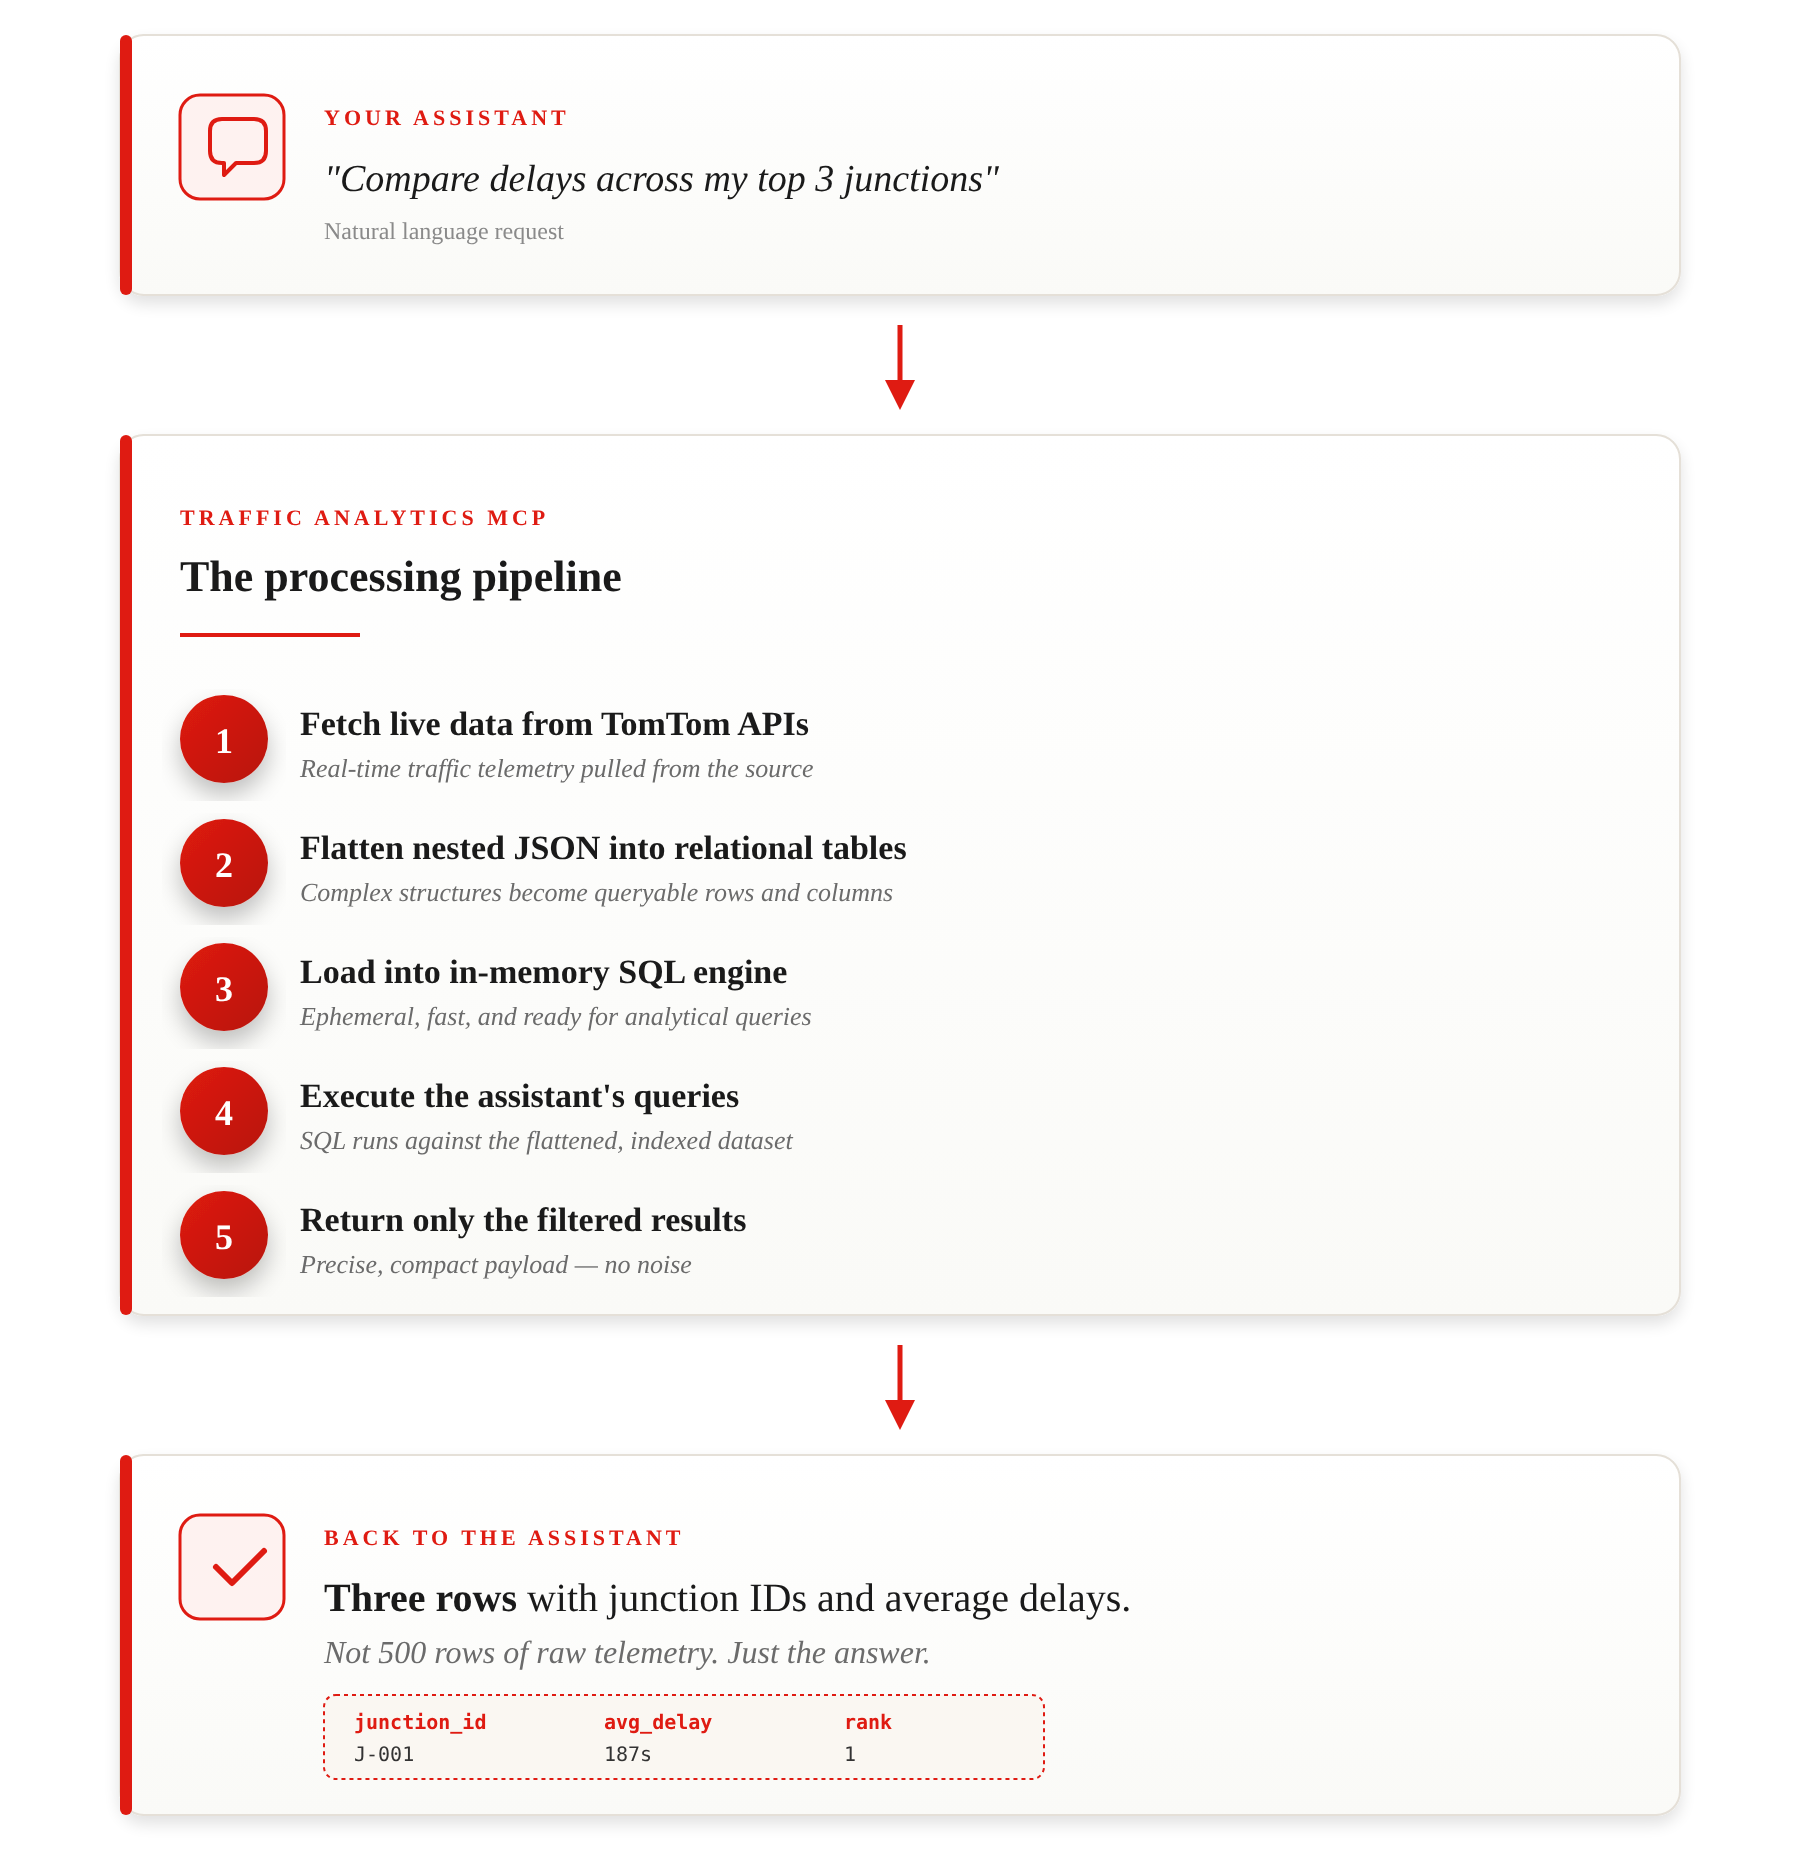
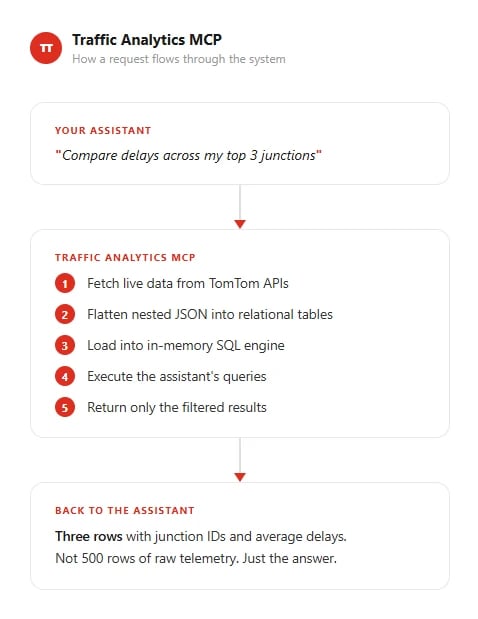
Ask your assistant "Which of my monitored junctions had the worst delays this morning?" and it actually works through the data to give you the answer. Not a guess. Not a summary of raw JSON. A real, precise answer backed by TomTom's traffic data.
A New Kind of MCP: Built for Analysis, Not Just Actions
The MCP ecosystem has grown quickly, with servers for all kinds of services. But most of them follow the same pattern: take an input, call an API, return the response. That works when the response is small and self-contained, like a geocoding result or a weather forecast.
Traffic data is a different beast. A single junction can generate minute-by-minute metrics across dozens of approaches, with delays, queue lengths, turn ratios, and stop counts. Route monitoring produces segment-level telemetry for hundreds of road segments. Incident data spans entire metro areas with nested geometry, severity codes, and timing information.
If you hand all of that to an LLM, two things happen: it burns through its context window, and it starts making mistakes trying to parse the data manually. You end up with vague summaries and hallucinated numbers.
We took a fundamentally different approach. The Traffic Analytics MCP sits between the assistant and TomTom's MOVE APIs and it does the analytical heavy lifting before anything reaches the model. The assistant tells the server what it wants to know, the server queries the data, and only the precise results come back.
This is what makes it an analytical MCP. The intelligence isn't just in the model. It's in the server too.
8 Tools Across 4 Traffic Domains
The server ships with 8 tools that cover the breadth of TomTom's traffic intelligence platform. Here's what your assistant gets access to.
Junction Analytics
tomtom-junction-search: Search all junctions by name, country, status. Auto-paginates across hundreds of junctions
tomtom-junction-live-data: Real-time metrics (delays, queues, turn ratios, stop counts). Compare up to 20 junctions at once.
tomtom-junction-archive: Historical minute-by-minute data. Analyze patterns over the past 2 days.
Route Monitoring
tomtom-route-search: Search all monitored routes with current delay and travel time.
tomtom-route-monitoring-details: Segment-level breakdown. Find exactly where bottlenecks are, not just that they exist.
Area Analytics
tomtom-area-analytics-stats: Congestion trends for any GeoJSON polygon, up to 31 days, at hourly/daily/monthly granularity.
Live Traffic
tomtom-traffic-flow-segment: Current and free-flow speeds at specific coordinates.
tomtom-traffic-incidents: Accidents, jams, roadworks, closures. Supports multi-area comparison.
Each domain follows a natural workflow. For junctions, you search first, find the ones you care about, then analyze live data or pull up the archive. For routes, you search for delayed corridors, then drill into the segments causing the slowdown. For incidents, you can define multiple named areas and compare them side by side in a single call.
Compare Across Entities, Not Just Within Them
One of the design decisions that has had the biggest impact is multi-entity querying. Instead of calling a tool once per junction, once per route, or once per area and stitching results together manually, you can pass multiple entities into a single call.
The server fetches all of them in parallel, merges the data with an identifier column (junction ID, route ID, or area name), and the assistant can compare across all of them at once. This is where the analytical nature of the MCP really shines.
A few real scenarios:
"Compare traffic incidents between the city center, the port area, and the highway ring" - three named bounding boxes, one query, a ranked comparison.
"Which of my 8 monitored junctions consistently has the longest queues during rush hour?" - eight junction IDs, one call, a clear answer.
"Are any of my freight routes running significantly slower than normal right now?" - all your route IDs, segment-level analysis, bottlenecks surfaced.
This turns your assistant from something that can look up individual data points into something that can actually do comparative traffic analysis.
How It Works Under the Hood
Every tool requires a sql_queries parameter. When the assistant calls a tool, the server fetches data from TomTom's APIs, flattens the nested JSON into clean relational tables, loads them into an in-memory SQL database, and runs the assistant's queries against it. Only the query results travel back to the model.
 This design keeps things cost-efficient too. The full set of 11 tools was carefully optimized to minimize the token overhead that gets sent to the model on every request. All tools fit under 1,000 tokens each, so the entire toolset coexists comfortably alongside other MCP servers without crowding the model's context.
The SQL layer is read-only, isolated per request, and has timeouts and row limits built in, so there's no risk of runaway queries or data leaking between sessions.
Getting Started
Install and run with a single command:
npx @tomtom-org/tomtom-traffic-analytics-mcp
To set it up in Claude Desktop, add this to your claude_desktop_config.json:
{
  "mcpServers": {
    "tomtom-traffic-analytics": {
      "command": "npx",
      "args": ["-y", "@tomtom-org/tomtom-traffic-analytics-mcp"],
      "env": {
        "TOMTOM_MOVE_PORTAL_KEY": "your_move_portal_key",
        "TOMTOM_API_KEY": "your_tomtom_developer_key",
        "USE_STDIO": "true"
      }
    }
  }
}MOVE Portal
Sign up: move.tomtom.com/register (30-day free trial)
Gives you: junction analytics, route monitoring, area analyticsTomTom Docs Portal
Sign up: docs.tomtom.com
Gives you: live traffic flow and incidents
Once you're set up, try asking your assistant:
- "Show me which junctions are experiencing the highest delays right now"
- "Compare traffic incidents between the city center and the airport"
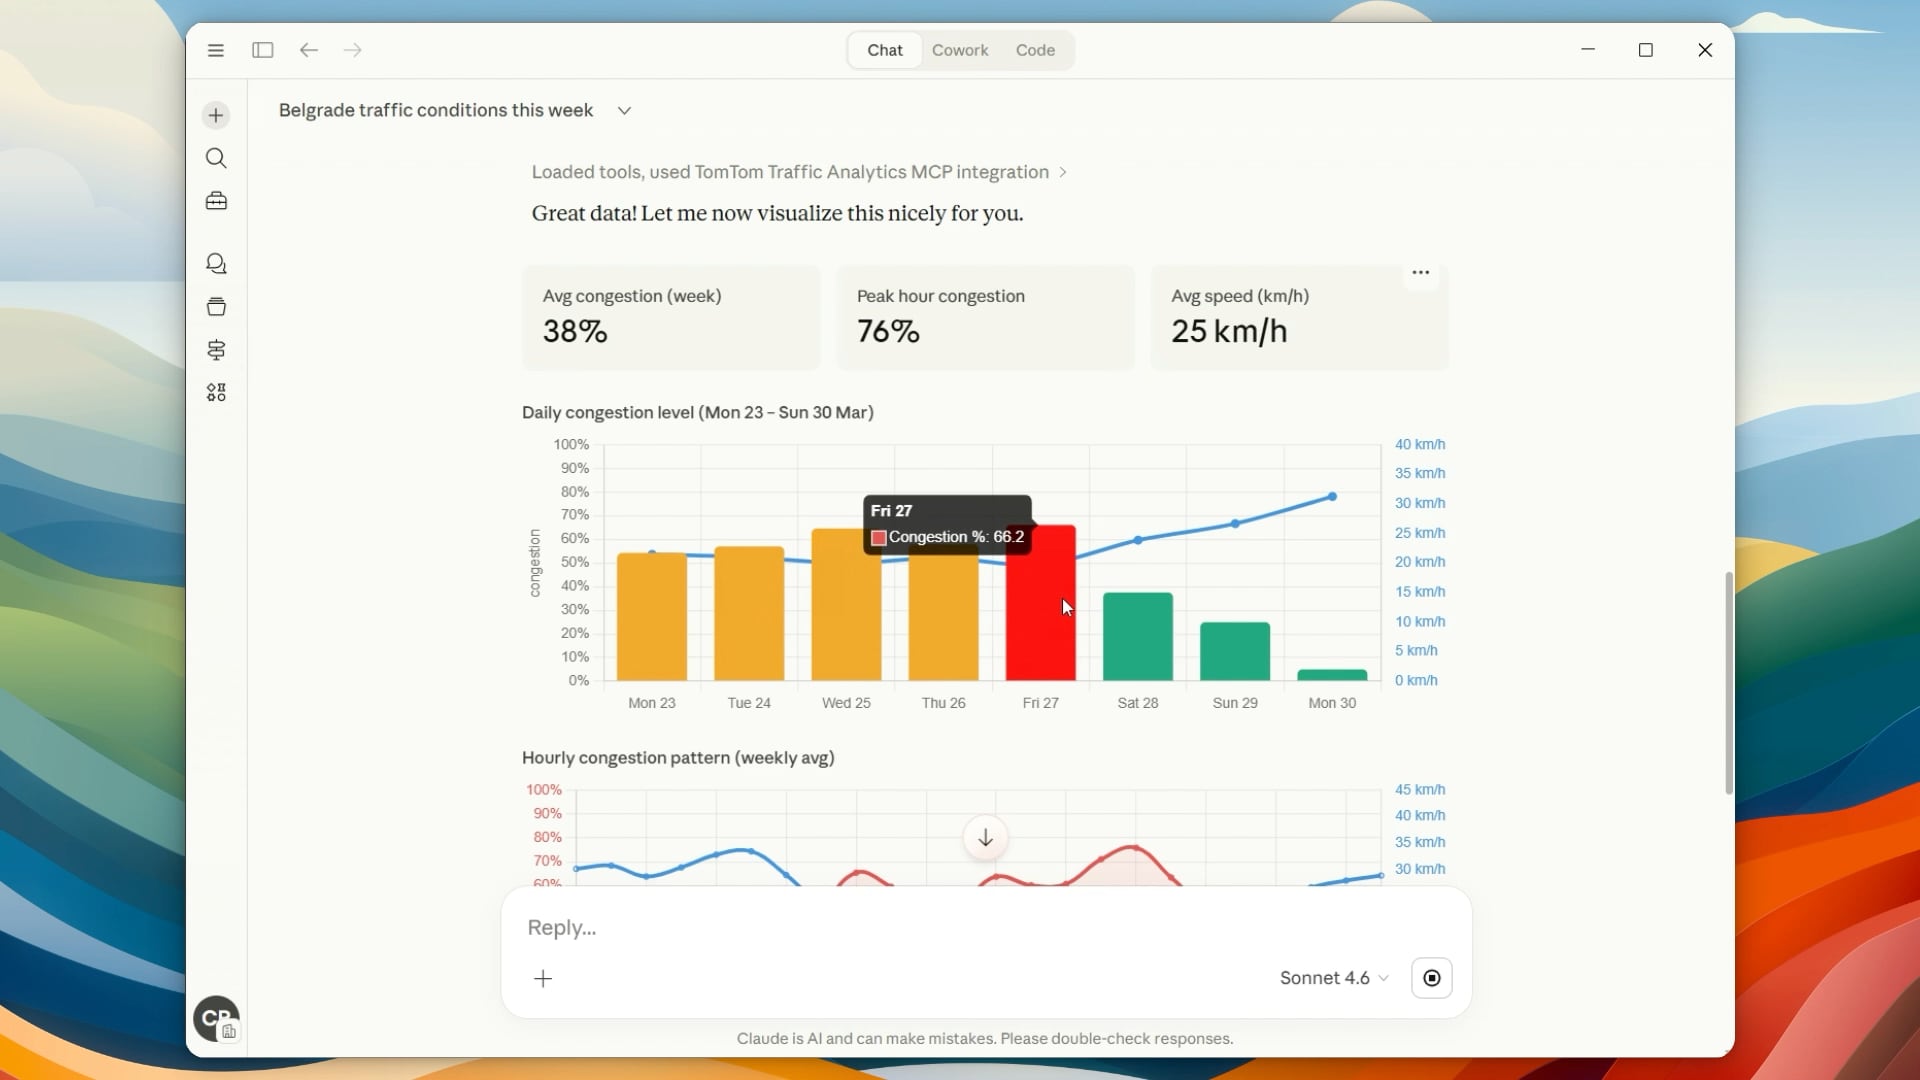
- "What's the congestion trend for this area over the past week?"
- "Find route segments running below half their typical speed"
Open Source
The whole project is open source under Apache 2.0. If you want to contribute or look through the code, the GitHub repo is the place to start. The npm package is published and ready to go.
If you're also interested in geocoding, routing, or map display, take a look at the TomTom MCP Server. The two complement each other well: one for traffic analytics, the other for location services. Your assistant can use both.
We'd love to hear what you build with it.