&w=256&q=90)

Most mapping APIs include generic features that might not align with your brand identity. Fortunately, TomTom’s Map Styler tool alleviates that challenge. It allows customizing colors, visibility of items, and more. In this article, we’ll explore how the Map Styler works.
With the recent proliferation of location-aware applications, digital maps are here to stay. Digital maps simplify the integration of any geolocation feature, from making business locations findable to visually representing nearby places and services. The possibilities are endless.
Mapping APIs like TomTom’s Map Display API abstract the low-level coordination of incorporating a map into web applications. While TomTom serves a diverse range of endpoints for working with maps, more important are the endpoints for embedding raster and vector maps in applications.
However, the endpoints serve maps with default features that might not fit a brand’s visual identity. But with TomTom’s Map Styler, this is no longer a limitation. The Map Styler enables customizing colors, item visibility, and many other visual toggles on a map to fit a brand’s design scheme. You can then export the custom style for use in other projects.
This article will explore how to start with the Map Styler and create a custom map.
TomTom Map Styler
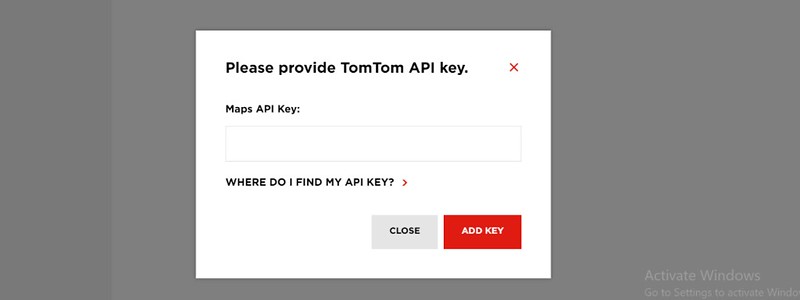
Using the Map Styler requires an API key. Follow these instructions to grab an API key, and Launch the Map Styler. Input your API key as shown below.
Upon providing your API key, you should land on the Map Styler’s interface, as shown below.

The Map Styler has a navigation bar, and below it, three panels:
Left
Middle
Right
The left panel lists all the layers on the map. The middle panel shows the selected layer on the map. Layers represent the different entities on the map. For example, there are layers for roads, layers for the sea and oceans, and so on.
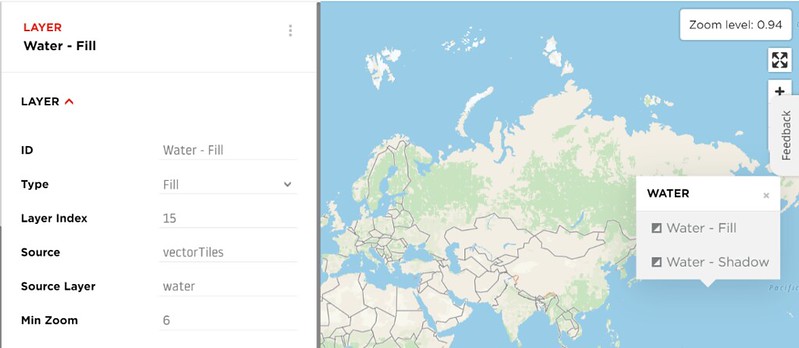
Click on a layer on the left panel to select it. Alternatively, you could select a layer by clicking on it directly on the map. For example, the image below shows the selection of the water layer directly from the map.
Selecting a layer populates the middle panel with the details of that layer. We could then customize the selected layer from the middle panel, change its color, or make it visible at a certain zoom level. Throughout this piece, we select layers from the right panel, customizing them on the middle panel.
Let’s begin by making some layers visible at certain zoom depths.
Making Layers Visible at Certain Zoom Depths
The Map Styler’s map has zoom levels between 0 and 22. As we move from 0 to 22 more layers become visible. You can configure the map to only show certain layers at specific zoom levels. Here, we configure our map to only show points of interest (POI) like national parks at zoom level 6.
First, select the POI layer from the leftmost panel. Then set the Min Zoom to 6 in the middle panel, as shown in the image below:

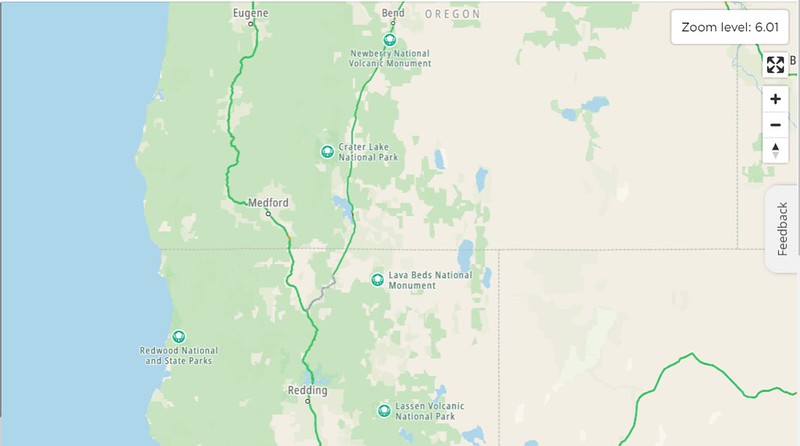
Next, increase the map’s zoom level to a value equal to or greater than on the right panel. The POIs marked with white icons housed in green circles appear as shown in the image below.
Even though we focused on POIs here, you could adopt this approach to toggle the visibility of whichever layer you want.
Next, let’s see how we could alter the colors of a map to match some color scheme.
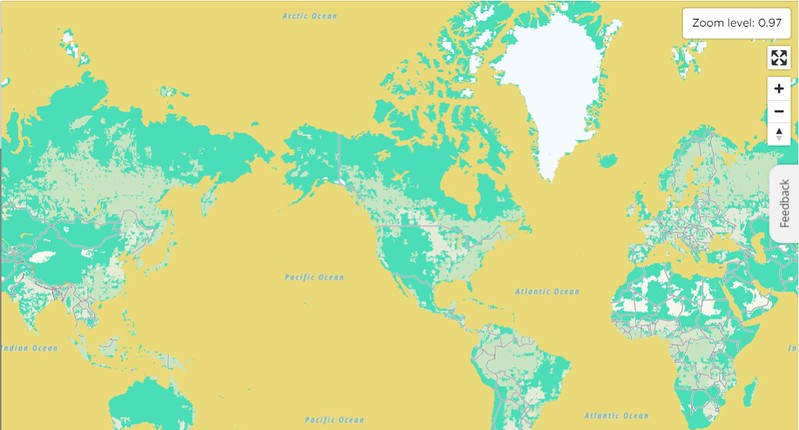
Altering the Colors of the Default Map
Let’s say our organization’s color scheme is yellow and green. To customize our map to fit that scheme, we are going to set our map’s background to green and the waters to yellow.
Click Water then Water - Fill on the left panel.
Then go to Color under Paint Properties in the middle panel, shown in the image below:
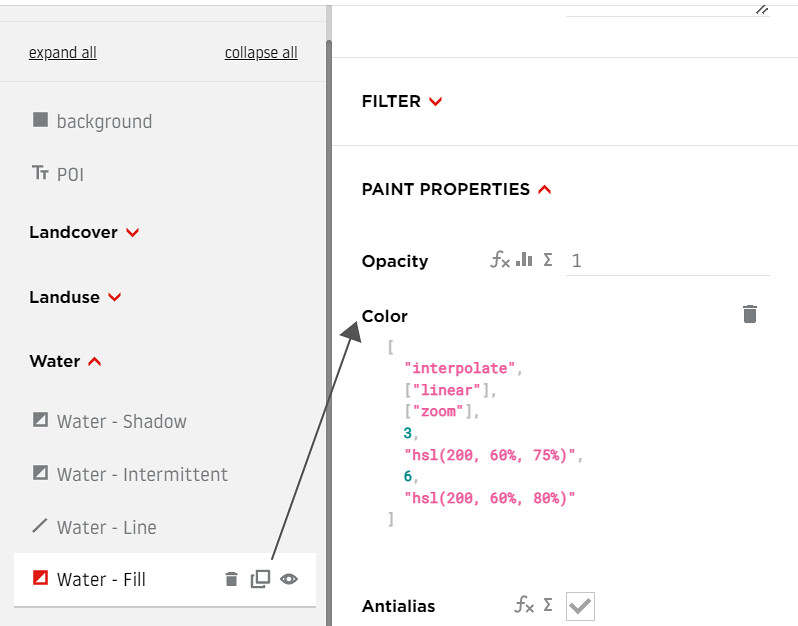
There are two sets of colors in the Color field. The two numbers, 3 and 6, represent the map zoom level at or above which to apply the color. The first HSL color value (200, 60%, 75%) is applied at zoom level 3 and the second (200, 60%, 80%) at 6. You can also use RGB values or hexcodes to define your colors.
To add our yellow color, we are not going to use different zoom levels. Override the content of the Color field with the snippet below:
[
  "interpolate",
  ["linear"],
  ["zoom"],
  0,
  "#EAD979"
]
Our map should now look like this:

Next, we change the background to green. To do that, select background on the left panel. Once done, override the content of its **Color **field in the middle panel with the snippet below:
[
  "interpolate",
  ["linear"],
  ["zoom"],
  0,
  "#49DDB8"
]
We should now have a map like the one below:
Next, let’s see how we can use alternative data sources and custom items for a map.
Adding Alternative Data Sources and Custom Items
Just so you’re not lost in a bunch of jargon, first, let’s unravel what data sources are in TomTom maps. TomTom renders layers on a map using data it receives. This data could be anything from labels to latitudes and longitudes. Think of the data source as the endpoint serving the collection of data needed to plot a single or several layers on a map.
The Map Styler plots layers on the default map using data from the TomTom server. However, the TomTom server only serves public data. What if you want to add the different locations of cars in your fleet to the default TomTom map? This is private data that won’t be available on the TomTom server. So, how do we handle a scenario like this?
Alternative data sources and custom layers, of course! To add a custom layer to a TomTom map, define the data for that layer, and then load it into the Map Styler.
You can use the GeoJSON format to define your data. There are other ways, but GeoJson is especially easy. GeoJSON is a specification for defining geographical data, and it’s a subset or specialization of the JSON format used to represent geospatial data. To define the locations of two cars in our fleet in GeoJSON, our data would look as shown below:
{
  "type": "FeatureCollection",
  "features": [
    {
      "type": "Feature",
      "geometry": {
        "type": "Point",
        "coordinates": [ 9.066667, 7.483333 ]
      },
      "properties": {
        “name”: “Ferrari Monza SP2”
      }
    },
    {
      "type": "Feature",
      "geometry": {
        "type": "Point",
        "coordinates": [6.508370, 3.384247]
      },
      "properties": {
        “name”: “Toyota Avalon”
      }
    }
  ]
}
We’ve defined a FeatureCollection object, a collection of Feature objects stored in the features array. Each Feature object defines the coordinates of a car in its geometry object. So, to add more cars, just define more Feature objects. You can learn more about those terms in the GeoJSON specification.
Beyond defining basic coordinates, you could also define a Feature object with more complex geometry types like LineString, Polygon, MultiPoint, MultiLineString, or MultiPolygon, depending on your use case.
Let’s say you’ve defined your own custom data and you want to add it as a data source in the Map Styler. To do that, click DATA SOURCES on the top menu. A list appears like the one shown in the image below:
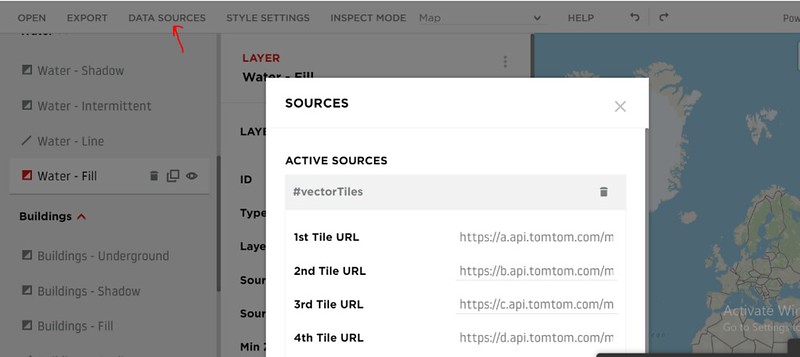
From the list, select ADD NEW SOURCE (see image below). Give your source a name in the Source ID field. Set the Source Type field to GeoJSON. For the GeoJSON Data field, upload the data you’ve defined to some remote server and populate that field with the file’s URL.
Alternatively, you could just paste your entire GeoJSON snippet into that field.
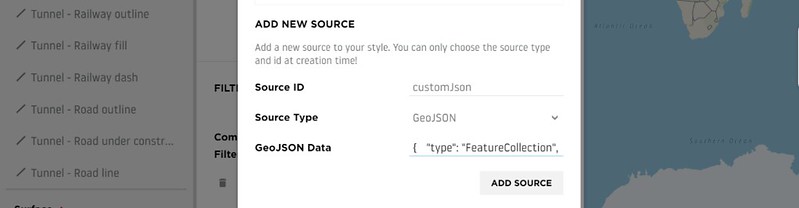
Click ADD SOURCE to add your new source to the ACTIVE SOURCES.
Next, to render your uploaded data on the map, click the ADD LAYER button on the left panel to add a custom layer. A list should appear as shown in the image below.

You could give your layer any name in the ID field. Specify how you want your layer to render on the map in the Type field. The options on the list are self-explanatory. For Layer Location, go with the default. Type the name of the alternative source you created earlier in the Source field. If you are working with a GeoJSON source, leave the Source Layer field blank.
Once you’ve provided all the required info, click the ADD LAYER button to add a custom item to the map.
It’s also possible to use custom glyphs in the Map Styler. Let’s look at that in the next section.
Adding Custom Glyphs
To load custom glyphs, go to the top menu and click STYLE SETTINGS. A list appears on your screen, as shown in the image below:

Override the Glyphs URL field with the link to your custom glyphs. Your link should generally follow this format:
https://api.tomtom.com/style/1/glyph/22.2.2-1/{fontstack}/{range}.pbf.And that’s it.
Finally, let’s see how to export a custom map from the Map Styler.
Exporting a Custom Map from the Map Styler
At this point, you should have, at minimum, a map with the green and yellow custom colors in the Map Styler.
To export that map so you can embed it in your website (for example), go to the top menu and click EXPORT. A list appears on your screen, as shown in the image below:
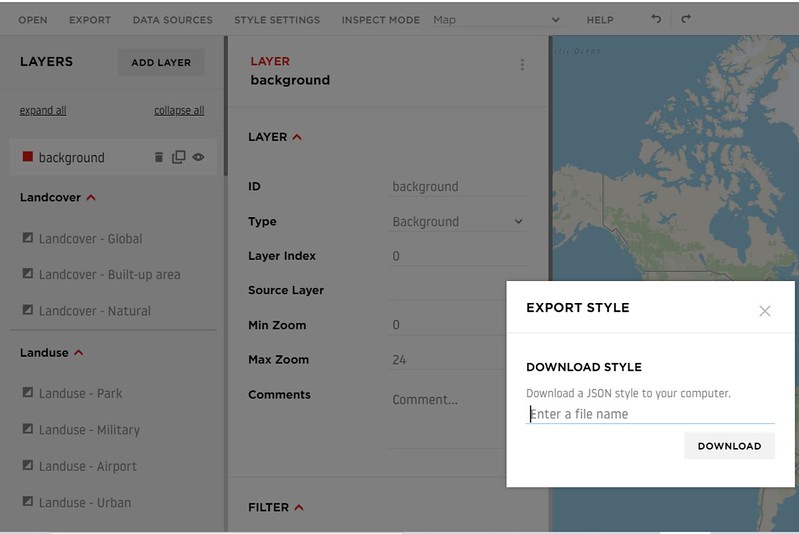
In the dialog box, enter a file name and click Download. A JSON file downloads to your machine. Now use that file to add your custom style to whatever project you want.
Showing how to load the exported style into your project is out of the scope of this piece. However, you could follow this tutorial to familiarize yourself with displaying a basic vector map.
Once you’re comfortable with displaying a map, you can then display a map with your custom exported style by specifying the path to your JSON file during the map’s initialization, as shown in the snippet below:
var map = tt.map({
  container: 'map',
  key: 'xyz',
  style: 'path/to/my.json'
});
Conclusion
This article has shown how, beyond just embedding maps that come with generic features, we can create custom maps with the TomTom Map Styler. Being able to style our maps allows us to create maps that speak to our brand’s aesthetics.
Aesthetics aside, the Map Styler also presents us with the opportunity to optimize our maps for a better user experience. For example, we can use custom line widths and heights.
To learn more about TomTom’s mapping API, visit the documentation here.
* Required field. By submitting your contact details to TomTom, you agree that we can contact you about marketing offers, newsletters, or to invite you to webinars and events. We could further personalize the content that you receive via cookies. You can unsubscribe at any time by the link included in our emails. Review our privacy policy.